Are you confused about plotting the coordinate geometry graph maker? If yes then don’t worry we will help you plot the points on the coordinate geometry graph paper. The coordinate geometry graph the points and states whether they are collinear are or not. Coordinate geometry is one of the branches of geometry. The graph is plotted using the coordinates (x, y).
Do Refer:
- Coordinates of a Point
- Quadrants and Convention for Signs of Coordinates
- Problems on Plotting Points in the x-y Plane
Coordinate Geometry Graph – Definition
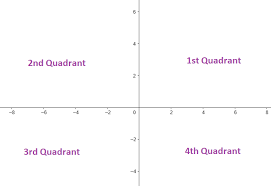
Coordinate geometry graphs deal with plotting and evaluating points, lines on the coordinate plane. The graph has two axes horizontal line is known as the x-axis and the vertical line is known as the y-axis. The coordinate graph is divided into four parts quadrant 1, quadrant 2, quadrant 3, and quadrant 4. The point of intersection of two lines is known as the origin with the ordinates (0, 0).
Coordinate Geometry Graph Questions and Answers
Example 1.
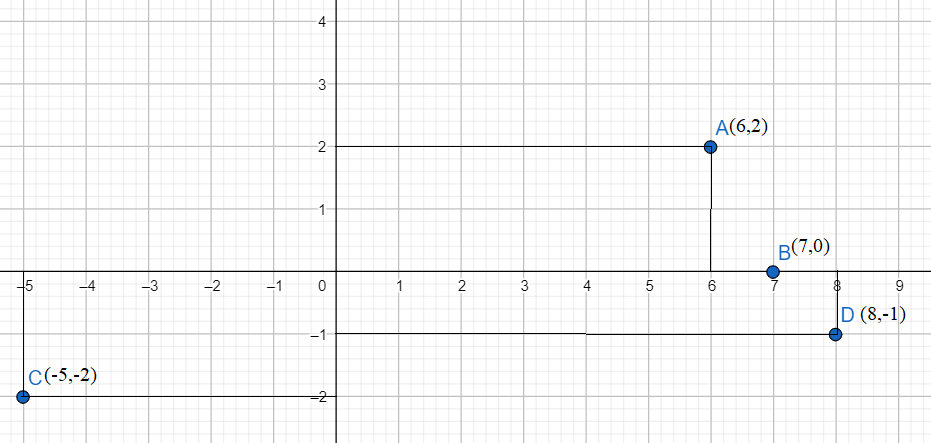
Plot each of the following points on a graph?
a. (6, 2) b. (7, 0) c. (-5, -2) d. (8, -1)
Solution:
Given points are (5, 2), (8, 0), (-5, -2), (9, -1)
Coordinates of the point (6, 2) both the x coordinate and y coordinate are positive so the point lies in the first quadrant. On the x-axis, take 6 units to the right of the y-axis and then on the y-axis, take 2 units above the x-axis.
Therefore, we get the point (6, 2).
Coordinates of the point (7, 0) both x coordinate and y coordinate are positive so the point lies in the first quadrant.
On the x-axis take 7 units and take 0 units on the y-axis to get the point (7, 0).
For the point (-5, -2), both x coordinate and y coordinate are negative so the point lies in the third quadrant. Take -5 units on the x-axis and take -2 units on the y-axis
and therefore we get the points (-5,-2).
The point (8, -1) lies in the fourth quadrant because the x-coordinate is positive and the y-coordinate is negative.
To plot this point, take 8 units on the x-axis and take -1 units on the y-axis.
Example 2.
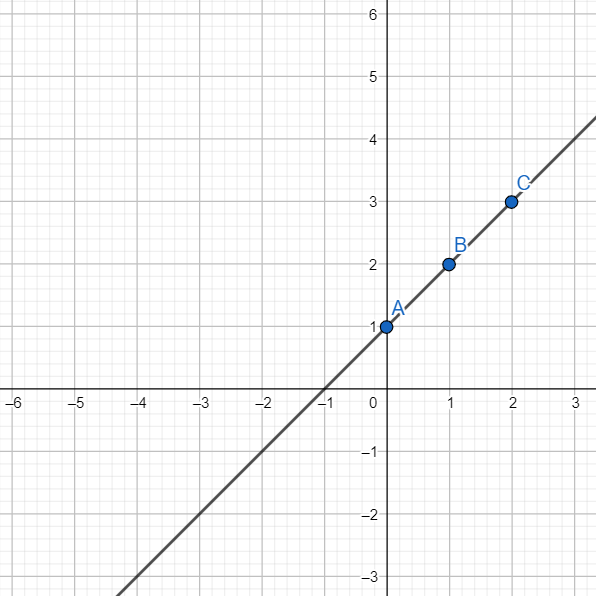
Draw the graph of the linear equation y = x + 1?
Solution:
Given linear equation is y = x + 1
The given equation is in the form of y = mx + c
slope m = 1, and constant c = 1
By using the trial and error method, find the value of y for each value of x.
If x = 0, y = 0 + 1, then y = 1
If x = 1, then y = 1 + 1 = 2
If x = 2, then y = 2 + 1 = 3
X 0 1 2
y 1 2 3
Plot the graph using the above table
Mark the points (0, 1), (1, 2), (2, 3) on the graph.
Example 3.
Find the equation of a line parallel to 3x+6y = 5 and pass-through points (2,2).
Solution:
For a line parallel to the given line, the slope will be of the same magnitude.
Thus the equation of a line will be represented as 3x+6y=k
Substituting the given points in this new equation, we have
k = 3 × 2 + 6 × 2 = 6 + 12 = 18
Therefore the equation is 3x + 6y = 18
Example 4.
Find the ratio in which the y−axis divides the line segment joining the points (5,-6) and (-1,-4). Also, find the point of intersection.
Solution:
Let the point be A(3,-6), B(-1,-4) and P(0,y)
Point P is on the y−axis,hence its x coordinate is 0.
So, it is in the form of P(0,y)
Now, we have to find a ratio.
Let the ratio be k:1
Hence m
m1=k, m2 =1, x1 = 3, y1= -6, x2 = -1,y2 = -4, x=0, y=0
Using sections formula x= m1x2 + m2x1/ m1 + m2
0= -k+3/k+1
Therefore k = 3
Again y= m1y2+m2y1/m1 + m2
= -4k-6/k+1
= -20-6/6
for k=3
= -18/4
Hence the coordinates of the point is P(0, -18/4).
Example 5.
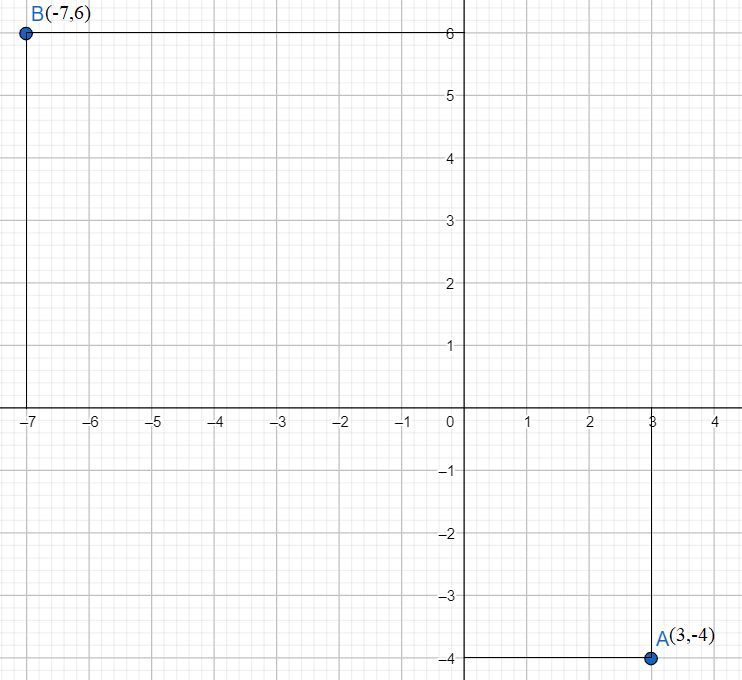
Plot the points (3,-4) and (-7,6)?
Solution:
Given that the points are (3,-4) and (-7,6)
Coordinates of the point (3, -4). Here the x coordinate is positive and the y coordinate is negative so the point lies in the fourth quadrant.
On the x-axis, take 3 units to the right of the y-axis and then on the y-axis, take 4 units above the x-axis.
Therefore, we get the point (3, -4).
Coordinates of the point (-7, 6). Here the x coordinate is negative and the y coordinate is positive so the point lies in the second quadrant.
On the x-axis, take 7 units to the right of the y-axis and then on the y-axis, take 6 units above the x-axis.
Therefore, we get the point (-7, 6).
FAQs on Coordinate Geometry Graph
1. What is the linear equation of the coordinate geometry?
The general form of a line in the coordinate geometry is Ax + By + C = 0
Where
A is the coefficient of x
B is the coefficient of y
C is the constant value.
Intercept form of a line is y = mx + c.
Where (x, y) is a point on the line m is the slope.
2. What is meant by Coordinate and Coordinate Planes?
A coordinate plane could be a 2-dimensional plane created by the intersection of two axes named horizontal axis (x-axis) and also the vertical axis (y-axis). These lines are perpendicular to every difference and meet at the purpose known as origin or zero. The axes divide the coordinate plane into four equal sections, and every section is understood because of the quadrant. The quantity line that has quadrants is additionally referred to as the sheet.
3. What are the Four different quadrants and their respective signs?
There are four quadrants
Quadrant 1: In this quadrant both x and y are positive. The point represented in this quadrant is (+x, +y).
Quadrant 2: In this quadrant X-axis is negative and the y-axis is positive. So, the point is shown as (-x, +y).
Quadrant 3: In this quadrant both the x and y-axis are negative. So the point in this quadrant is represented as (-x, -y).
Quadrant 4: In this quadrant, x is positive, and y is negative. The points in these Coordinates are (+x, -y).