Engage NY Eureka Math Algebra 1 Module 1 Lesson 1 Answer Key
Eureka Math Algebra 1 Module 1 Lesson 1 Example Answer Key
Example 1.
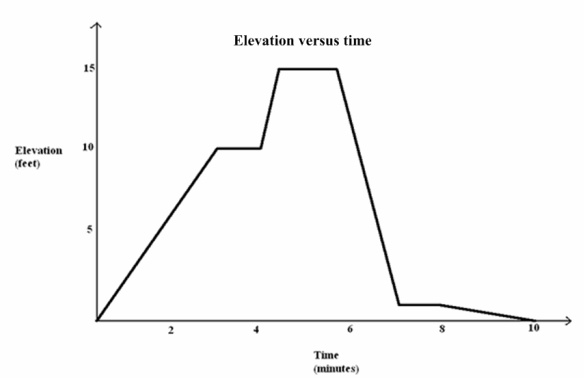
Here is an elevation-versus-time graph of a person’s motion. Can we describe what the person might have been doing?
Have students discuss this question in pairs or in small groups. It will take some imagination to create a context that matches the shape of the graph, and there will likely be debate.
Additional questions to ask:
→ What is happening in the story when the graph is increasing, decreasing, constant over time?
→ Answers will vary depending on the story: a person is walking up a hill, etc.
→ What does it mean for one part of the graph to be steeper than another?
→ The person is climbing or descending faster than in the other part.
→ How does the slope of each line segment relate to the context of the person’s elevation?
→ The slope gives the average change in elevation per minute.
→ Is it reasonable that a person moving up and down a vertical ladder could have produced this elevation versus time graph?
→ It is unlikely because the speed is too slow: 2.5 \(\frac{\mathrm{ft}}{\mathrm{min}}\). If the same graph had units in seconds then it would be reasonable.
→ Is it possible for someone walking on a hill to produce this elevation-versus-time graph and return to her starting point at the 10 min. mark? If it is, describe what the hill might look like.
→ Yes, the hill could have a long path with a gentle slope that would zigzag back up to the top and then a shorter, slightly steeper path back down to the beginning position.
→ What was the average rate of change of the person’s elevation between time 0 min. and time 4 min.?
→ \(\frac{10}{4}\) \(\frac{\mathrm{ft}}{\mathrm{min}}\), or 2.5 \(\frac{\mathrm{ft}}{\mathrm{min}}\).
These types of questions help students understand that the graph represents only elevation, not speed or horizontal distance from the starting point. This is an important observation.
Eureka Math Algebra 1 Module 1 Lesson 1 Exit Ticket Answer Key
Students may describe the intervals in words. Do not worry about the endpoints of the intervals in this lesson.
The graph in the Exploratory Challenge is made by combining pieces of nine linear functions (it is a piecewise linear function). Each linear function is defined over an interval of time, represented on the horizontal axis. List those nine time intervals.
Answer:
Between 0 and 3 sec.;
between 3 and 5.5 sec.;
between 5.5 and 7 sec.;
between 7 and 8.5 sec.;
between 8.5 and 9 sec.;
between 9 and 11 sec.;
between 11 and 12.7 sec.;
between 12.7 and 13 sec.;
and 13 sec. onward.
Eureka Math Algebra 1 Module 1 Lesson 1 Problem Set Answer Key
Question 1.
Watch the video, “Elevation vs. Time #3” (below).
http://www.mrmeyer.com/graphingstories1/graphingstories3.mov. (This is the third video under “Download Options” at the site http://blog.mrmeyer.com/?p=213 called “Elevation vs. Time #3.”)
It shows a man climbing down a ladder that is 10 ft. high. At time 0 sec., his shoes are at 10 ft. above the floor, and at time 6 sec., his shoes are at 3 ft. From time 6 sec. to the 8.5 sec. mark, he drinks some water on the step 3 ft. off the ground. After drinking the water, he takes 1.5 sec. to descend to the ground, and then he walks into the kitchen. The video ends at the 15 sec. mark.
a. Draw your own graph for this graphing story. Use straight line segments in your graph to model the elevation of the man over different time intervals. Label your x-axis and y-axis appropriately, and give a title for your graph.
Answer:
[See video for one example of a graph of this story.]
b. Your picture is an example of a graph of a piecewise linear function. Each linear function is defined over an interval of time, represented on the horizontal axis. List those time intervals.
Answer:
The intervals are [0,6], (6,8.5], (8.5,10], and (10,15], with the understanding that the inclusion of the endpoints may vary. Students may use any notation they want to describe the intervals.
c. In your graph in part (a), what does a horizontal line segment represent in the graphing story?
Answer:
It is a period of time when he is neither going up nor down.
d. If you measured from the top of the man’s head instead (he is 6.2 ft. tall), how would your graph change?
Answer:
The whole graph would be shifted up 6.2 ft.
e. Suppose the ladder descends into the basement of the apartment. The top of the ladder is at ground level (0 ft.) and the base of the ladder is 10 ft. below ground level. How would your graph change in observing the man following the same motion descending the ladder?
Answer:
The whole graph would be shifted downward 10 ft.
f. What is his average rate of descent between time 0 sec. and time 6 sec.? What was his average rate of descent between time 8.5 sec. and time 10 sec.? Over which interval does he descend faster? Describe how your graph in part (a) can also be used to find the interval during which he is descending fastest.
Answer:
His average rate of descent between 0 and 6 sec. was \(\frac{7}{6}\) \(\frac{\mathrm{ft}}{\mathrm{sec}}\).
His average rate of descent between 8.5 and 10 sec. was 2 \(\frac{\mathrm{ft}}{\mathrm{sec}}\).
He was descending faster from 8.5 to 10 sec.
The interval during which he is descending the fastest corresponds to the line segment with the steepest negative slope.
Question 2.
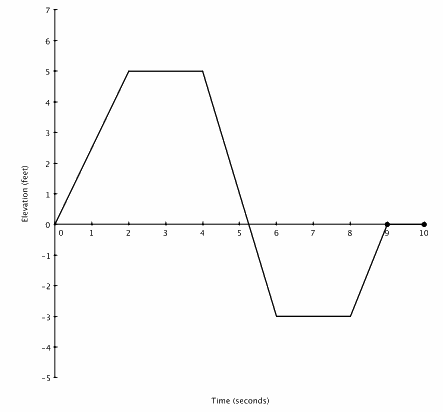
Create an elevation-versus-time graphing story for the following graph:
Answer:
Answers will vary. A story such as the following fits the graph:
A swimmer climbs a ladder to a waterslide, sits for two seconds at the top of the slide, and then slides down the slide into water. She stays steady at the same position underwater for two seconds before rising to the surface.
Teachers should also accept other contexts, such as interpreting “0 elevation” as the height of a deck 3 ft. above ground.
Question 3.
Draw an elevation-versus-time graphing story of your own, and then create a story for it.
Answer:
Answers will vary. Do not be too critical of their graphs and stories.