Engage NY Eureka Math Algebra 1 Module 1 Lesson 2 Answer Key
Eureka Math Algebra 1 Module 1 Lesson 2 Example Answer Key
Example 1.
Show the video of a ball rolling down a ramp given at http://mbc.sandi.net/library/311612, telling the class that our goal is simply to describe in words the motion of the ball. (If the link does not work, search for “Algebra I, Module 1 Lesson 2 ball rolling down ramp video.”)
After viewing the video, have students share aloud their ideas on describing the motion. Some might speak in terms of speed, distance rolled over time, or change of elevation. All approaches are valid. Help students begin to shape their ideas with language that specifies the names of the quantities being observed and how they are changing over time.
Direct the class to focus on the change of elevation of the ball over time and to begin to put into words specific details linking elevation with time.
→ It first started at the top of the ramp.
→ It rolled down the ramp for about 2 sec.
→ After it hit the bottom of the ramp, it rolled across the floor.
If students do not naturally do so, suggest representing this information on a graph. Display a set of axes on the board.
Begin a discussion that leads students through issues of formalizing the diagram: The labels and units of the axes, a title for the graph, the meaning of a point plotted on the graph, the height at time 0 sec., the time when it reached the bottom of the ramp, etc.
Either individually or in groups of two, have students estimate the general shape of the graph of the elevation-versus-time of the ball rolling down the ramp. At this point, do not worry about engaging students in measuring specific heights and specific times; right now they are just looking for the general shape. Be sure to have students notice the horizontal “tail” of the graph, and ask them to interpret its meaning. (The elevation of the ball does not change as it rolls across the floor.) Some students may draw a curved graph. Others will likely draw a straight line for the graph over the interval 0 to 1.7 sec. Even though this is not correct, allow it at this stage.
After students have created graphs, have them compare their graphs with each other and share with the class. Ask the following questions:
→ Should the change in elevation be decreasing at a constant rate? That is, do you think this graph should be a straight line graph, at least between 0 sec. and about 1.7 sec.?
Some specific questions (below) can help lead to the correct conclusion:
→ Where does the elevation change more slowly? Explain.
→ If it is changing more slowly at the top and more quickly at the bottom, should the graph look the same at those times?
In Exploratory Challenge, students see an elevation-versus-time graph that is clearly not a straight line.
Exploratory Challenge
Plot a graphical representation of change in elevation over time for the following graphing story. It is a video of a man jumping from 36 ft. above ground into 1 ft. of water.
http://www.youtube.com/watch?v=ZCFBC8aXz-g or
http://youtu.be/ZCFBC8aXz-g (If neither link works, search for “OFFICIAL Professor Splash World Record Video!”)
Allow students to analyze the full video, initially giving them as much control as possible (if not full control) in choosing when to pause the video, play it half speed, and so on. Perhaps conduct this part of a class in a computer lab or display the video on an interactive white board. Then direct students to investigate one of the two portions of the clip below, depending on the level of technology you have available:
Portion 1: From time 32 sec. to time 33 sec. Use this to get data for drawing the graph (if they have access to a powerful movie editor that can show each frame).
Portion 2: From time 48 sec. to time 53 sec. Use this for a slow-motion version that can be analyzed easily via YouTube.
Note: In this lesson, keep students’ focus on understanding the relationship between physical measurements and the graph. Students will revisit scenarios like this one in Modules 4 and 5. We know, from physics, that the height function for this example can be modeled by s(t)=36-16t^2 and that in this case, the function models the situation very accurately. For example, the function predicts that he will hit the water at exactly 1.5 sec., which he does. However, quadratic equations and functions are topics for later modules.
Students should start measuring from the top of the man’s jump, which is about 36 ft. high. (He starts at 35.5 ft. and jumps \(\frac{1}{2}\) ft. up before falling.)
Solutions are provided below for each portion.
Give students the opportunity to share their work with the class as a whole or with a partner. Have students articulate and justify any interesting choices they have made. For example, instead of plotting points for every second of footage, some students may wish to plot the time per distance markers (36, 30, 25, 20, 15, etc.). Both methods lead to a graph of a quadratic function.
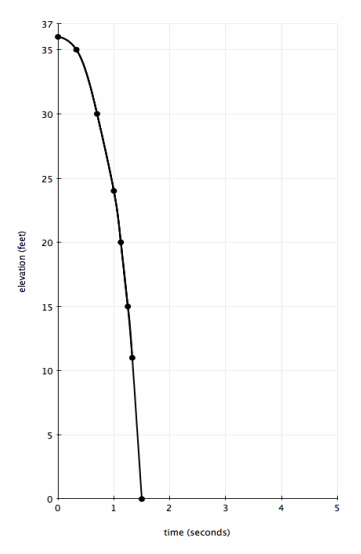
Students should produce graphs that look similar to the following, according to which clip they used:
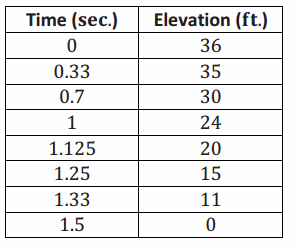
Portion 1 Results: If your students used Portion 1, they should get something that looks similar to the table (right) and graph (on the previous page).
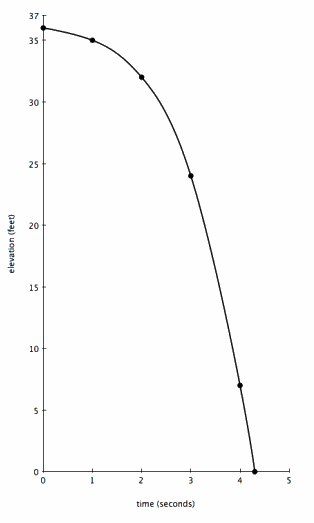
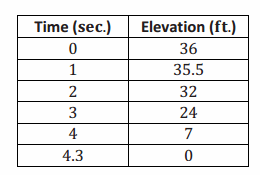
The estimates of the heights in the table are based upon the markers in the video. Since the video is taken from the ground, reading height directly from the video can be hampered by the parallax effect. Ideally, for accurate reading, the camera should be at the same height as the jumper at all times so the height reading from the ruler in the background could be accurate. Remind students to make some necessary corrections or adjustments instead of just reading horizontally across the frozen video frame. Regardless, you should not expect your students to have perfect graphs, but their graphs should not be straight lines.Portion 2 Results: If your students used Portion 2 of the video, they should get something that looks similar to the table (below) and graph (right). Have a discussion with them that the results below do not model the actual situation. By specifically talking about film time versus real time, we lay the foundation to talk about transformations of functions. Guide students by asking these questions:
→ What would you need to do to this graph to correctly model the jump with a graph?
→ You need to know how long it took for him to complete the jump.
→ It takes the jumper exactly 1.5 sec. from the top of his jump until he splashes in the water.
→ Then we should shrink the graph horizontally until the t-intercept is at 1.5 sec.
→ Learning how to shrink graphs in this way will be an important topic in Modules 3 and 5.
As an extension, encourage students to try adjusting the graph in this way (shrinking it horizontally such that the t-intercept is at 1.5 sec.), using their intuition to guide them, and compare their results with their peers.
Example 2.
The table below gives the area of a square with sides of whole number lengths. Have students plot the points in the table on a graph and draw the curve that goes through the points.
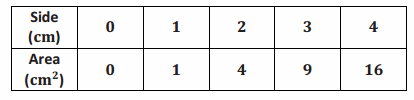
On the same graph, reflect the curve across the y-axis. This graph is an example of a graph of a quadratic function.
Bring up or ask:
→ On the graph, what do the points between the plotted points from the table represent?
→ Areas of squares with non-whole number side lengths.
Eureka Math Algebra 1 Module 1 Lesson 2 Exit Ticket Answer Key
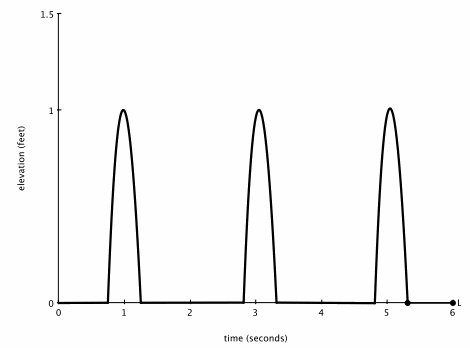
If you jumped in the air three times, what might the elevation versus time graph of that story look like? Label the axes appropriately.
Answer:
Student answers will vary.
I jump about 1 ft. high every other second.
Eureka Math Algebra 1 Module 1 Lesson 2 Problem Set Answer Key
Question 1.
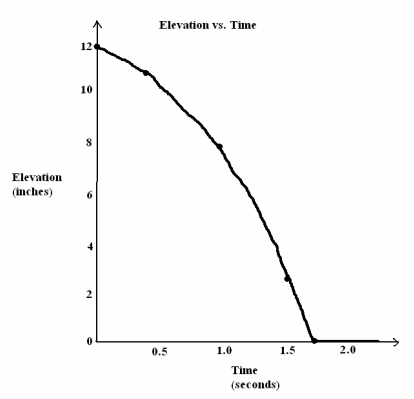
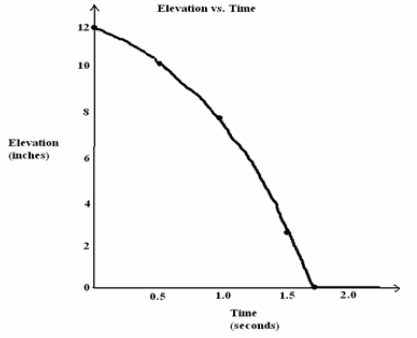
Here is an elevation-versus-time graph of a ball rolling down a ramp. The first section of the graph is slightly curved.
a. From the time of about 1.7 sec. onward, the graph is a flat horizontal line. If Ken puts his foot on the ball at time 2 sec. to stop the ball from rolling, how will this graph of elevation versus time change?
Answer:
Even if the ball is at rest on the floor, its elevation remains 0 in. and does not change. The elevation-versus-time graph does not change.
b. Estimate the number of inches of change in elevation of the ball from 0 sec. to 0.5 sec. Also estimate the change in elevation of the ball between 1.0 sec. and 1.5 sec.
Answer:
Between 0 and 0.5 sec., the change in elevation was about -2 in. Between 1.0 and 1.5 sec., the change in elevation was about -5.5 in.
c. At what point is the speed of the ball the fastest, near the top of the ramp at the beginning of its journey or near the bottom of the ramp? How does your answer to part (b) support what you say?
Answer:
The speed of the ball is the fastest near the bottom of the ramp. During the \(\frac{1}{2}\) sec. from 1.0 sec. to 1.5 sec., the ball’s change in elevation is greater than the \(\frac{1}{2}\) sec. at the beginning of its journey. It must have traversed a greater length of the ramp during this \(\frac{1}{2}\) sec. and so was traveling faster. Its speed is greater near the bottom of the ramp.
Question 2.
Watch the following graphing story:
Elevation vs. Time #4 [http://www.mrmeyer.com/graphingstories1/graphingstories4.mov. This is the second video under “Download Options” at the site http://blog.mrmeyer.com/?p=213 called “Elevation vs. Time #4.”]
The video is of a man hopping up and down several times at three different heights (first, five medium-sized jumps immediately followed by three large jumps, a slight pause, and then 11 very quick small jumps).
a. What object in the video can be used to estimate the height of the man’s jump? What is your estimate of the object’s height?
Answer:
The stair step. Answers will vary between 4 in. to 8 in.
b. Draw your own graph for this graphing story. Use parts of graphs of quadratic functions to model each of the man’s hops. Label your x-axis and y-axis appropriately and give a title for your graph.
Answer:
Answers will vary but should reflect the estimate made in part (a). See the end of the video for a picture of the graph.
Question 3.
Use the table below to answer the following questions.
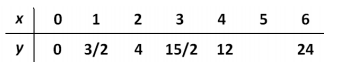
a. Plot the points (x,y) in this table on a graph (except when x is 5).
Answer:
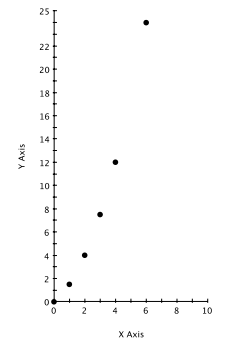
b. The y-values in the table follow a regular pattern that can be discovered by computing the differences of consecutive y-values. Find the pattern and use it to find the y-value when x is 5.
Answer:
The y-values have differences that increase by one, suggesting that we next have a y-value of 12+\(\frac{11}{2}\)=\(\frac{35}{2}\) when x is 5.
c. Plot the point you found in part (b). Draw a curve through the points in your graph. Does the graph go through the point you plotted?
Answer:
Yes.
d. How is this graph similar to the graphs you drew in Examples 1 and 2 and the Exploratory Challenge? Different?
Answer:
Answers will vary. This graph is similar to the graphs from Examples 1 and 2 of the Exploratory Challenge in that the curve has the same basic U-shape. (Students may mention that they are all graphs of quadratic functions, although at this point that is not necessary.) This graph is different from the graphs from Example 1 and the Exploratory Challenge because this curve is increasing and the graphs in Example 1 and the Exploratory Challenge are decreasing. This graph is similar to the graph from Example 2 because they are both increasing. However, this graph increases at a slower rate than the one from Example 2. For example, this graph has value 12 when x is 4 (the Example 2 graph had value 16), and this graph has value 24 when x is 6 (the Example 2 graph had value 36).
Question 4.
A ramp is made in the shape of a right triangle using the dimensions described in the picture below. The ramp length is 10 ft. from the top of the ramp to the bottom, and the horizontal width of the ramp is 9.25 ft.
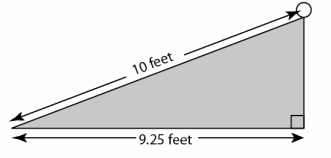
Answer:
A ball is released at the top of the ramp and takes 1.6 sec. to roll from the top of the ramp to the bottom. Find each answer below to the nearest 0.1 \(\frac{\mathrm{ft}}{\mathrm{sec}}\).
a. Find the average speed of the ball over the 1.6 sec.
Answer:
\(\frac{10}{1.6}\) \(\frac{\mathrm{ft}}{\mathrm{sec}}\), or 6.3 \(\frac{\mathrm{ft}}{\mathrm{sec}}\)
b. Find the average rate of horizontal change of the ball over the 1.6 sec.
Answer:
\(\frac{9.25}{1.6}\) \(\frac{\mathrm{ft}}{\mathrm{sec}}\) or 5.8 \(\frac{\mathrm{ft}}{\mathrm{sec}}\)
c. Find the average rate of vertical change of the ball over the 1.6 sec.
Answer:
By the Pythagorean theorem, the vertical length is approximately \(\sqrt{10^{2}-9.25^{2}}\)≈3.8 ft. Hence, the average rate of vertical change is \(\frac{3.8}{1.6}\) \(\frac{\mathrm{ft}}{\mathrm{sec}}\) or 2.4 \(\frac{\mathrm{ft}}{\mathrm{sec}}\).
d. What relationship do you think holds for the values of the three average speeds you found in parts (a), (b), and (c)? (Hint: Use the Pythagorean theorem.)
Answer:
The sum of the squares of the horizontal and vertical rates of change is equal to the square of the speed of the ball.