Engage NY Eureka Math Algebra 1 Module 1 Lesson 3 Answer Key
Eureka Math Algebra 1 Module 1 Lesson 3 Example Answer Key
Example.
Consider the story:
Darryl lives on the third floor of his apartment building. His bike is locked up outside on the ground floor. At 3:00 p.m., he leaves to go run errands, but as he is walking down the stairs, he realizes he forgot his wallet. He goes back up the stairs to get it and then leaves again. As he tries to unlock his bike, he realizes that he forgot his keys. One last time, he goes back up the stairs to get his keys. He then unlocks his bike, and he is on his way at 3:10 p.m.
Sketch a graph that depicts Darryl’s change in elevation over time.
Answer:
There will be variations in the students’ graphs, but the graph students produce should appear as follows:
Exploratory Challenge
Watch the following graphing story:
The video shows bacteria doubling every second.
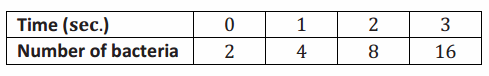
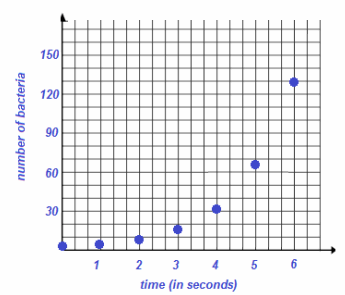
Get students started by creating a table of the first few seconds. Stop the video as close as possible to the 0 sec. mark, 1 sec. mark, 2 sec. mark, 3 sec. mark, and so on. Have students count the bacteria at each of those times. Note that some of the bacteria have not fully divided, so expect a discussion on how to count them (guide students to make the choice: approximately the length of a small bacterium). Do not suggest any model just yet as there are some great number sense problems to explore first. Below is a fairly accurate account of the number of bacteria up to the 3 sec. mark:
The 4 sec. mark is already tricky to count (approximately 31 or 32), as well as at the 5 sec. mark (approximately 58–62). Ask students what they might expect to see at time 6 sec. (approximately 116–130). Do not have students count the bacteria at time 6 sec. but instead estimate the number (e.g., the radius of the circular region of bacteria doubles roughly every second).
Students might first produce a graph similar to this:
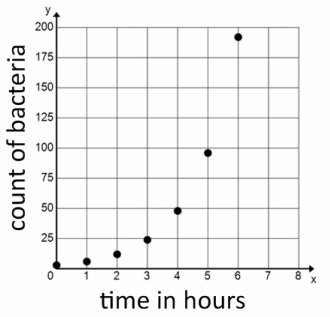
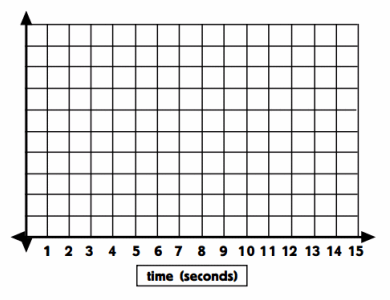
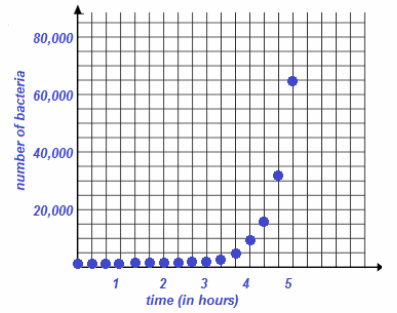
a. Graph the number of bacteria versus time in seconds. Begin by counting the number of bacteria present at each second and plotting the appropriate points on the set of axes below. Consider how you might handle estimating these counts as the population of the bacteria grows.
Answer:
Ask for, or eventually suggest, the following model to describe the bacteria shown in the video:
→ At time 0 sec., there are 2 bacteria, and the number of bacteria in the Petri dish doubles every second. Stress the point to students that this model does not describe the exact number of bacteria at a given time in the video but that it does reasonably represent an estimate of the number of bacteria at a given time.
Ask students to create a graph that represents bacterial population growth beyond the 6 sec. mark using this model. Two challenges will quickly arise for students: Identifying an appropriate scale for the vertical axis and dealing with the extraordinarily large numbers that arise from this mark onward. Suggest that students first describe the shape of the graph after the 6 sec. mark. To help with larger values, a table can be expanded beyond the 6 sec. mark using scientific notation.
A good question to ask:
→ Will the curve ever be perfectly vertical?
To develop the real-time exponential growth of the bacteria, state:
→ Listen to what the narrator says about the situation, “Just one bacterium, dividing every 20 min. … .”
Then ask:
→ If one bacterium divides once every 20 min., how much real time has passed in what we watched in the time-lapse video?
To help students answer this question, return to the beginning of the video, with two bacteria, and notice how many bacteria there are after 1 sec. There are four. And at the 2 sec. mark, there are eight. Have students conclude that one second of video time matches about 20 min. of real time.
→ We first created a graph with the unit scale for the horizontal axis as seconds. This time scale is according to the video’s clock. How could we change the scale of the horizontal axis so that it represents the real time of bacteria growth?
Students may suggest “crossing out the marks 1 sec., 2 sec., 3 sec., …” on the horizontal axis and replacing them with the numbers “20 min., 40 min., 60 min., … .” While this is acceptable, suggest being careful and deliberate by drawing a table of values akin to the following:
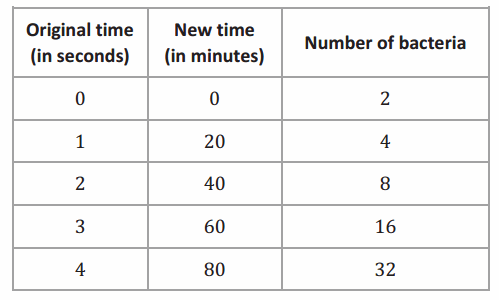
Use this table as a discussion point for justifying the change of scale for the horizontal axis.
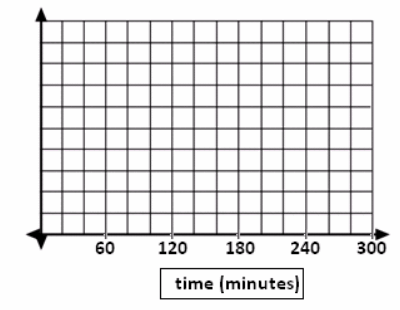
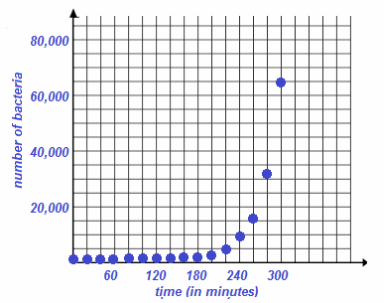
Have them sketch a graph of the count of bacteria versus (real) time in minutes for the first five-hour period. Lead students in a discussion to decide on appropriate scales for the vertical and horizontal axes. If needed, encourage the students to extend their tables to determine the number of bacteria at the end of the five-hour period before they decide on the scale. The students’ graphs do not need to match exactly the sample provided below but should accurately depict the points over the first 300 min.
Students may instinctively connect the points with a smooth curve. It is acceptable to use the curve as a model of the reality of the discrete points on the graph; however, encourage students to recognize the difference between the points supported by the context and a continuous curve that is a model of the situation.
b. Graph the number of bacteria versus time in minutes.
Answer:
Now, have students redraw this graph with the unit scale of the horizontal axis as hours.
c. Graph the number of bacteria versus time in hours (for the first five hours).
Answer:
Eureka Math Algebra 1 Module 1 Lesson 3 Problem Set Answer Key
Question 1.
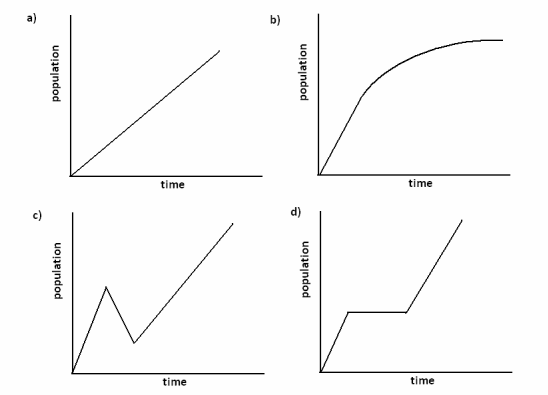
Below are three stories about the population of a city over a period of time and four population-versus-time graphs. Two of the stories each correspond to a graph. Match the two graphs and the two stories. Write stories for the other two graphs, and draw a graph that matches the third story.
Story 1: The population size grows at a constant rate for some time, then doesn’t change for a while, and then grows at a constant rate once again.
Story 2: The population size grows somewhat fast at first, and then the rate of growth slows.
Story 3: The population size declines to zero.
Answer:
Story 1 corresponds to (d), and Story 2 corresponds to (b). For Story 3 answers will vary. The graph can begin at any positive population value and decrease to 0 in any manner.
Sample story for (a): The population starts out at 0 and grows at a constant rate.
Sample story for (c): The population size grows at a constant linear rate for some time, then decreases at a constant linear rate for a while, and then increases at a constant linear rate slower than the original rate of increase.
Question 2.
In the video, the narrator says:
“Just one bacterium, dividing every 20 min., could produce nearly 5,000 billion billion bacteria in one day. That is 5,000,000,000,000,000,000,000 bacteria.”
This seems WAY too big. Could this be correct, or did she make a mistake? (Feel free to experiment with numbers using a calculator.)
Answer:
Yes, this is correct. Do not be too critical of justifications. Accept any explanation that reasonably explains why she is correct.
For the teacher: The function f(t)=\(2^{\left(\frac{t}{20}\right)}\) models the number of bacteria after t minutes starting from a single bacterium. There are 1,440 min. in a 24 hr. period, which means that since the bacteria divide every 20 min., the count of the bacteria will double 72 times during a 24 hr. period. Thus, the answer is f(1440)=272 , which is approximately 4.72×10²¹ . This number is nearly 5,000 billion billion bacteria.
Question 3.
Bacillus cereus is a soil-dwelling bacterium that sometimes causes food poisoning. Each cell divides to form two new cells every 30 min. If a culture starts out with exactly 100 bacterial cells, how many bacteria will be present after 3 hr.?
Answer:
The result is 26 (100)=6400 bacteria. Students can do this by repeated multiplication, without much knowledge of exponential functions.
Question 4.
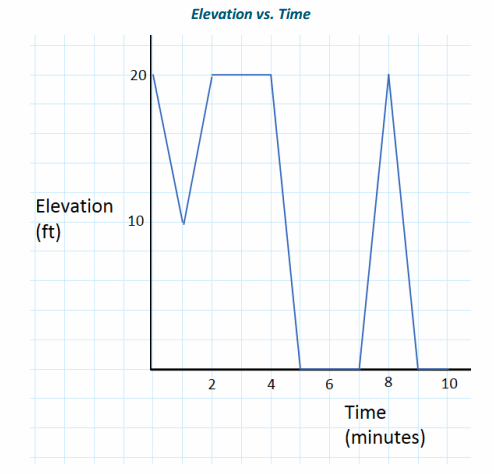
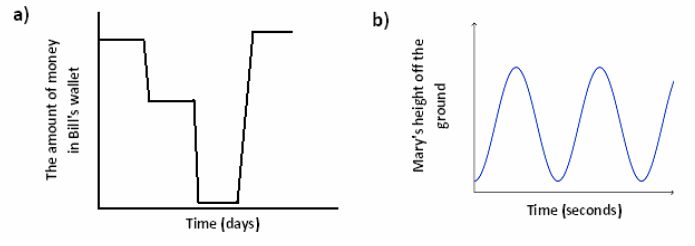
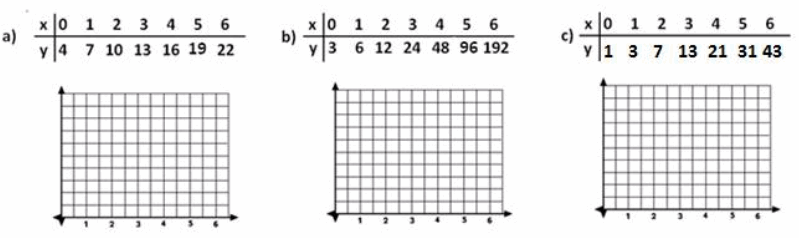
Create a story to match each graph below:
Answer:
Answers will vary.
Sample story for (a): Bill received his paycheck and did not touch it for a few days. Then, he bought groceries and gas and stopped spending money. After a few more days, he spent almost all of his remaining money on a new jet ski. A few days later he received his paycheck.
Sample story for (b): Mary is riding a Ferris wheel at a theme park.
Question 5.
Consider the following story about skydiving:
Julie gets into an airplane and waits on the tarmac for 2 min. before it takes off. The airplane climbs to 10,000 ft. over the next 15 min. After 2 min. at that constant elevation, Julie jumps from the plane and free falls for 45 sec. until she reaches a height of 5,000 ft. Deploying her chute, she slowly glides back to Earth over the next 7 min. where she lands gently on the ground.
a. Draw an elevation-versus-time graph to represent Julie’s elevation with respect to time.
Answer:
The graph should depict the horizontal line y=0 from 0 min. to 2 min., a linear increase to 10,000 ft. from 2 min. to 17 min., a brief free fall (concave down) curve for 45 sec., and then a leveled out concave up curve for the slow fall at the end.
b. According to your graph, describe the manner in which the plane climbed to its elevation of 10,000 ft.
Answer:
Answers will vary depending on the graph. Example: I assumed that the plane climbed at a constant rate.
c. What assumption(s) did you make about falling after she opened the parachute?
Answer:
Answers may vary. Example: I assumed that her change in elevation slowed down suddenly when she opened her parachute and then was an almost constant rate of change until she reached the ground.
Question 6.
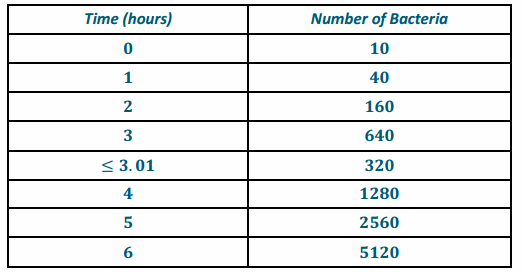
Draw a graph of the number of bacteria versus time for the following story: Dave is doing an experiment with a type of bacteria that he assumes divides in half exactly every 30 min. He begins at 8:00 a.m. with 10 bacteria in a Petri dish and waits for 3 hr. At 11:00 a.m., he decides this is too large of a sample and adds Chemical A to the dish, which kills half of the bacteria almost immediately. The remaining bacteria continue to grow in the same way. At noon, he adds Chemical B to observe its effects. After observing the bacteria for two more hours, he observes that Chemical B seems to have cut the growth rate in half.
Answer:
Answers vary somewhat, but the graph should include the information in the table below connected by some smooth curve. There should be a sudden decrease from 640 to 320 after time 3 (i.e., 3 hr.), say around time 3.01 or sooner, giving a nearly vertical line.
Question 7.
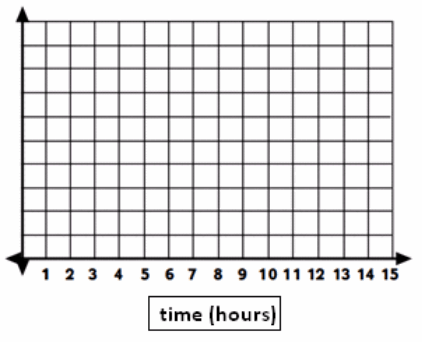
Decide how to label the vertical axis so that you can graph the data set on the axes below. Graph the data set and draw a curve through the data points.
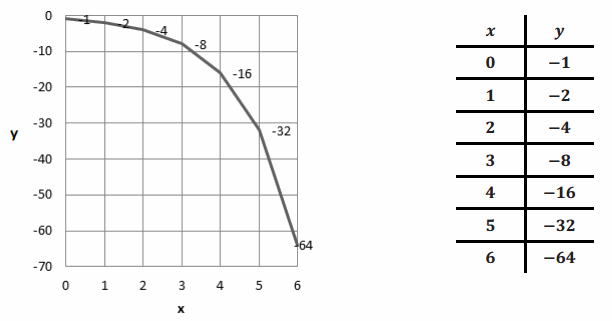
Answer:
(A sample graph is shown above.)
Eureka Math Algebra 1 Module 1 Lesson 3 Exit Ticket Answer Key
Assume that a bacteria population doubles every hour. Which of the following three tables of data, with x representing time in hours and y the count of bacteria, could represent the bacteria population with respect to time? For the chosen table of data, plot the graph of that data. Label the axes appropriately with units.
Answer:
The answer is (b).