Engage NY Eureka Math Algebra 1 Module 2 Lesson 9 Answer Key
Eureka Math Algebra 1 Module 2 Lesson 9 Exploratory Challenge Answer Key
Exploratory Challenge 1: Superhero Powers
Superheroes have been popular characters in movies, television, books, and comics for many generations. Superman was one of the most popular series in the 1950s, while Batman was a top-rated series in the 1960s. Each of these characters was also popular in movies released from 1990 to 2013. Other notable characters portrayed in movies over the last several decades include Captain America, She-Ra, and the Fantastic Four. What is special about a superhero? Is there a special superhero power that makes these characters particularly popular?
High school students in the United States were invited to complete an online survey in 2010. Part of the survey included questions about superhero powers. More than 1,000 students responded to this survey that included a question about a favorite superhero power. Researchers randomly selected 450 of the completed surveys. A rather confusing breakdown of the data by gender was compiled from the 450 surveys:
→ 100 students indicated their favorite power was to fly. 49 of those students were females.
→ 131 students selected the power to freeze time as their favorite power. 71 of those students were males.
→ 75 students selected invisibility as their favorite power. 48 of those students were females.
→ 26 students indicated super strength as their favorite power. 25 of those students were males.
→ And finally, 118 students indicated telepathy as their favorite power. 70 of those students were females.
Direct students to read through the example and examine the data. Then, discuss the following questions to determine their understanding of the example:
→ What is the most popular superpower?
→ Freeze time
→ What is the least popular?
→ Super strength
→ Why would the survey include gender?
→ The survey includes gender in order to investigate whether or not there is a difference in the selection of a superpower for males or females.
→ Do you think gender plays a role in superhero power preference?
→ Answers will vary, but in most cases, there are differences in the selection of a superpower by males or females.
Exploratory Challenge 2:
A Statistical Study Involving a Two-Way Frequency Table
The data in Example 1 prompted students in a mathematics class to pose the statistical question, “Do high school males have different preferences for superhero powers than high school females?” Answering this statistical question involves collecting data as well as anticipating variability in the data collected.
The data consist of two responses from each student completing a survey. The first response indicates a student’s gender, and the second response indicates the student’s favorite superpower. For example, data collected from one student was male and to fly. The data are bivariate categorical data.
The first step in analyzing the statistical question posed by students in their mathematics class is to organize this data in a two-way frequency table.
A two-way frequency table that can be used to organize the categorical data is shown below. The letters below represent the frequency counts of the cells of the table.
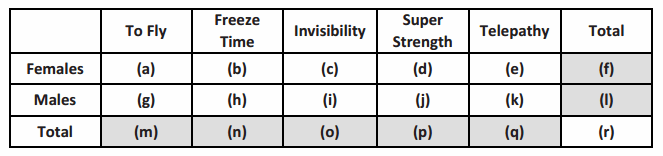
→ The shaded cells are called marginal frequencies. They are located around the margins of the table and represent the totals of the rows or columns of the table.
→ The non-shaded cells within the table are called joint frequencies. Each joint cell is the frequency count of responses from the two categorical variables located by the intersection of a row and column.
Ask students why the question posed is a statistical question. Remind students that a statistical question is a question that is answered by data and that it is anticipated that the data will vary. This question is a statistical question because the responses (data) are collected, and varied responses are expected (there are a variety of responses).
Explain the definition of categorical data and how it relates to Example 1.
Then, discuss the following:
→ What is the difference between categorical and numerical data? (Remind students that answers to questions such as the superhero powers involve responses that are categories.)
→ Provide examples of numerical data from past lessons to contrast with categorical data.
Have students examine the two-way frequency table.
Then, discuss the following:
→ Is it possible to switch the row and column categories?
→ Yes, male and female could be used as the column headings, and the superpowers could be represented in each row.
Eureka Math Algebra 1 Module 2 Lesson 9 Exercise Answer Key
Exercises 1–4
Several superheroes portrayed in movies and television series had at least one extraordinary power. Some superheroes had more than one special power. Was Superman’s power to fly the favorite power of his fans, or was it his super strength? Would females view the power to fly differently than males, or in the same way? Use the survey information given in Example 1 to answer the following questions.
Exercise 1.
How many more females than males indicated their favorite power is telepathy?
Answer:
22 more females indicated their favorite power was telepathy.
Exercise 2.
How many more males than females indicated their favorite power was to fly?
Answer:
Two more males indicated their favorite power was to fly.
Exercise 3.
Write survey questions that you think might have been used to collect this data.
Answer:
→ What is your gender? ____ Male ____ Female
→ If you could possess just one superpower, what would it be?
___ To fly ___ Freeze time ___ Invisibility ____ Super strength ___ Telepathy
Exercise 4.
How do you think the 450 surveys used in Example 1 might have been selected? You can assume that there were 1,000 surveys to select from.
Answer:
A process involving random selection is needed.
Exercises 5–12
Exercise 5.
Describe the data that would be counted in cell (a).
Answer:
Cell (a) represents the number of females who chose to fly.
Exercise 6.
Describe the data that would be counted in cell (j).
Answer:
Cell (j) represents the number of males who chose super strength.
Exercise 7.
Describe the data that would be counted in cell (l).
Answer:
Cell (l) represents the total number of males who completed the survey in this sample.
Exercise 8.
Describe the data that would be counted in cell (n).
Answer:
Cell (n) represents the total number of students who chose freeze time as their favorite superpower.
Exercise 9.
Describe the data that would be counted in cell (r).
Answer:
Cell (r) represents the total number of students in the sample.
Exercise 10.
Cell (i) is the number of male students who selected invisibility as their favorite superpower. Using the information given in Example 1, what is the value of this number?
Answer:
Twenty-seven males selected invisibility.
Exercise 11.
Cell (d) is the number of females whose favorite superpower is super strength. Using the information given in Example 1, what is the value of this number?
Answer:
One female selected super strength.
Exercise 12.
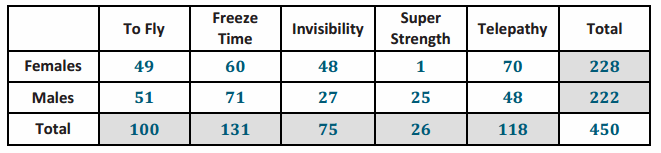
Complete the table below by determining a frequency count for each cell based on the summarized data.
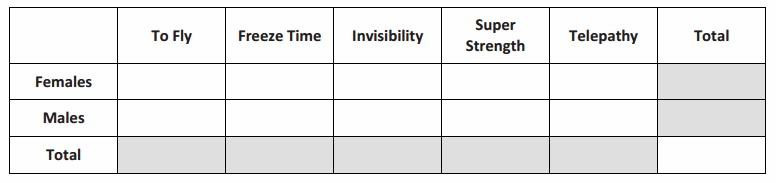
Answer:
Eureka Math Algebra 1 Module 2 Lesson 9 Problem Set Answer Key
Several students at Rufus King High School were debating whether males or females were more involved in after-school activities. There are three organized activities in the after-school program—intramural basketball, chess club, and jazz band. Due to budget constraints, a student can only select one of these activities. The students were not able to ask every student in the school whether they participated in the after-school program or what activity they selected if they were involved.
Question 1.
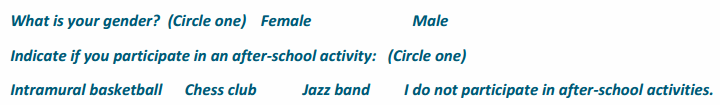
Write questions that could be included in the survey to investigate the question the students are debating. Questions that could be used for this study include the following:
Answer:
Question 2.
Rufus King High School has approximately 1,500 students. Sam suggested that the first 100 students entering the cafeteria for lunch would provide a random sample to analyze. Janet suggested that they pick 100 students based on a school identification number. Who has a better strategy for selecting a random sample? How do you think 100 students could be randomly selected to complete the survey?
Answer:
Sam’s suggestion is the least likely to generate a random sample because it will be primarily a convenience sample based on factors that influence who has lunch first (for example, certain grade levels, certain classes). Selections that involve ID numbers from the entire school are more likely to result in a more random selection. Contacting the 100 students selected by their IDs and asking them to complete the survey is not necessarily an easy or even workable process. I think I would ask students to take the survey just as they are leaving school. Nearly everyone in school gathers outside for a few minutes. I would try to get a completed survey from one out of every 50 students so that I would not get surveys just from one group.
Question 3.
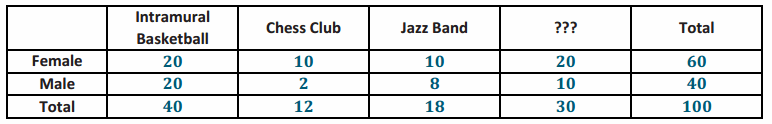
Consider the following results from 100 randomly selected students:
→ Of the 60 female students selected, 20 of them played intramural basketball, 10 played chess, and 10 were in the jazz bland. The rest of them did not participate in the after-school program.
→ Of the male students, 10 did not participate in the after-school program, 20 played intramural basketball, 8 played in the jazz band, and the rest played chess.
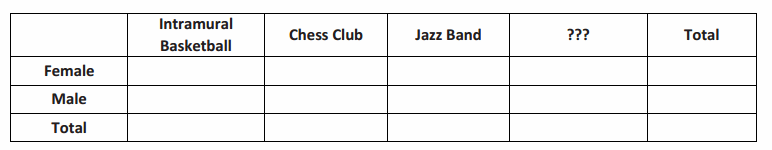
A two-way frequency table to summarize the survey data was started. Indicate what label is needed in the table cell identified with a ???.
Answer:
The ??? could be labeled, “Do not participate in after-school program.”
Question 4.
Complete the above table for the 100 students who were surveyed.
Answer:
Answers are provided in the table.
Question 5.
The table shows the responses to the after-school activity question for males and females. Do you think there is a difference in the responses of males and females? Explain your answer.
Answer:
Yes, I think that there are differences in the responses for males and females. Quite a few more females selected chess club. However, more females were surveyed than males. Also, half of the males selected basketball, while only a third of the females selected basketball. (Allow students to indicate that they are not sure how to compare the frequencies. For students forming an answer, the frequencies in the table are compared to the number of males or the number of females. Use this question to point out that more needs to be considered before we can really answer the question of whether or not there is a difference in the responses for males or females. Also, point out that a strategy for answering this type of question is developed in the next two lessons.)
Eureka Math Algebra 1 Module 2 Lesson 9 Exit Ticket Answer Key
Question 1.
A survey asked the question, “How tall are you to the nearest inch?” A second question on this survey asked, “What sports do you play?” Indicate what type of data, numerical or categorical, would be collected from the first question? What type of data would be collected from the second question?
Answer:
The first question would result in numerical data; the second question would result in categorical data.
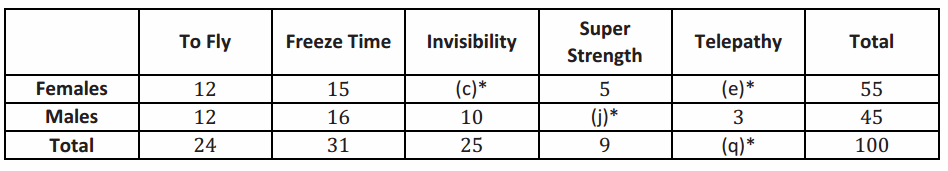
Another random sample of 100 surveys was selected. Jill had a copy of the frequency table that summarized these 100 surveys. Unfortunately, she spilled part of her lunch on the copy. The following summaries were still readable:
Answer:
Question 2.
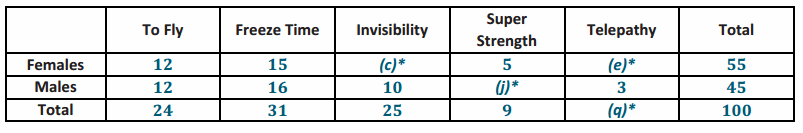
Help Jill recreate the table by determining the frequencies for cells (c), (e), (j), and (q).
Answer:
Cell (c) has 15 students, (e) has 8 students, (j) has 4 students, and (q) has 11 students.
Question 3.
Of the cells (c), (e), (j), and (q), which cells represent joint frequencies?
Answer:
The cells (c), (e), and (j) are joint frequencies.
Question 4.
Of the cells (c), (e), (j), and (q), which cells represent marginal frequencies?
Answer:
Cell (q) is a marginal frequency.