Engage NY Eureka Math Algebra 1 Module 3 Lesson 16 Answer Key
Eureka Math Algebra 1 Module 3 Lesson 16 Example Answer Key
Example 1.
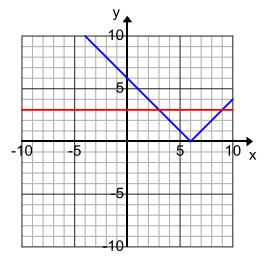
Solve this equation by graphing two functions on the same Cartesian plane: – |x – 3| + 4 = |0.5x| – 5.
Let f(x) = – |x – 3| + 4, and let g(x) = |0.5x| – 5, where x can be any real number.
We are looking for values of x at which the functions f and g have the same output value.
Therefore, we set y = f(x) and y = g(x) so we can plot the graphs on the same coordinate plane:
Answer:
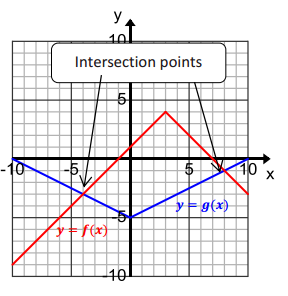
From the graph, we see that the two intersection points are _____________ and _____________.
Answer:
( – 4, – 3) and (8, – 1)
The fact that the graphs of the functions meet at these two points means that when x is ______, both f(x) and g(x) are _____, or when x is _______, both f(x) and g(x) are ______.
Answer:
– 4; – 3; 8; – 1
Thus, the expressions – |x – 3| + 4 and |0.5x| – 5 are equal when x = _______ or when x = ______.
Answer:
– 4; 8
Therefore, the solution set to the original equation is ___________.
Answer:
{ – 4, 8}
Example 2.
Solve this equation graphically: – |x – 3.5| + 4 = 0.25x – 1.
a. Write the two functions represented by each side of the equation.
Answer:
Let f(x) = – |x – 3.5| + 4, and let g(x) = 0.25x – 1, where x can be any real number.
b. Graph the functions in an appropriate viewing window.
Answer:
c. Determine the intersection points of the two functions.
Answer:
( – 2, – 1.5) and (6.8, 0.7)
d. Verify that the x – coordinates of the intersection points are solutions to the equation.
Answer:
Let x = – 2, then
– | – 2 – 3.5| + 4 = 0.25( – 2) – 1.
– 5.5 + 4 = – 0.5 – 1
– 1.5 = – 1.5
Let x = 6.8, then
– |6.8 – 3.5| + 4 = 0.25(6.8) – 1.
– 3.3 + 4 = 1.7 – 1
0.7 = 0.7
Eureka Math Algebra 1 Module 3 Lesson 16 Exercise Answer Key
Opening Exercises
Question 1.
Solve for x in the following equation: |x + 2| – 3 = 0.5x + 1.
Answer:
|x + 2| = 0.5x + 4
x + 2 = 0.5x + 4
0.5x = 2
x = 4
or
x + 2 = – (0.5x + 4)
1.5x = – 6
x = – 4
Question 2.
Now, let f(x) = |x + 2| – 3 and g(x) = 0.5x + 1. When does f(x) = g(x)?
a. Graph y = f(x) and y = g(x) on the same set of axes.
Answer:
b. When does f(x) = g(x)? What is the visual significance of the points where f(x) = g(x)?
Answer:
f(x) = g(x) when x = 4 and when x = – 4; (4, 3) and ( – 4, – 1). The points where f(x) = g(x) are the intersections of the graphs of f and g.
c. Is each intersection point (x, y) an element of the graph f and an element of the graph of g? In other words, do the functions f and g really have the same value when x = 4? What about when x = – 4?
Answer:
Yes. You can determine this by substituting x = – 4 and x = 4 into both f and g.
– 1 = | – 4 + 2| – 3
– 1 = 2 – 3
– 1 = – 1
– 1 = 0.5( – 4) + 1
– 1 = – 1
or
3 = |4 + 2| – 3
3 = 6 – 3
3 = 3
3 = 0.5(4) + 1
3 = 3
f(x) and g(x) have the same value at each x.
Exercises 1–5
Use graphs to find approximate values of the solution set for each equation. Use technology to support your work. Explain how each of your solutions relates to the graph. Check your solutions using the equation.
Exercise 1.
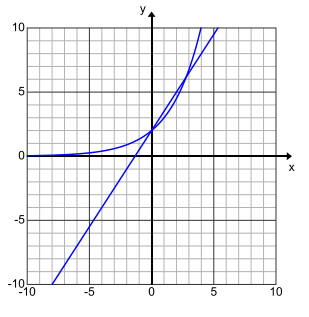
3 – 2x = |x – 5|
Answer:
x = – 2, the intersection point is ( – 2, 7).
Exercise 2.
2(1.5)x = 2 + 1.5x
Answer:
The first solution is x = 0, from the point (0, 2).
Second solution answers will vary; x is about 2.7 or 2.8, based on the actual intersection point of (2.776, 6.164).
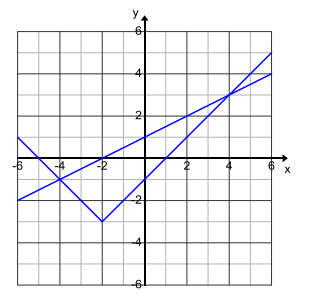
Exercise 3.
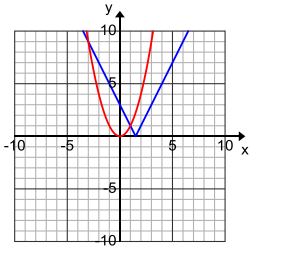
The graphs of the functions f and g are shown.
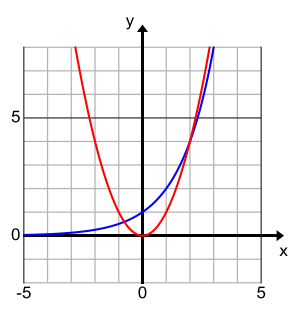
a. Use the graphs to approximate the solution(s) to the equation f(x) = g(x).
Answer:
Based on the graphs, the approximate solutions are { – 0.7, 2}.
b. Let f(x) = x2, and let g(x) = 2x. Find all solutions to the equation f(x) = g(x). Verify any exact solutions that you determine using the definitions of f and g. Explain how you arrived at your solutions.
Answer:
By guessing and checking, x = 4 is also a solution of the equation because f(4) = 16 and g(4) = 16. Since the graph of the exponential function is increasing and increases more rapidly than the squaring function, there will only be three solutions to this equation. The exact solutions are x = 2 and
x = 4, and an approximate solution is x = – 0.8.
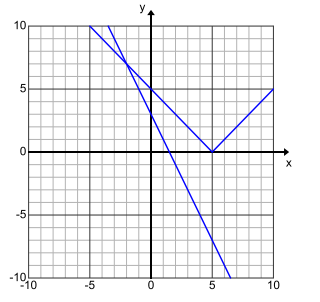
Exercise 4.
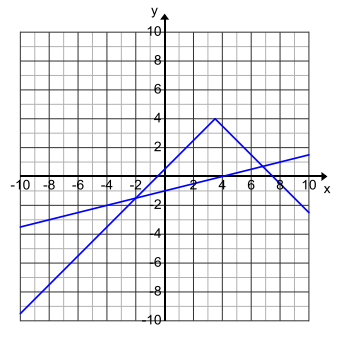
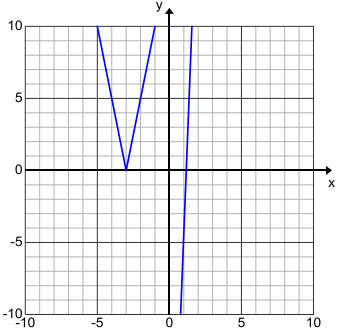
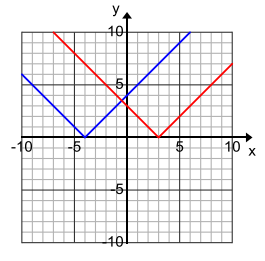
The graphs of f, a function that involves taking an absolute value, and g, a linear function, are shown to the right. Both functions are defined over all real values for x. Tami concluded that the equation f(x) = g(x) has no solution.
Do you agree or disagree? Explain your reasoning.
Answer:
I disagree with Tami because we cannot see enough of this graph. The graph of the function shown to the left has a slope of 5.
The graph of the function shown to the right has a slope greater than 5. Therefore, these two functions will intersect somewhere in the first quadrant. We would have to “zoom out” to see the intersection point.
Exercise 5.
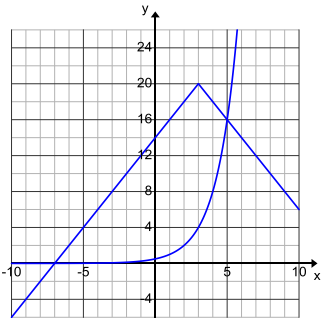
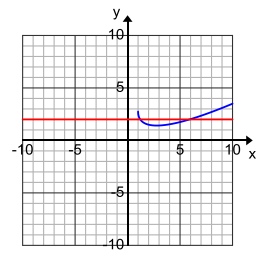
The graphs of f (a function that involves taking the absolute value) and g (an exponential function) are shown below. Sharon said the solution set to the equation f(x) = g(x) is exactly { – 7, 5}.
Do you agree or disagree with Sharon? Explain your reasoning.
Answer:
I disagree with Sharon. We could say that the solution set is approximately { – 7, 5}, but without having the actual equations or formulas for the two functions, we cannot be sure the x – values of the intersection points are exactly – 7 and 5.
Eureka Math Algebra 1 Module 3 Lesson 16 Problem Set Answer Key
Question 1.
Solve the following equations graphically. Verify the solution sets using the original equations.
a. |x| = x2
Answer:
{ – 1, 0, 1}
b. |3x – 4| = 5 – |x – 2|
Answer:
{0.25, 2.75}
Question 2.
Find the approximate solution(s) to each of the following equations graphically. Use technology to support your work. Verify the solution sets using the original equations.
a. 2x – 4 = \(\sqrt{x + 5}\)
Answer:
Approximately {3.5}
b. x + 2 = x3 – 2x – 4
Answer:
Approximately {2.4}
c. 0.5x3 – 4 = 3x + 1
Answer:
Approximately {3.0}
d. 6(\(\frac{1}{2}\))5x = 10 – 6x
Answer:
Approximately { – 0.2, 1.7}
In each problem, the graphs of the functions f and g are shown on the same Cartesian plane. Estimate the solution set to the equation f(x) = g(x). Assume that the graphs of the two functions intersect only at the points shown on the graph.
Question 3.
Answer:
{3, 9}
Question 4.
Answer:
{ – 3, 1}
Question 5.
Answer:
{ – \(\frac{1}{2}\)}
Question 6.
Answer:
{1.2, 6}
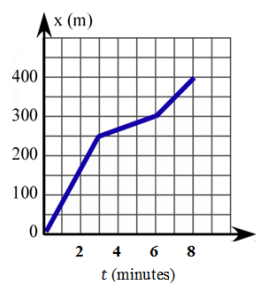
Question 7.
The graph shows Glenn’s distance from home as he rode his bicycle to school, which is just down his street.
His next – door neighbor Pablo, who lives 100 m closer to the school, leaves his house at the same time as Glenn.
He walks at a constant velocity, and they both arrive at school at the same time.
a. Graph a linear function that represents Pablo’s distance from Glenn’s home as a function of time.
Answer:
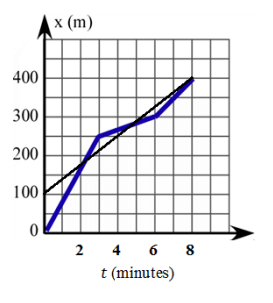
b. Estimate when the two boys pass each other.
Answer:
They cross paths at about 2 minutes and 5 minutes. I can tell that by finding the x – coordinates of the intersection points of the graphs of the functions.
c. Write piecewise linear functions to represent each boy’s distance, and use them to verify your answer to part (b).
Answer:
P(t) = 100 + \(\frac{75}{2}\) t
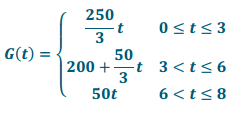
At about 2 minutes: 100 + \(\frac{75}{2}\) t = \(\frac{250}{3}\) t or 600 + 225t = 500t or 275t = 600 or t = \(\frac{24}{11}\) min.
At about 5 minutes: 100 + \(\frac{75}{2}\) t = 200 + \(\frac{50}{3}\) t or 225t = 600 + 100t or 125t = 600 or t = \(\frac{24}{5}\) = 4.8 min.
Eureka Math Algebra 1 Module 3 Lesson 16 Exit Ticket Answer Key
Question 1.
How do intersection points of the graphs of two functions f and g relate to the solution of an equation in the form f(x) = g(x)?
Answer:
The x – coordinates of the intersection points of the graphs of two functions are the solutions of the equation.
Question 2.
What are some benefits of solving equations graphically? What are some limitations?
Answer:
Benefits: Solving equations graphically can be helpful when you do not know how to solve equations algebraically. It can also save you some time if you have technology available. This method can only provide approximate solutions, which may be all you need. Or, the approximate solutions may give you insight into how to solve the equation algebraically.
Limitations: You cannot be sure you have found all the solutions to an equation unless you can reason about the graphs of the functions themselves and convince yourself that no other intersection points are possible.
The solutions found graphically rely on eyeballing. There is no guarantee that they are exact solutions; sometimes they are, but other times they are just decent approximations.