Engage NY Eureka Math Algebra 1 Module 3 Lesson 17 Answer Key
Eureka Math Algebra 1 Module 3 Lesson 17 Exploratory Challenge Answer Key
Exploratory Challenge 1
Let f(x) = |x|, g(x) = f(x) – 3, and h(x) = f(x) + 2 for any real number x.
a. Write an explicit formula for g(x) in terms of |x| (i.e., without using f(x) notation).
Answer:
g(x) = |x| – 3
b. Write an explicit formula for h(x) in terms of |x| (i.e., without using f(x) notation).
Answer:
h(x) = |x| + 2
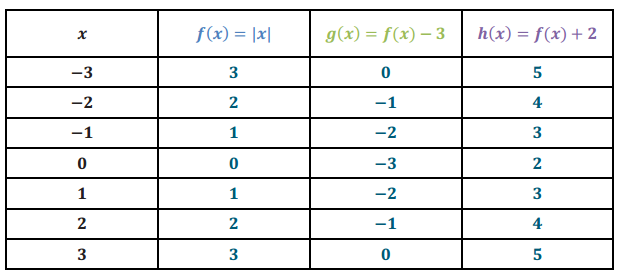
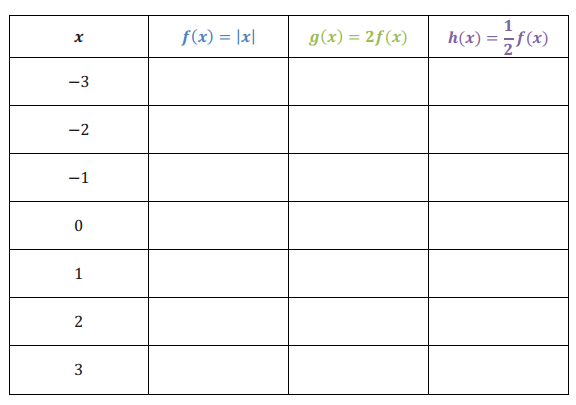
c. Complete the table of values for these functions.
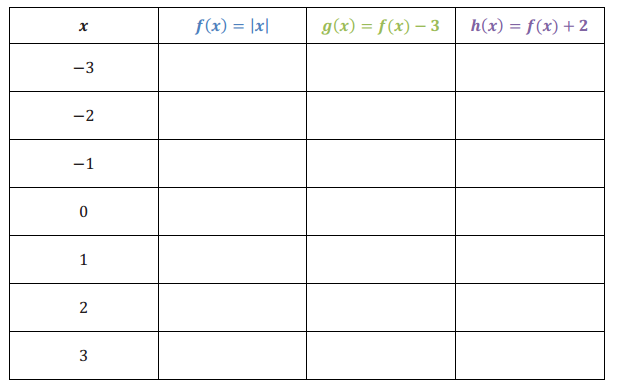
Answer:
d. Graph all three equations: y = f(x), y = f(x) – 3, and y = f(x) + 2.
Answer:
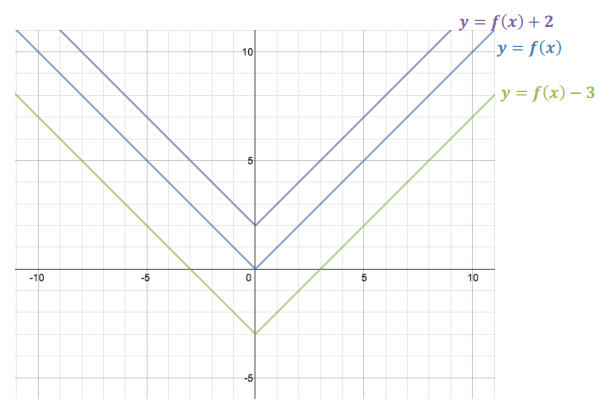
e. What is the relationship between the graph of y = f(x) and the graph of y = f(x) + k?
Answer:
For values of k where k>0, for every point (x, f(x)) that satisfies the equation y = f(x), there is a corresponding point (x, f(x) + k) on the graph, located k units above (x, f(x)), that satisfies the equation y = f(x) + k. The graph of y = f(x) + k is the vertical translation of the graph of y = f(x) by k units upward.
For values of k where k<0, for every point (x, f(x)) that satisfies the equation y = f(x), there is a corresponding point (x, f(x) + k) on the graph, located k units below (x, f(x)), that satisfies the equation y = f(x) + k. The graph of y = f(x) + k is the vertical translation of the graph of y = f(x) by k units downward.
f. How do the values of g and h relate to the values of f?
Answer:
For each x in the domain of f and g, the value of g(x) is 3 less than the value of f(x). For each x in the domain of f and h, the value of h(x) is 2 more than the value of f(x).
Exploratory Challenge 2
Let f(x) = |x|, g(x) = 2f(x), and h(x) = \(\frac{1}{2}\) f(x) for any real number x.
a. Write a formula for g(x) in terms of |x| (i.e., without using f(x) notation).
Answer:
g(x) = 2|x|
b. Write a formula for h(x) in terms of |x| (i.e., without using f(x) notation).
Answer:
h(x) = \(\frac{1}{2}\)|x|
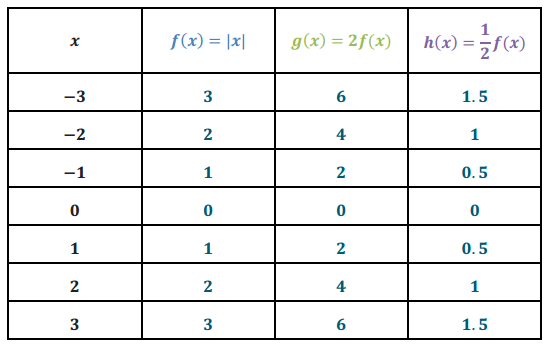
c. Complete the table of values for these functions.
Answer:
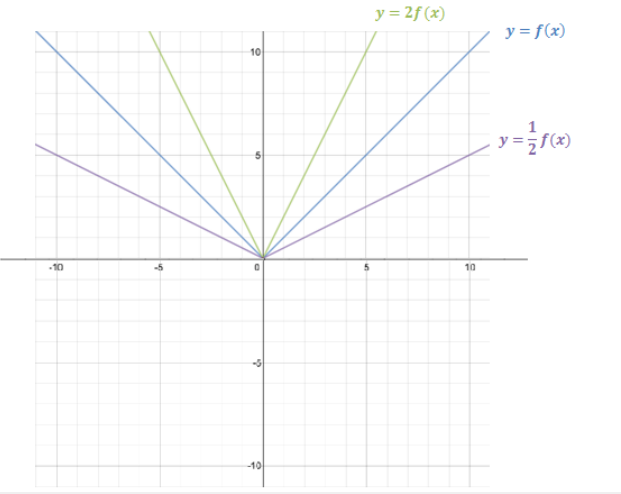
d. Graph all three equations: y = f(x), y = 2f(x), and y = \(\frac{1}{2}\) f(x).
Answer:
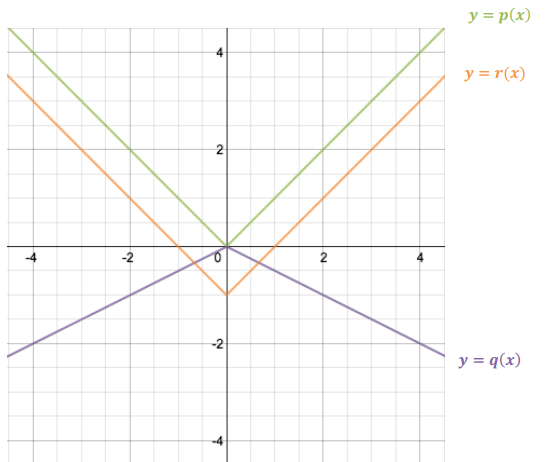
Given f(x) = |x|, let p(x) = – |x|, q(x) = – 2f(x), and r(x) = – \(\frac{1}{2}\) f(x) for any real number x.
e. Write the formula for q(x) in terms of |x| (i.e., without using f(x) notation).
Answer:
q(x) = – 2|x|
f. Write the formula for r(x) in terms of |x| (i.e., without using f(x) notation).
Answer:
r(x) = – \(\frac{1}{2}\) |x|
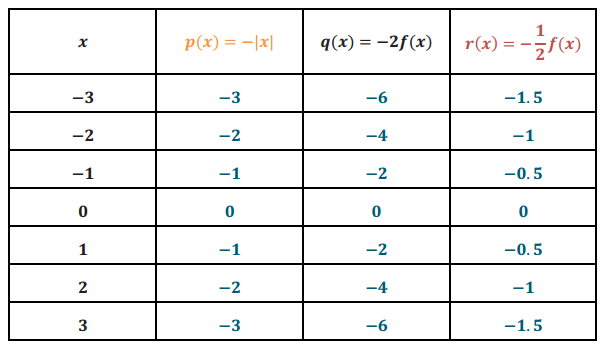
g. Complete the table of values for the functions p(x) = – |x|, q(x) = – 2f(x), and r(x) = – \(\frac{1}{2}\) f(x).
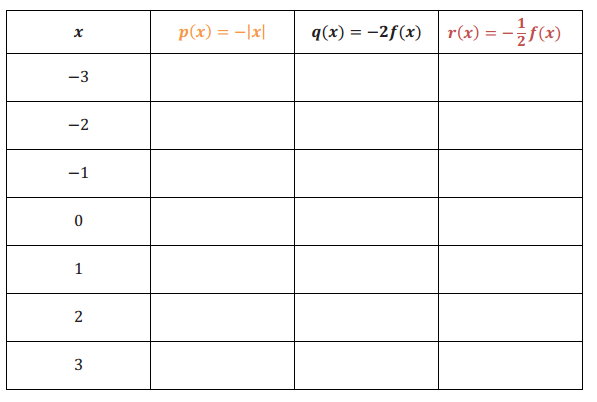
Answer:
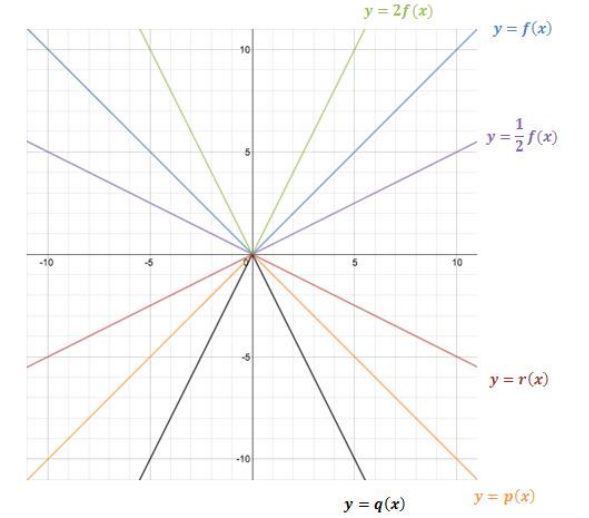
h. Graph all three functions on the same graph that was created in part (d). Label the graphs as y = p(x), y = q(x), and y = r(x).
Answer:
i. How is the graph of y = f(x) related to the graph of y = kf(x) when k > 1?
Answer:
The graph of y = kf(x) for k > 1 contains points (x, ky), which are related to points (x, y) in the graph of y = f(x). The number ky is a multiple of y: Each y – value of y = g(x) is k times the y – value of y = f(x). The graph of y = kf(x) is a vertical scaling that appears to stretch the graph of y = f(x) vertically by a factor of k.
j. How is the graph of y = f(x) related to the graph of y = kf(x) when 0 < k < 1?
Answer:
The graph of y = kf(x) for 0<k<1 contains points (x, ky), which are related to points (x, y) in the graph of y = f(x). The number ky is a fraction of y: Each y – value of y = g(x) is k times the y – value of y = f(x). The graph of y = kf(x) is a vertical scaling that appears to shrink the graph of y = f(x) vertically by a factor of k.
k. How do the values of functions p, q, and r relate to the values of functions f, g, and h, respectively?
What transformation of the graphs of f, g, and h represents this relationship?
Answer:
Each function is the opposite of the corresponding function. The result is that each y – value of any point on the graph of y = p(x), y = q(x), and y = r(x) are the opposite of the y – value of the graphs of the equations
y = f(x), y = g(x), and y = h(x). Each graph is a reflection of the corresponding graph over the x – axis.
Eureka Math Algebra 1 Module 3 Lesson 17 Exercise Answer Key
Exercise
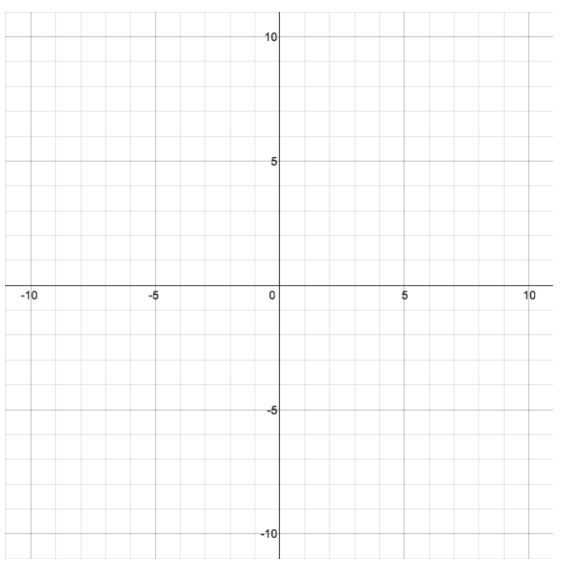
Make up your own function f by drawing the graph of it on the Cartesian plane below. Label it as the graph of the equation y = f(x). If b(x) = f(x) – 4 and c(x) = 1/4 f(x) for every real number x, graph the equations y = b(x) and y = c(x) on the same Cartesian plane.
Answer:
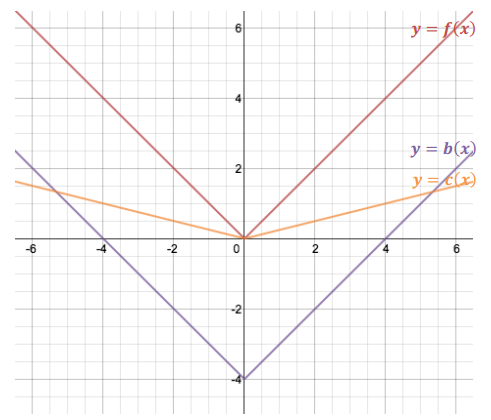
Answers will vary. Look for and encourage students to create interesting graphs for their function f. (Functions DO NOT have to be defined by algebraic expressions—any graph that satisfies the definition of a function will do.) One such option is using f(x) = |x| as shown in the example below.
Eureka Math Algebra 1 Module 3 Lesson 17 Problem Set Answer Key
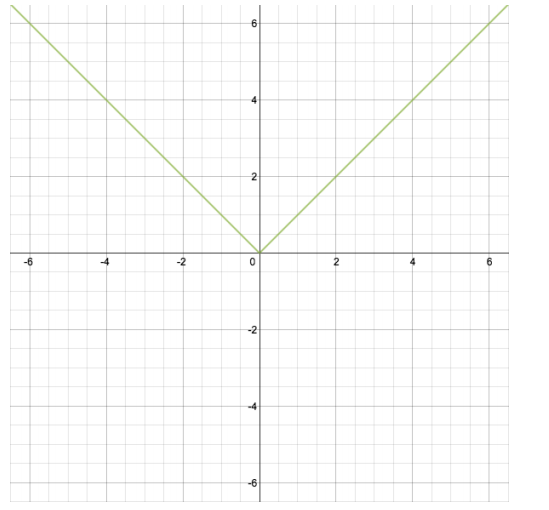
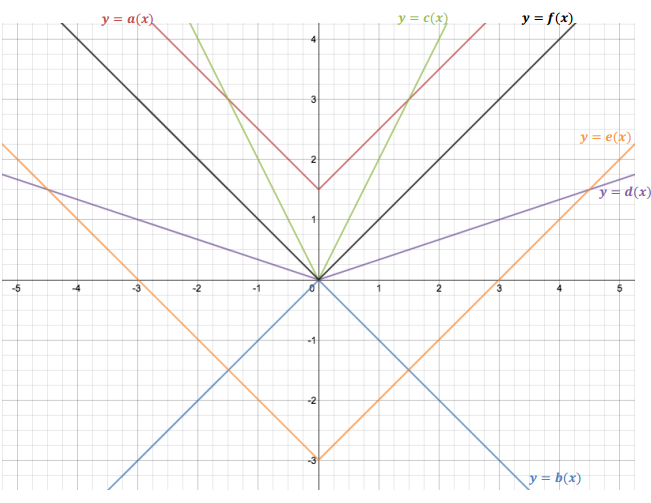
Let f(x) = |x| for every real number x. The graph of y = f(x) is shown below. Describe how the graph for each function below is a transformation of the graph of y = f(x). Then, use this same set of axes to graph each function for Problems 1–5. Be sure to label each function on your graph (by y = a(x), y = b(x), etc.).
Question 1.
a(x) = |x| + \(\frac{3}{2}\)
Answer:
Translate the graph of y = f(x) up 1.5 units.
Question 2.
b(x) = – |x|
Answer:
Reflect y = f(x) across the x – axis.
Question 3.
c(x) = 2|x|
Answer:
Vertically scale/stretch the graph of y = f(x) by doubling the output values for every input.
Question 4.
d(x) = \(\frac{1}{3}\)|x|
Answer:
Vertically scale/shrink the graph of y = f(x) by dividing the output values by 3 for every input.
Question 5.
e(x) = |x| – 3
Answer:
Translate the graph of y = f(x) down 3 units.
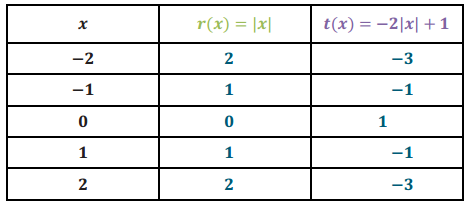
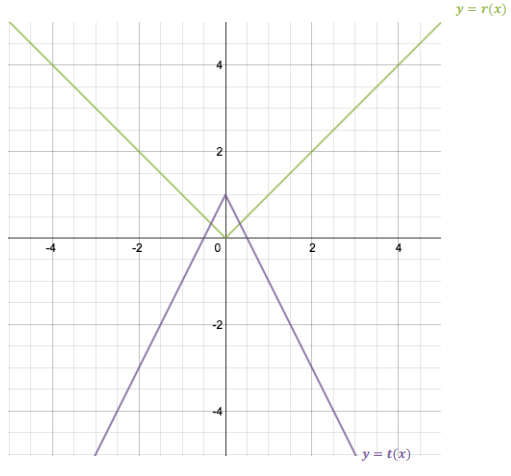
Question 6.
Let r(x) = |x| and t(x) = – 2|x| + 1 for every real number x. The graph of y = r(x) is shown below. Complete the table below to generate output values for the function t, and then graph the equation y = t(x) on the same set of axes as the graph of y = r(x).
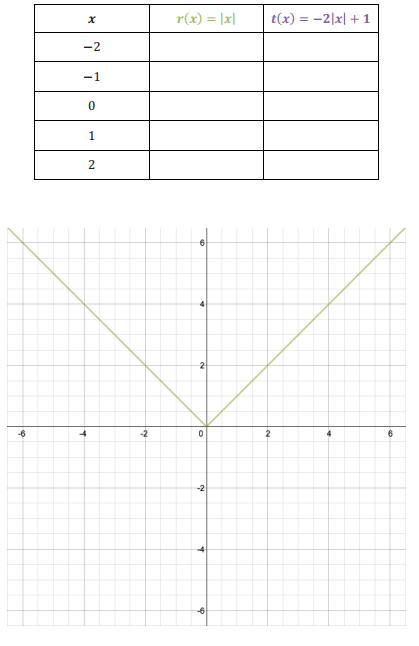
Answer:
Question 7.
Let f(x) = |x| for every real number x. Let m and n be functions found by transforming the graph of y = f(x). Use the graphs of y = f(x), y = m(x), and y = n(x) below to write the functions m and n in terms of the function f. (Hint: What is the k?)
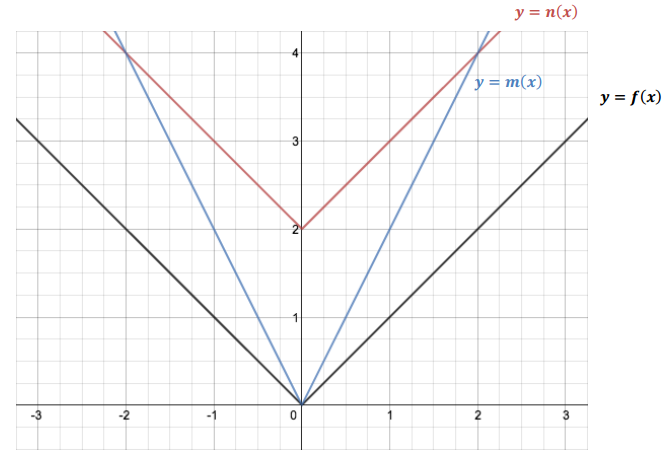
Answer:
m(x) = 2f(x)
n(x) = f(x) + 2
Eureka Math Algebra 1 Module 3 Lesson 17 Exit Ticket Answer Key
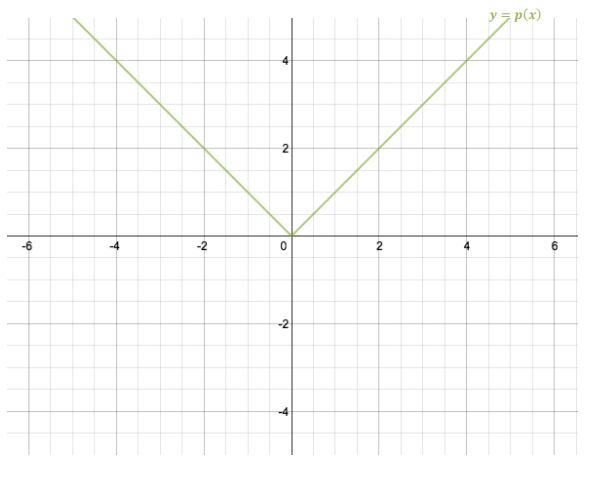
Let p(x) = |x| for every real number x. The graph of y = p(x) is shown below.
Question 1.
Let q(x) = – \(\frac{1}{2}\) |x| for every real number x. Describe how to obtain the graph of y = q(x) from the graph of y = p(x). Sketch the graph of y = q(x) on the same set of axes as the graph of y = p(x).
Answer:
Reflect and vertically scale the graph of y = p(x) by plotting (x, – \(\frac{1}{2}\) y) for each point (x, y) in the graph of y = p(x). See the graph of y = q(x) below.
Question 2.
Let r(x) = |x| – 1 for every real number x. Describe how to obtain the graph of y = r(x) from the graph of y = p(x). Sketch the graph of y = r(x) on the same set of axes as the graphs of y = p(x) and y = q(x).
Answer:
Translate the graph of y = p(x) vertically down 1 unit. See the graph of y = r(x) below.