Engage NY Eureka Math Algebra 2 Module 3 Lesson 17 Answer Key
Eureka Math Algebra 2 Module 3 Lesson 17 Opening Exercise Answer Key
Opening Exercise:
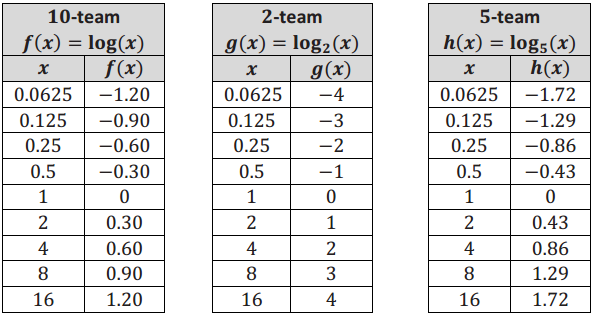
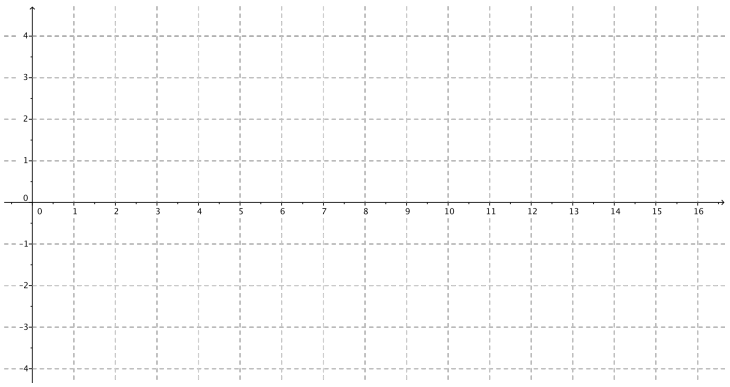
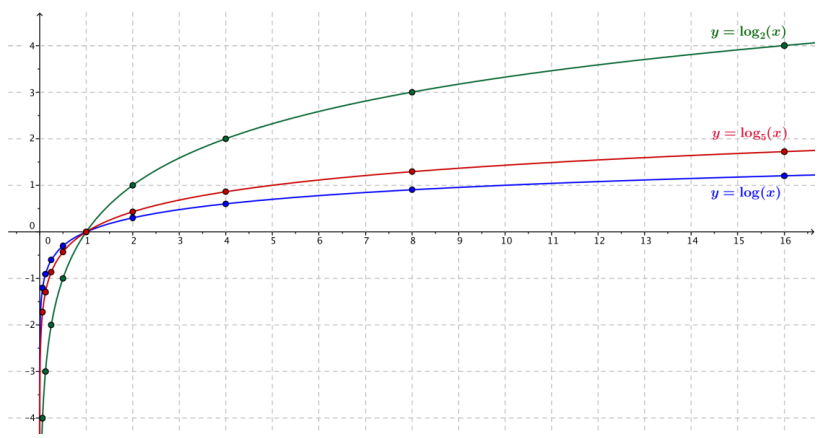
Graph the points in the table for your assigned function f(x) = log(x), g(x) = log2(x), or h(x) = log5(x) for 0 < x ≤ 16. Then, sketch a smooth curve through those points and answer the questions that follow.
Ans:
a. What does the graph indicate about the domain of your function?
Ans:
The domain of each of these functions is the positive real numbers, which can be stated as (0, ∞).
b. Describe the x-intercepts of the graph.
Ans:
There is one x-intercept at 1.
c. Describe the y-intercepts of the graph.
Ans:
There are no y-intercepts of this graph.
d. Find the coordinates of the point on the graph with y-value 1.
Ans:
For the 10-team, this is (10, 1). For the 2-team, this is (2, 1). For the 5-team, this is (5, 1).
e. Describe the behavior of the function as x → 0.
Ans:
As x → 0, the function values approach negative infinity; that is, f(x) → -∞. The same is true for the functions g and h.
f. Describe the end behavior of the function as x → ∞.
Ans:
As x → ∞, the function values slowly increase. That is, f(x) → ∞. The same is true for the functions g and h.
g. Describe the range of your function.
Ans:
The range of each of these functions is all real numbers, (-∞, ∞).
h. Does this function have any relative maxima or minima? Explain how you know.
Ans:
Since the function values continue to increase, and there are no peaks or valleys in the graph, the function has no relative maxima or minima.
Eureka Math Algebra 2 Module 3 Lesson 17 Exercise Answer Key
Exercises:
Exercise 1.
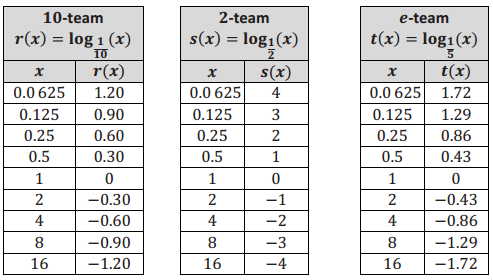
Graph the points in the table for your assigned function r(x) = log\(\frac{1}{10}\)(x), s(x) = log\(\frac{1}{2}\)(x), or t(x) = log\(\frac{1}{2}\)(x) for 0 < x ≤ 16. Then sketch a smooth curve through those points, and answer the questions that follow.
Ans:
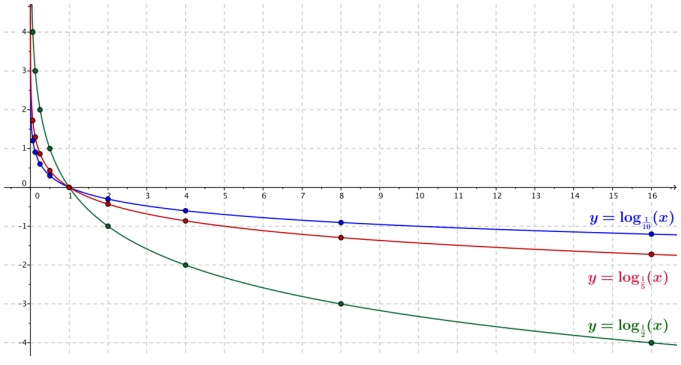
a. What is the relationship between your graph in the Opening Exercise and your graph from this exercise?
Ans:
The second graph is the reflection of the graph in the Opening Exercise across the x-axis.
b. Why does this happen? Use the change of base formula to justify what you have observed in part (a).
Ans:
Using the change of base formula, we have log\(\frac{1}{2}\)(x) = \(\frac{\log _{2}(x)}{\log _{2}\left(\frac{1}{2}\right)}\) Since log2\(\frac{1}{2}\) = -1, we have log\(\frac{1}{2}\)(x) = \(=\frac{\log _{2}(x)}{-1}\) , so log\(\frac{1}{2}\)(x) = -log2(x).
Thus, the graph of y = log\(\frac{1}{2}\)(x) is the reflection of the graph of y = log2(x) across the x-axis.
Exercise 2.
In general, what is the relationship between the graph of a function y = f(x) and the graph of y = f(kx) for a constant k?
Ans:
The graph of y = f(kx) is a horizontal scaling of the graph of y = f(x).
Exercise 3.
Graph the points in the table for your assigned function u(x) = log(10x), v(x) = log2(2x), or w(x) = log5(5x) for 0 < x ≤ 16. Then sketch a smooth curve through those points, and answer the questions that follow.
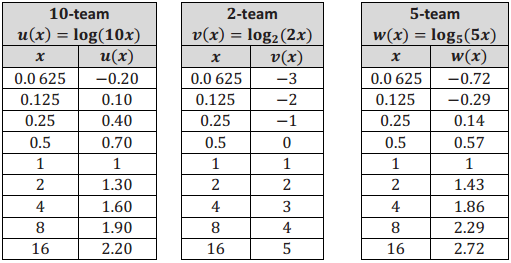
a. Describe a transformation that takes the graph of your team’s function in this exercise to the graph of your team’s function in the Opening Exercise.
Ans:
The graph produced in this exercise is a vertical translation of the graph from the Opening Exercise by one unit upward.
b. Do your answers to Exercise 2 and part (a) agree? If not, use properties of logarithms to justify your observations in part (a).
Ans:
The answers to Exercise 2 and part (a) do not appear to agree. However, because logb(bx) = logb(b) + log(x) = 1 + logb(x), the graph of y = logb(bx) and the graph of
y = 1 + logb(x) coincide.
Eureka Math Algebra 2 Module 3 Lesson 17 Problem Set Answer Key
Question 1.
The function Q(x) = log(x) has function values in the table at right.
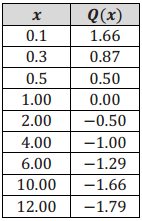
a. Use the values in the table to sketch the graph of y = Q(x).
Answer:
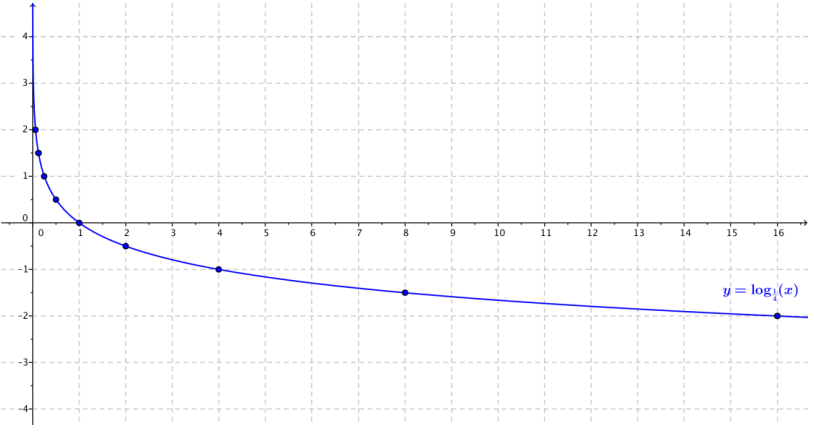
b. What is the value of b in Q(x) = logb(x)? Explain how you know.
Answer:
Because the point (4, -1) is on the graph of y = Q(x), we know logb(4) = -1, so b-1 = 4. It follows that b = \(\frac{1}{4}\).
c. Identify the key features in the graph of y = Q(x).
Answer:
Because 0 < b < 1, the function values approach œ as x → 0, and the function values approach -∞ as x → ∞. There is no y-intercept, and the x-intercept is 1. The domain of the function is (0, ∞), the range is (-∞, ∞), and the graph passes through (b, 1).
Question 2.
Consider the logarithmic functions f(x) = logb(x), g(x) = log5(x), where b is a positive real number, and b ≠ 1. The graph of f is given at right.
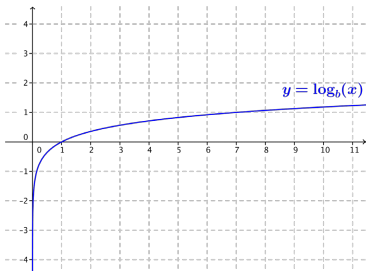
a. Is b > 5, or Is b < 5? Explain how you know.
Answer: Since f(7) = 1,and g(7) ≈ 1.21,the graph of f lies below the graph of g for x ≥ 1. This means that b is larger than 5, so we have b > 5. (Note: The actual value of b is 7.)
b. Compare the domain and range of functions f and g.
Answer:
Functions f and g have the same domain, (0, ∞), and the same range, (-∞, ∞).
c. Compare the x-intercepts and y-intercepts of f and g.
Answer:
Both f and g have an x-intercept at 1 and no y-intercepts.
d. Compare the end behavior of f and g.
Answer:
As x → ∞, both f(x) → ∞ andg(x) → ∞.
Question 3.
Consider the logarithmic functions f(x) = logb(x) and g(x) = log\(\frac{1}{2}\)(x), where b is a positive real number and b ≠ 1. A table of approximate values of f is given below.
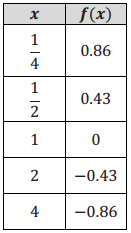
a. Is b > \(\frac{1}{2}\), or is b < \(\frac{1}{2}\)? Explain how you know.
Answer:
Since g(2) = -1, and f(2) ≈ -0.43, the graph off lies above the graph of g for x ≥ 1. This means that b is closer to 0 than \(\frac{1}{2}\) is, so we have b < \(\frac{1}{2}\). (Note: The actual value of b is \(\frac{1}{5}\).)
b. Compare the domain and range of functions f and g.
Answer:
Functions f and g have the same domain, (0, ∞), and the same range, (-∞, ∞).
c. Compare the x-intercepts and y-intercepts of f and g.
Answer:
Both f and g have an x-intercept at 1 and no y-intercepts.
d. Compare the end behavior of f and g.
Answer:
As x → ∞, both f(x) → -∞ and g(x) → -∞.
Question 4.
On the same set of axes, sketch the functions f(x) = log2(x) and g(x) = log2(x3).
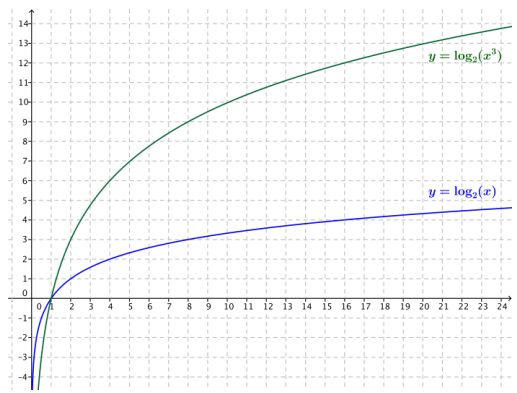
a. Describe a transformation that takes the graph of f to the graph of g.
Answer:
The graph of g is a vertical scaling of the graph of f by a factor of 3.
b. Use properties of logarithms to justify your observations in part (a).
Answer:
Using properties of logarithms, we know that g(x) = log2(x3) = 3 log2(x) = 3 f(x). Thus, the graph off is a vertical scaling of the graph of g by a factor of 3.
Question 5.
On the same set of axes, sketch the functions f(x) = log2(x) and g(x) = log2(\(\frac{x}{4}\)).
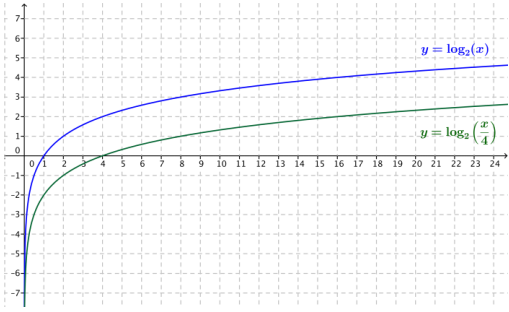
a. Describe a transformation that takes the graph of f to the graph of g.
Answer:
The graph of g is the graph off translated down by 2 units.
b. Use properties of logarithms to justify your observations in part (a).
Answer:
Using properties of logarithms, g(x) = log2(\(\frac{x}{4}\)) = log2(x) – log2(4) = f(x) – 2. Thus, the graph of g is a translation of the graph of f down 2 units.
Question 6.
On the same set of axes, sketch the functions f(x) = log\(\frac{1}{2}\)(x) and g(x) = log2(\(\frac{1}{x}\)).
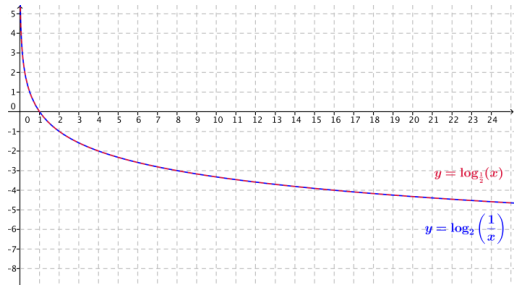
a. Describe a transformation that takes the graph of f to the graph of g.
Answer:
These two graphs coincide, so the identity transformation takes the graph of f to the graph of g.
b. Use properties of logarithms to justify your observations in part (a).
Answer:
If log\(\frac{1}{2}\)(x) = y, then (\(\frac{1}{2}\))y = x, so \(\frac{1}{x}\) = 2y. Then, y = log2, so log2(\(\frac{1}{x}\)) = log\(\frac{1}{x}\)(x); thus, g(x) = f(x) for all x > 0.
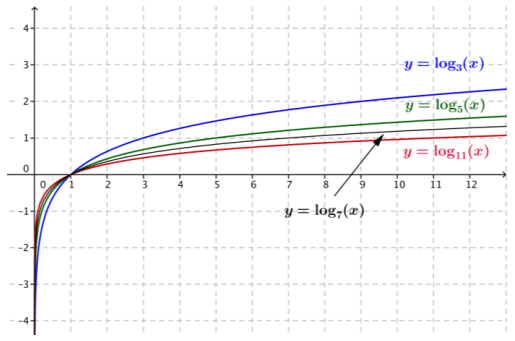
Question 7.
The figure below shows graphs of the functions f(x) = log3(x), g(x) = log5(x), and h(x) = log11(x).
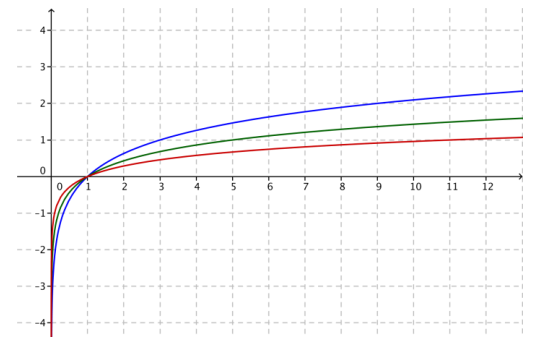
a. Identify which graph corresponds to which function. Explain how you know.
Answer:
The top graph (in blue) is the graph of f(x) = log3(x), the middle graph (in green) is the graph of g(x) = log5(x), and the lower graph (in red) is the graph of h(x) = log11(x). We know this because the blue graph passes through the point (3, 1), the green graph passes through the point (5, 1), and the red graph passes through the point (11, 1).
We also know that the higher the value of the base b, the flatter the graph, so the graph of the function with the largest base, 11, must be the red graph on the bottom, and the graph of the function with the smallest base, 3, must be the blue graph on the top.
b. Sketch the graph of k(x) = log7(x) on the same axes.
Answer:
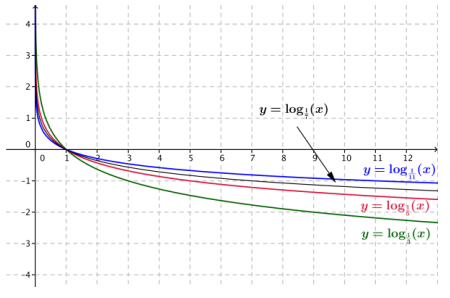
Question 8.
The figure below shows graphs of the functions f(x) = log\(\frac{1}{3}\)(x), g(x) = log\(\frac{1}{5}\)(x), and h(x) = log\(\frac{1}{11}\)(x).
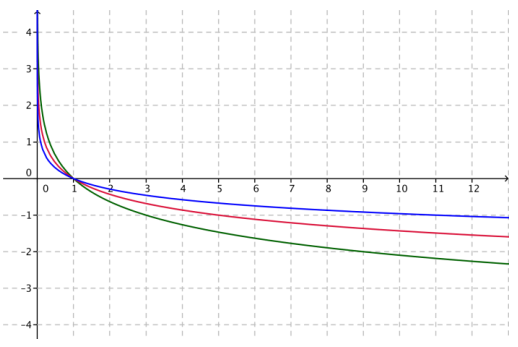
a. Identify which graph corresponds to which function. Explain how you know.
Answer:
The top graph (in blue) is the graph of h(x) = log\(\frac{1}{11}\)(x), the middle graph (in red) is the graph of g(x) = log\(\frac{1}{5}\)(x), and the lower graph is the graph of f(x) = log\(\frac{1}{3}\)(x). We know this because the blue graph passes through the point (11, -1), the red graph passes through the point (5, -1), and the green graph passes through the point (3, -1).
b. Sketch the graph of k(x) = log\(\frac{1}{7}\)(x) on the same axes.
Answer:
Question 9.
For each function f, find a formula for the function h in terms of x. Part (a) has been done for you.
a. If f(x) = x2 +x, find h(x) = f(x+ 1).
Answer:
h(x)= f(x+ 1)
= (x+1)2 + (x + 1)
= x2 + 3x + 2
b. If f(x) = \(\sqrt{x^{2}+\frac{1}{4}}\), find h(x) = f(\(\frac{1}{7}\)x).
Answer:
h(x) = \(\frac{1}{2}\)\(\sqrt{x^{2}+\frac{1}{4}}\)
c. If f(x) = log(x), find h(x) = f(\(\sqrt[3]{10 x}\)) when x > 0.
Answer:
h(x) = \(\frac{1}{3}\) + \(\frac{1}{3}\)log(x)
d. If f(x) = 3x, find h(x) = f(log3(x2 + 3)).
Answer:
h(x) = x2 + 3
e. If f(x) = x3, find h(x) = f(\(\frac{1}{x^{3}}\)) when x ≠ 0.
Answer:
h(x) = (\(\frac{1}{x^{6}}\))
f. If f(x) = x3, find h(x) = f(\(\sqrt[3]{x}\)).
Answer:
h(x) = x
g. If f(x) = sin(x), find h(x) = f(x + \(\frac{\pi}{2}\))
Answer:
h(x) = sin (x + \(\frac{\pi}{2}\))
h. If f(x) = x2 + 2x + 2, find h(x) = f(cos(x))
Answer:
h(x) = (cos(x))2 + 2 cos(x) + 2
Question 10.
For each of the functions f and g below, write an expression for (i) f(g(x)). (ii) g(f(x)), and (iii) f(f(x)) in terms of x. Part (a) has been done for you.
a. f(x) = x2, g(x) = x+ 1
i. f(g(x)) = f(x + 1)
=(x + 1)2
ii. g(f(x)) = g(x2)
=2 + 1
iii. f(f(x)) = f(x2)
= (x2)2
= x4
b. f(x) = \(\frac{1}{2}\)x – 8, g(x) = 4x + 1
Answer:
i. f(g(x)) = x – \(\frac{31}{4}\)
ii. g(f(x))= x – 31
iii. f(f(x)) = \(\frac{1}{16}\)x – 10
c. f(x) = \(\sqrt[3]{x+1}\), g(x) = x – 1
Answer:
i. f(g(x)) = x
ii. g(f(x))= x
iii. f(f(x)) = \(\sqrt[3]{\sqrt[3]{x+1}+1}\)
d. f(x) = x3, g(x) = \(\frac{1}{x}\)
Answer:
i. f(g(x)) = \(\frac{1}{x^{3}}\)
ii. g(f(x)) = \(\frac{1}{x^{3}}\)
iii. f(f(x)) = x9.
e. f(x)= |x|, g(x)= x2
Answer:
i. f(g(x)) = |x2| = x2
ii. g(f(x))= (|x|)2 = 2
iii. f(f(x)) = |x|
Extension:
Question 11.
Consider the functions f(x) = log2(x) and (x) = \(\sqrt{x-1}\).
a. Use a calculator or other graphing utility to produce graphs of f(x) = log2(x) and g(x) = \(\sqrt{x-1}\) for x ≤ 17.
Answer:
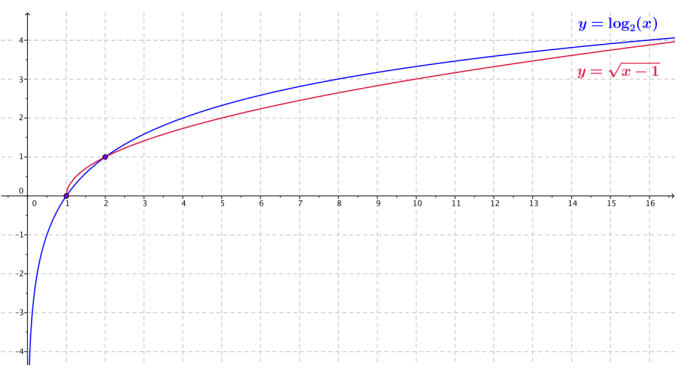
b. Compare the graph of the function f(x) = log2(x) with the graph of the function g(x) = \(\sqrt{x-1}\). Describe the similarities and differences between the graphs.
Answer:
They are not the same, but they have a similar shape when x ≥ 1. Both graphs pass through the points (1, 0) and (2, 1). Both functions appear to approach infinity slowly as x → ∞.
The graph of f(x) = log2(x) lies below the graph of g(x) = \(\sqrt{x-1}\) on the interval (1,2), and the graph of f appears to lie above the graph of g on the interval (2, ∞). The logarithm function f is defined for x > 0, and the radical function g is defined for x ≥ 1. Both functions appear to slowly approach infinity as x → ∞.
c. Is it always the case that log2((x) > \(\sqrt{x-1}\) for x > 2?
Answer:
No, for 2 < x ≤ 19, log2(x) > \(\sqrt{x-1}\). Between 19 and 20, the graphs cross again, and we have \(\sqrt{x-1}\) > log2(x)for x ≥ 20
Question 12.
Consider the functions f(x) = log2(x) and (x) = \(\sqrt[3]{x-1}\).
a. Use a calculator or other graphing utility to produce graphs of f(x) = log2(x) and h(x) = \(\sqrt[3]{x-1}\) for x ≤ 28.
Answer:
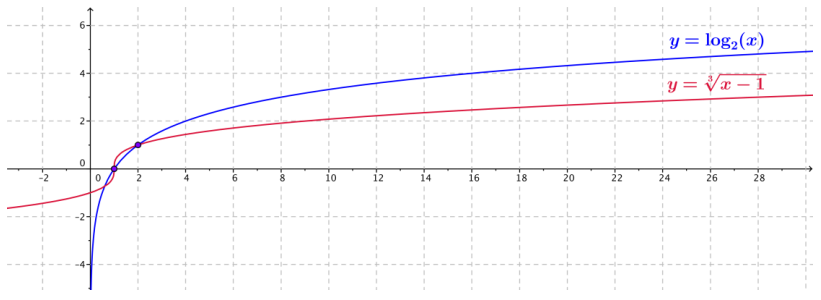
b. Compare the graph of the function f(x) = log2(x) with the graph of the function h(x) = \(\sqrt[3]{x-1}\). Describe the similarities and differences between the graphs.
Answer:
They are not the same, but they have a similar shape when x ≥ 1. Both graphs pass through the points (1,0) and (2, 1). Both functions appear to approach infinity slowly as x → ∞.
The graph of f(x) = log2(x) lies below the graph of h(x) = \(\sqrt[3]{x-1}\) on the interval (1, 2), and the graph of f appears to lie above the graph of h on the interval (2, ∞). The logarithm function f is defined for x > 0, and the radical function h is defined for all real numbers x. Both functions appear to approach infinity slowly as x → ∞.
c. Is it always the case that log2((x) > \(\sqrt[3]{x-1}\) for x > 2?
Answer:
No, if we extend the viewing window on the calculator, we see that the graphs cross again between 983 and 984. Thus, log2(x) > \(\sqrt[3]{x-1}\) for 2 < x ≤ 983, and log2(x) < \(\sqrt[3]{x-1}\) for x ≥ 984.
Eureka Math Algebra 2 Module 3 Lesson 17 Exit Ticket Answer Key
Question 1.
Graph the function f(x) = log3(x) without using a calculator, and identify its key features.
Answer:
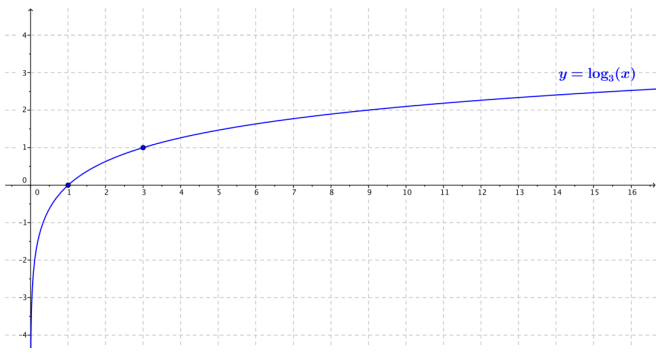
Key features:
The domain is (0, ∞).
The range is all real numbers.
End behavior:
As x → 0, f(x) → -∞.
As x → ∞, f(x) → ∞.
Intercepts:
x-intercept: There is one x-intercept at 1.
y-intercept: The graph does not cross the y-axis.
The graph passes through (3, 1).