Engage NY Eureka Math Algebra 2 Module 3 Lesson 22 Answer Key
Eureka Math Algebra 2 Module 3 Lesson 22 Opening Exercise Answer Key
Opening Exercise:
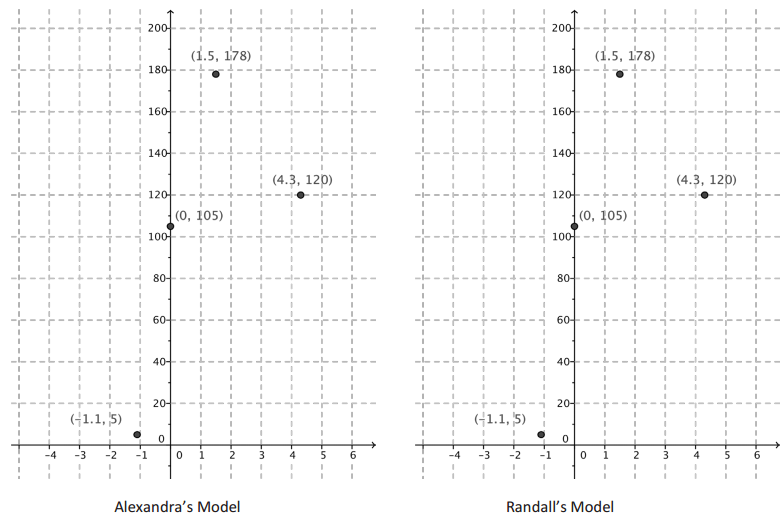
a. You are working on a team analyzing the following data gathered by your colleagues:
(-1.1, 5), (0, 105), (1.5, 178), (4.3, 120).
Your coworker Alexandra says that the model you should use to fit the data is k(t) = 100. sin(1.5t) + 105. Sketch Alexandra’s model on the axes at left on the next page.
Answer:
b. How does the graph of Alexandra’s model k(t) = 100 sin(1.5t) + 105 relate to the four points? Is her model a good fit for this data?
Answer:
The curve passes through or close to all four of those points, so this model fits the data well.
c. Another teammate Randall says that the model you should use to fit the data is g(t) = -16t2 + 72t + 105. Sketch Randall’s model on the axes at right on the next page.
Answer:
d. How does the graph of Randall’s model g(t) = -16t2 + 72t + 105 relate to the four points? Is his model a good fit to the data?
Answer:
The curve passes through or close to all four of those points, so this model also fits the data well.
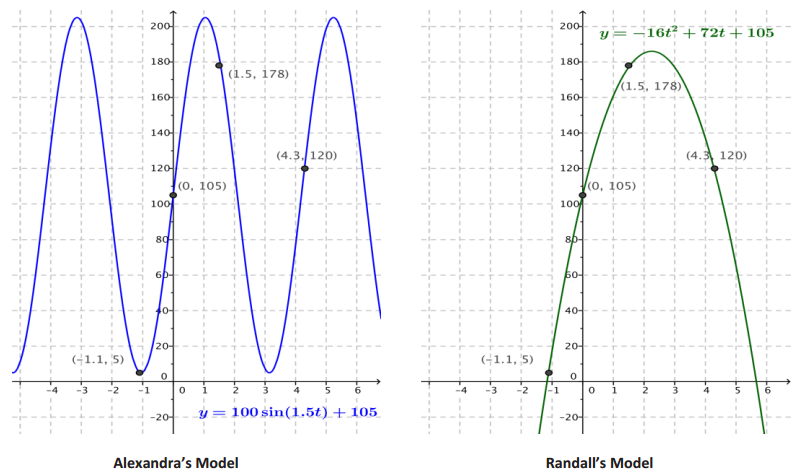
e. Suppose the four points represent positions of a projectile fired into the air. Which of the two models Is more appropriate in that situation, and why?
Answer:
The quadratic curve of Randall’s model makes more sense in this context. Some students may know that the acceleration of the projectile due to gravity warrants a quadratic term in the equation for the function, and all students should understand that the motion of the projectile is not cyclic—once it hits the ground, it stays there.
f. In general, how do we know which model to choose?
Answer:
It entirely depends on the context and what we know about what the data represent.
Eureka Math Algebra 2 Module 3 Lesson 22 Exercise Answer Key
Exercises:
Exercise 1.
The table below contains the number of daylight hours in Oslo, Norway, on the specified dates.
| Date | Hours and Minutes | Hours |
| August 1 | 16:56 | 16.93 |
| September 1 | 14:15 | 14.25 |
| October 1 | 11:33 | 11.55 |
| November 1 | 8:50 | 8.83 |
a. Plot the data on the grid provided and decide how to best represent it.
Answer:
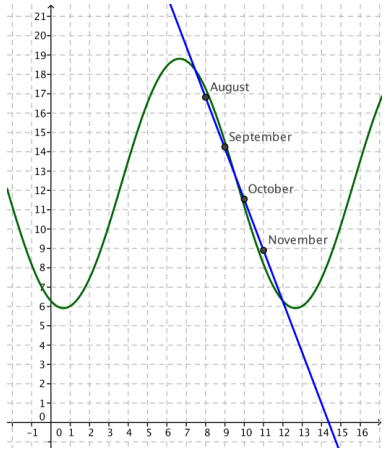
b. Looking at the data. what type of function appears to be the best fit?
Answer:
The data appears to lie on a straight line.
c. Looking at the context in which the data was gathered, what type of function should be used to model the data?
Answer:
Since daylight hours increase and decrease with the season, being shortest in winter and longest in summer and repeating every 12 months a linear model is not appropriate. We should model this data with a periodic table.
d. Do you have enough information to find a model that is appropriate for this data? Either find a model or explain what other information you would need to do so.
Answer:
We cannot find a complete model for this scenario because we do not know the maximum and a minimum number of daylight hours in Oslo. We do know that the maximum is less than 24 hours and the minimum is more than 0 hours. We could find a very rough model using a sinusoidal function, but we do not know the necessary amplitude. (The maximum number of daylight hours in Oslo is 18.83 hours and occurs in mid-June. With this information, the points can be modeled by the function
d(t) = -6.45 cos (\(\frac{\pi}{6}\)(t – 0.65)) + 12.36, as shown in green.)
Exercise 2.
The goal of the U.S. Centers for Disease Control and Prevention (CDC) is to protect public health and safety through the control and prevention of disease, injury, and disability. Suppose that 45 people have been diagnosed with a new strain of the flu virus and that scientists estimate that each person with the virus will infect 5 people every day with the flu.
a. What type of function should the scientists at the CDC use to model the initial spread of this strain of flu to try to prevent an epidemic? Explain how you know.
Answer:
Because each person infects 5 people every day, the number of infected people is multiplied by a factor of 5 each day. This would be best modeled by an exponential function, at least at the beginning of the outbreak.
b. Do you have enough information to find a model that is appropriate for this situation? Either find a model or explain what other information you would need to do so.
Answer:
Yes. We know the initial number of infected people is 45, and we know that the number of infected people is multiplied by 5 each day. A model for the number of infected people on day t would be F(t) = 45(5t).
Exercise 3.
An artist is designing posters for a new advertising campaign. The first poster takes 10 hours to design, but each subsequent poster takes roughly 15 minutes less time than the previous one as he gets more practice.
a. What type of function models the amount of time needed to create n posters, for n ≤ 20? Explain how you know.
Answer:
Since the time difference between posters is decreasing linearly, we should model this scenario using a quadratic function.
b. Do you have enough information to find a model that is appropriate for this situation? Either find a model or explain what other information you would need to do so.
Answer:
Yes. The number of hours needed to create n posters can be modeled by a quadratic function
T(n) = an2 + bn + c,
where we know that T(0) = 0, T(1) = 10, and T(2) = 19.75. This gives us the three linear equations
c = 0
a + b + c = 10
4a + 2b + c = 19.75.
We can solve this system of three equations using the methods of Lesson 30 in Module 1, and we find
T(n) = -0.125n2 + 10.125n.
Exercise 4.
A homeowner notices that her heating bill is the lowest in the month of August and increases until it reaches its highest amount in the month of February. After February, the amount of the heating bill slowly drops back to the level it was in August, when it begins to increase again. The amount of the bill in February is roughly four times the amount of the bill in August.
a. What type of function models the amount of the heating bill in a particular month? Explain how you know.
Answer:
Because exterior temperatures repeat fairly periodically, with the coldest temperatures in the winter and the warmest temperatures in the summer, we would expect a periodic use of heating fuel that was highest in the winter and lowest in the summer. Thus, we should use a sinusoidal function to model this scenario.
b. Do you have enough information to find a model that is appropriate for this situation? Either find a model or explain what other information you would need to do so.
Answer:
We cannot model this scenario because we do not know the highest or lowest amount of the heating bill. If we knew either of those amounts, we could find the other. Then, we could find the amplitude of the sinusoidal function and create a reasonable model.
Exercise 5.
An online merchant sells used books for $5. 00 each, and the sales tax rate is 6% of the cost of the books. Shipping charges are a flat rate of $4.00 plus an additional $1.00 per book.
a. What type of function models the total cost, including the shipping costs, of a purchase of x books? Explain how you know.
Answer:
We would use a linear function to model this situation because the total cost increases at a constant rate when you increase the number of books purchased.
b. Do you have enough information to find a model that is appropriate for this situation? Either find a model or explain what other information you would need to do so.
Answer:
We can model this situation exactly. If we buy x books, then the total cost of the purchase (in dollars) is given by
C(x) = 1.06(5x) + 4 + 1x
= 6.3x + 4.
Exercise 6.
A stunt woman falls from a tall building in an action-packed movie scene. Her speed increases by 32 ft/s for every second that she is falling.
a. What type of function models her distance from the ground at time t seconds? Explain how you know.
Answer:
Because her speed is increasing by 32 ft/s every second, her rate at which she gets closer to the ground is increasing linearly; thus, we would model this situation with a quadratic function.
b. Do you have enough information to find a model that is appropriate for this situation? Either find a model or explain what other information you would need to do so.
Answer:
We cannot create a model for this situation because we do not know the height of the building, so we do not know how far she will fall.
Eureka Math Algebra 2 Module 3 Lesson 22 Problem Set Answer Key
Question 1.
A new car depreciates at a rate of about 20% per year, meaning that its resale value decreases by roughly 20% each year. After hearing this, Brett said that if you buy a new car this year, then after 5 years the car has a resale value of $0.00. Is his reasoning correct? Explain how you know.
Answer:
Brett is not correct. If the car loses 20% of its value each year, then it retains 80% of its resale value each year. In that case, the proper model to use is an exponential function,
V(t) = P(0.80)t,
where P is the original price paid for the car when it was new, t is the number of years the car has been owned, and V(t) is the resale value of the car in year t. Then, when t = 5, the value of the caris V(5) = P(0.80)5 ≈ 0.33P;
so, after 5 years, the car is worth roughly 33% of its original price.
Question 2.
Alexei just moved to Seattle, and he keeps track of the average rainfall for a few months to see if the city deserves its reputation as the rainiest city in the United States.
| Month | Average Rainfall |
| July | 0.93 in. |
| September | 1.61 in. |
| October | 3.24 in. |
| November | 6.06 in. |
What type of function should Alexei use to model the average rainfall in month?
Answer:
Although the data appears to be exponential when plotted, an exponential model does not make sense for an seasonal phenomenon like rainfall. Alexel should use a sinusoidal function to model this data.
Question 3.
Sunny, who wears her hair long and straight, cuts her hair once per year on January 1, always to the same length. Her hair grows at a constant rate of 2 cm per month. Is It appropriate to model the length of her hair with a sinusoidal function? Explain how you know.
Answer:
No. If we were to use a sinusoidal function to model the length of her hair, then that would imply that her hair grows longer and then slowly shrinks back to its original length. Even though the length of her hair can be represented by a periodic function, it abruptly gets cut off once per year and does not smoothly return to its shortest length. None of our models are appropriate for this situation.
Question 4.
On average, it takes 2 minutes for a customer to order and pay for a cup of coffee.
a. What type of function models the amount of time you wait Inline as a function of how many people are in front of you? Explain how you know.
Answer:
Because the wait time increases by a constant 2 minutes for each person in line, we can use a linear function to model this situation.
b. Find a model that is appropriate for this situation.
Answer:
If there is no one ahead of you, then your wait time is zero. Thus, the wait time W, in minutes, can be modeled by
W(x)= 2x, where x is the number of people in front of you in line.
Question 5.
An online ticket-selling service charges $50.00 for each ticket to an upcoming concert. In addition, the buyer must pay 8% sales tax and a convenience fee of $6.00 for the purchase.
a. What type of function models the total cost of the purchase of n tickets in a single transaction?
Answer:
The complete price for each ticket is 1.08($50.00) = $54.00, so the total price of the purchase increases by $54.00 per ticket. Thus, this should be modeled by a linear function.
b. Find a model that is appropriate for this situation.
Answer:
The price (in dollars) for buying n tickets, including the convenience fee, is then T(n) = 54n + 6.
Question 6.
In a video game, the player must earn enough points to pass one level and progress to the next as shown in the table below.
| To pass this level…. | You need this many total points….. |
| 1 | 5,000 |
| 2 | 15,000 |
| 3 | 35,000 |
| 4 | 65,000 |
That is, the increase in the required number of points increases by 10,000 points at each level.
a. What type of function models the total number of points you need to pass to level n? Explain how you know.
Answer:
Because the increase in needed points is increasing linearly, we should use a quadratic function to model this situation.
b. Find a model that is appropriate for this situation.
Answer:
The amount of points needed to pass level n can be modeled by a quadratic function
P(n) = an2 + bn + c,
where we know that P(1) = 5000, P(2) = 15000, and P(3) = 35000. This gives us the three linear equations
a + b + c = 5000
4a + 2b + c = 15000
9a + 3b + c = 35000.
We can solve this system of three equations using the methods of Lesson 30 in Module 1, and we find
P(n) = 5000n2 – 5000n + 5000.
Question 7.
The southern white rhinoceros reproduces roughly once every 3 years, giving birth to one calf each time. Suppose that a nature preserve houses 100 white rhinoceroses, 50 of which are female. Assume that half of the calves born are female and that females can reproduce as soon as they are 1 year old.
a. What type of function should be used to model the population of female white rhinoceroses in the preserve?
Answer:
Because all female rhinoceroses give birth every 3 years, and half of those calves are assumed to be female, the population of female rhinoceroses increases by \(\frac{1}{6}\) every year. Thus, we should use an exponential function to model the population of female southern white rhinoceroses.
b. Assuming that there is no death in the rhinoceros population, find a function to model the population of female white rhinoceroses in the preserve.
Answer:
Since 1 + \(\frac{1}{6}\) ≈ 1.17 and the initial population is 50 female southern white rhinoceroses, we can model this by
R1(t) = 50(1.17)t.
c. Realistically, not all of the rhinoceroses survive each year, so we assume a 5% death rate of all rhinoceroses. Now what type of function should be used to model the population of female white rhinoceroses in the preserve?
Answer:
We should still use an exponential function, but the growth rate needs to be altered to take the death rate into account.
d. Find a function to mode’ the population of female white rhinoceroses in the preserve, taking Into account the births of new calves and the 5% death rate.
Answer:
Since 5% of the rhinoceroses die each year, that means that 95% of them survive. The new growth rate is
then 0.95(1.17) ≈ 1.11. The new model would be R2(t) = 50(1.11)t.
Eureka Math Algebra 2 Module 3 Lesson 22 Exit Ticket Answer Key
Question 1.
The amount of caffeine in a patient’s bloodstream decreases by half every 3.5 hours. A latte contains 150 mg of caffeine, which is absorbed into the bloodstream almost immediately.
a. What type of function models the caffeine level in the patient’s bloodstream at time t hours after drinking the latte? Explain how you know.
Answer:
Because the amount of caffeine decreases by half of the current amount in the bloodstream over a fixed time period, we would model this scenario by a decreasing exponential function.
b. Do you have enough information to find a model that is appropriate for this situation? Either find a model or explain what other information you would need to do so.
Answer:
Assuming that the latte was the only source of caffeine for this patient, we can model the amount of caffeine in the bloodstream (in mg) at time t (in hours) by
C(t) = 150(\(\frac{1}{2}\))\(\frac{t}{3.5}\)