Engage NY Eureka Math Algebra 2 Module 4 Lesson 13 Answer Key
Eureka Math Algebra 2 Module 4 Lesson 13 Example Answer Key
Example 1: Population and Sample
Answer the following questions, and then share your responses with a neighbor.
a. A team of scientists wants to determine the average length and weight of fish in Lake Lucerne. Name a sample that can be used to help answer their question.
Answer:
Answers will vary. The scientists could spend one day catching fish and then record the length and weight of each fish caught. The fish measured that day form a sample of the total fish population in the lake.
b. Golf balls from different manufacturers are tested to determine which brand travels the farthest. What is the population being studied?
Answer:
The population is all golf balls made by the manufacturers.
Exercise 1:
For each of the following, does the group described constitute a population or a sample? Or could it be considered to be either a population or a sample? Explain your answer.
a. The animals that live in Yellowstone National Park
Answer:
Population. The subjects are all the animals that live in Yellowstone National Park.
b. The first-run movies released last week that were shown at the local theater complex last weekend
Answer:
The subjects are first-run movies. 1f all of those released last week were acquired by our local theater management and were shown last weekend, then the first-run movies released last week would be considered a population. If our local theater management chose some of the first-run movies, then they would be a sample.
c. People who are asked how they voted in an exit poll.
Answer:
If all of the people who exited the polling place were asked how they voted, then they would be considered the population of people who exited a certain polling place on a certain day. if, however, only some of them were asked how they voted, then they would be considered a sample.
d. Some cars on the lot of the local car dealer.
Answer:
Sample. For example, a customer might only be interested in two-door models.
e. The words of the Gettysburg Address
Answer:
Population. Note that, the number of words varies depending on what version of the address is used. For example, “can not” is two words whereas “cannot” is one.
f. The colors of pencils available in a 36-count packet of colored pencils
Answer:
Population. The 36 colors available in the packet constitute the population of colors.
g. The students from your school who attended your school’s soccer game yesterday
Answer:
If the entire student body attended the game, then the students who attended the game would be considered a population. If just some of the student body attended, then they would be considered a sample of students at the school.
Example 2: Representative Sample
If a sample is taken for the purpose of generalizing to a population, the sample must be representative of the population. In other words, it must be similar to the population even though it is smaller than the population. For example, suppose you are the campaign manager for your friend who is running for senior class president. You would like to know what proportion of students would vote for her if the election was held today. The class is too big to ask everyone (314 students). What would you do?
Comment on whether or not each of the following sampling procedures should be used. Explain why or why not.
a. Poll everyone in your friend’s math class.
Answer:
This may not be the best option because everyone in the class may be biased toward your friend. For example, your friend may be great at math and help a lot of students prepare for tests. Everyone may look at her favorably.
b. Assign every student in the senior class a number from 1 to 314. Then, use a random number generator to select 30 students to poll.
Answer:
This is a good option because ¡t ensures that the sample looks like the rest of the senior class.
c. Ask every student who is going through the lunch line in the cafeteria who they will vote for.
Answer:
Answers may vary. This may or may not be a good option. The students going through the lunch line might be freshmen, sophomores, or juniors who do not vote for senior class president, so their opinions do not matter. However, if only seniors in the lunch line are asked how they will vote, this could be a good sample of the senior class.
Exercise 2:
There is no procedure that guarantees a representative sample. But the best procedure to obtain a representative sample is one that gives every different possible sample an equal chance to be chosen. The sample resulting from such a procedure is called a random sample.
Suppose that you want to randomly select 60 employees from a group of 625 employees.
Explain how to use a random number table or a calculator with a random number generator to choose 60 different numbers at random and include the students with these numbers in the sample.
Answer:
Random number generator: Assign each employee a number from 1 to 625. Then, generate 60 random numbers from the random number generator. If there are any duplicate numbers, generate additional numbers as needed.
Random number table: To do so, you could number all the employees from 001 to 625. Then, you could use a random number table. Any three-digit number beyond 625 is ignored, and any duplicated three-digit number is ignored.
The starting point on a random number table does not matter. For the purposes of this example, start at the far left. For example, from the following line of random digits, the first four employees randomly selected would be those with identification numbers 545, 150, 102, and 375.
Example 3: Population Characteristics and Sample Statistics
A statistical study begins with a question of interest that can be answered by data. Depending on the study, data could be collected from all individuals in the population or from a random sample of individuals selected from the population. Read through the following, and Identify which of the summary measures represents a population characteristic and which represents a sample statistic. Explain your reasoning for each.
Suppose the population of interest is the words of the Gettysburg Address. There are 269 of them (depending on the version).
a. The proportion of nouns in all words of the Gettysburg Address
Answer:
It is a population characteristic because it is determined from all of the words (the entire population) of the Gettysburg Address.
b. The proportion of nouns or the proportion of words containing the letter e in a random sample of words taken from the Gettysburg Address
Answer:
It is a sample statistic because it is determined from a sample of the words (the entire population) of the Gettysburg Address.
c. The mean length of the words in a random sample of words taken from the Gettysburg Address
Answer:
It is a sample statistic because it is determined from a sample of the words (the entire population) of the Gettysburg Address.
d. The proportion of all words in the Gettysburg Address that contain the letter e.
Answer:
It is a population characteristic because it is determined from all of the words (the entire population) of the Gettysburg Address.
Exercise 3:
For the following items of interest, describe an appropriate population, population characteristic, sample, and sample statistic. Explain your answer.
Answer:
Answers will vary. The following are examples of sample responses:
a. Time it takes students to run a quarter-mile
Answer:
Population: all students in the eleventh grade at your school
Population characteristic: mean time to run a quarter-mile for all students in the eleventh grade at your school
Sample: a random selection of students in the eleventh grade at your school
Sample statistic: mean time to run a quarter-mile for the sampled students in the eleventh grade at your school.
b. National forests that contain bald eagle nests
Answer:
Population: all national forests in the United States
Population characteristic: the proportion of all national forests in the U.i that contain bald eagle nests
Sample: A random selection of national forests in the U.S.
Sample statistic: the proportion of the sampled national forests in the U.S. that contain bald eagle nests
c. Curfew time of boys compared to girls
Answer:
Population: all boys and girls in the eleventh grade at your school
Population characteristic: the difference in mean curfew time of all eleventh-grade boys at your school and the mean curfew time of all eleventh-grade girls at your school
Sample: a random selection of some boys and girls sampled from the eleventh grade at your school
Sample statistic: the difference in mean curfew time of the sampled eleventh-grade boys at your school and the mean curfew time of the sampled eleventh-grade girls at your school.
d. Efficiency of electric cars
Answer:
Population: all-electric cars currently being marketed
Population characteristic: the mean number of kilowatt-hours to drive loo miles for all-electric cars currently being marketed
Sample: a random selection of electric cars currently being marketed
Sample statistic: the mean number of kilowatt-hours to drive 100 miles for the sampled electric cars currently being marketed.
Exercise 4:
Consider the following questions:
→ What proportion of eleventh graders at our high school is taking at least one advanced placement course?
→ What proportion of eleventh graders at our high school have a part-time job?
→ What Is the typical number of hours an eleventh grader at our high school studies outside of school hours on a weekday (Monday, Tuesday, Wednesday, or Thursday)?
→ What is the typical time (in minutes) that students at our high school spend getting to school?
→ What is the proportion of students at our high school who plan to attend a college or technical school after graduation?
→What is the typical amount of time (in hours per week) that students at our high school are involved in community service?
Select one of these questions (or a different statistical question that has been approved by your teacher). Working with your group, write a paragraph that:
→ States the statistical question of interest pertaining to the students in the population for the statistical question selected.
→ Identifies a population characteristic of interest.
→ Identifies the appropriate statistic based on a sample of 40 students.
→ States what property your sample must-have for you to be able to use its results to generalize to all students in your high school.
→ Includes the details on how you would select your sample.
Answer:
Possible responses for two of the above questions:
We are interested in answering the statistical question, “What proportion of eleventh graders at our high school are taking at least one advanced placement course We would go to our high school counselors and obtain a list of the 403 eleventh graders at our high school.
We would number the students from 001 to 403. We decided to randomly select 40 students for our sample. To do so, we would find a random number table, choose a place to start, and then generate 40 different random numbers between 001 and 403.
If we find that 14 of the 40 students in the sample are taking at least one AP course this year, we would use that information to calculate the sample proportion of students who are taking at least one AP course. Since our sample was a random sample, we can generalize our estimate to the population of eleventh graders at our school and estimate that the proportion of all eleventh graders who are taking at least one AP course this year is 0.35.
Also, consider the following: We are interested in the question about community service. The statistical question is, “What is the typical amount of time (in hours per week) that students at our school are involved in community service?” We would go to our school’s guidance department and ask them to help us.
The guidance counselor has an alphabetical list of the 1,245 students enrolled in our school. Listed students are numbered from 0001 to 1245. We decided we would select 40 students at random for our study. Using our graphing calculator, we would obtain 40 different random numbers between 1 and 1245.
We would ask the guidance counselor to identify the student associated with each of the 40 numbers. We would also ask for the location of the student during the last period of the day, so we could quickly ask them a question before leaving school We would ask, “How many hours of community service did you complete last week?”
We would find the mean of the 40 numbers reported by the students in our sample. The mean is our statistic for this study. If our sample was randomly selected, we can generalize to the population of oil students at the school, and we would use the sample mean to estimate the mean number of hours of community service per week for students at our school For example if the mean of the 40 randomly selected students is 14.5 hours, we would say that our best estimate of the mean number of hours students in our school are involved In community service is 14.5 hours per week.
Eureka Math Algebra 2 Module 4 Lesson 13 Problem Set Answer Key
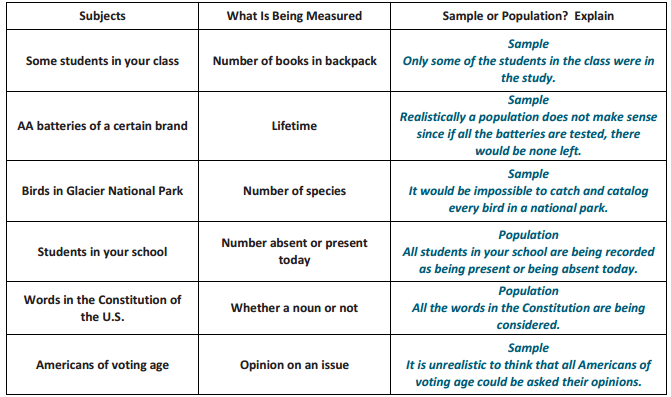
Question 1.
In the following, identify whether the subjects being measured are the sample or the population. In some cases, they could be considered a sample or a population. Explain each answer.
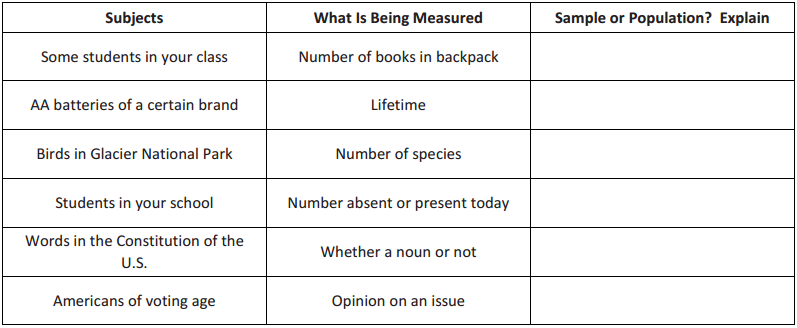
Answer:
Question 2.
For the following items of interest, describe an appropriate population, a population characteristic, a sample, and a sample statistic.
a. Whether or not a driver is speeding In your school zone during school hours in a day
Answer:
Answers will vary. A sample response is given.
Population: all drivers who drive through your school zone during school hours on a certain day
Population characteristic: proportion of all drivers who exceed the speed limit in your school zone during school hours on a certain day
Sample: some drivers who drive in your school zone from noon to 1:00 p.m. on a certain day
Sample statistic: proportion of the sampled drivers who exceed the speed limit in your school zone from noon to 1:00 p.m. on a certain day
b. Seatbelt usage of men compared to women
Answer:
Answers will vary. A sample response is given.
Population: all men and women drivers in the state of New York
Population characteristic: the difference in the proportion of all male drivers in the state of New York who always wear a seatbelt and the proportion of a life male drivers in the state of New York who always wear a seat belt
Sample: some men and women drivers in the state of New York
Sample statistic: the difference in the proportion of the male drivers sampled who always wear a seatbelt and the proportion of the female drivers sampled who always wear a seatbelt.
c. Impact of a new antidepressant on people with severe headaches
Answer:
Answers will vary. A sample response is given.
Population: all people in New York with severe headaches
Population characteristic: In the meantime, it takes the new antidepressant to eliminate the headaches for all people in New York with severe headaches
Sample: some people in New York with severe headaches
Sample statistic: In the meantime, it takes the new antidepressant to eliminate the headaches for the sampled people in New York with severe headaches.
Question 3.
What are the identification numbers for ten students chosen at random from a population of 78 students based on the following string of random digits? Start at the left.
27816 78416 01822 73521 37741 016312 68000 53645 56644 97892 63408 77919 44575
Answer:
27 67 16 01 27 35 21 37 74 10
Eureka Math Algebra 2 Module 4 Lesson 13 Exit Ticket Answer Key
Question 1.
Indicate whether each of the following is a summary measure from a population or from a sample. Choose the one that is more realistically the case. If it is from a population, identify the population characteristic. If it is from the sample, identify the sample statistic. Explain your reasoning.
a. 88% of the more than 300 million automobile discarded tires per year are recycled or used for fuel.
Answer:
Population. The statement concerns all discarded tires in a year.
Characteristic: percentage of all discarded tires that are recycled or used for fuel.
b. The mean number of words that contain the letter e in the Gettysburg Address
Answer:
Population. The statement refers to the entire document.
Characteristic: mean number of words that contain the letter “e”.
c. 64% of respondents in a recent poll indicated that they favored building a proposed highway in their town.
Answer:
Sample. Not everyone in the town contributed.
Characteristic: percentage of respondents who favor highway construction.