Engage NY Eureka Math Algebra 2 Module 4 Lesson 16 Answer Key
Eureka Math Algebra 2 Module 4 Lesson 16 Exercise Answer Key
Exploratory Challenge 1/Exercises 1 – 4: Mystery Bag
In this lesson, you will use data from a random sample drawn from a mystery bag to estimate a population proportion and learn how to find and interpret a margin of error for your estimate.
Exercise 1.
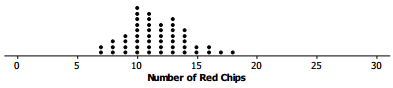
Write down your estimate for the proportion of red chips in the mystery bag based on the random sample of 30 chips drawn in class.
Answer:
If 15 red chips were in the sample of 30, some students might suggest that of the chips in the mystery bag were red. Others might suggest an interval around 0.5.
Exercise 2.
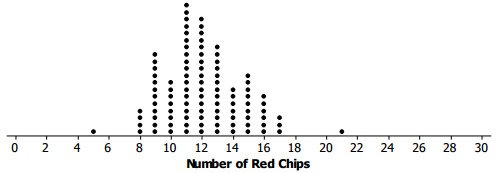
Tanya and Raoul had a paper bag that contained red and black chips. The bag was marked 40% red chips. They drew random samples of 30 chips, with replacement, from the bag. (They were careful to shake the bag after they replaced a chip.) They had 9 red chips in their sample. They drew another random sample of 30 chips from the bag, and this time they had 12 red chips. They repeated this sampling process 50 times and made a plot of th number of red chips in each sample. A plot of their sampling distribution is shown below.
a. What was the most common number of red chips in the 50 samples? Does this seem reasonable? Why or why not?
Answer:
The most common number in the samples was 10 red chips, which seems reasonable because we would expect to have about 40% successes, and 40% of 30 is 12 successes, and 10 is close to that.
b. What number of red chips, if any, never occurred in any of the samples?
Answer:
They never got a sample with a number of red chips less than or equal to 6 or more than or equal to 20.
c. Give an interval that contains the likely number of red chips in samples of size 30 based on the simulated sampling distribution.
Answer:
From 7 to 9 red chips
Note: Do not focus on exactly what “likely” means. The object is to see if it is at all reasonable for an outcome to occur by chance.
d. Do you think the number of red chips in the mystery bag could have come from a sample drawn from a bag that had 40% red chips? Why or why not?
Answer:
This depends on the number of red chips that were observed in the random sample drawn from the mystery bag. if the observed number of red chips was 18, the answer would be “yes” because 18 red chips occurred just by chance in the simulated sampling distribution.
Some students might suggest 18 or more red chips only occurred twice in 50 random samples, so it was not too likely but could happen by chance. The important concept is that students look at the simulated distribution to see where the observed outcome falls with respect to that distribution.
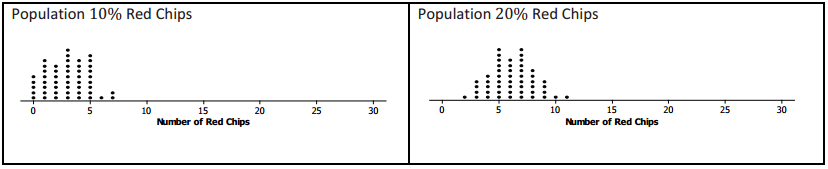
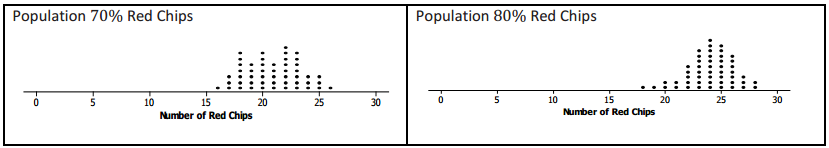
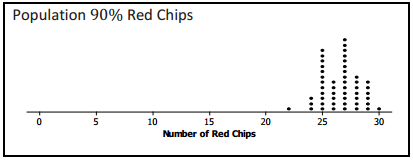
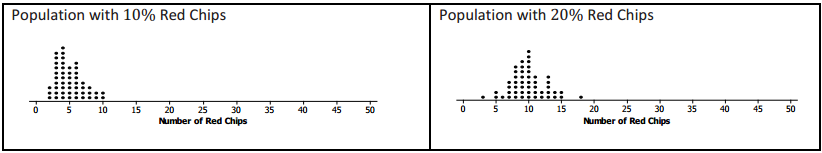
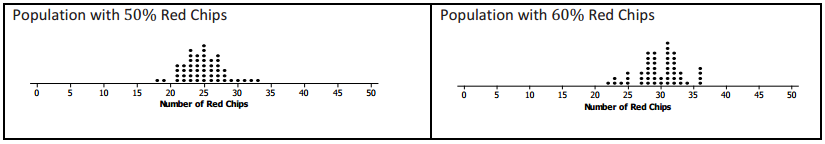
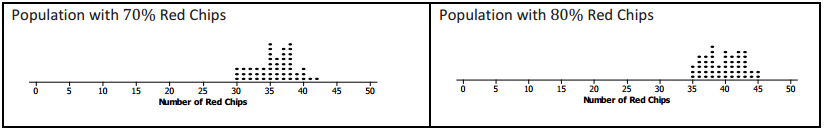
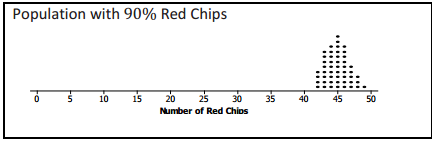
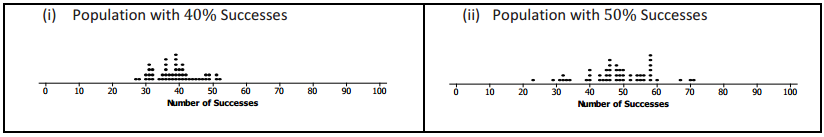
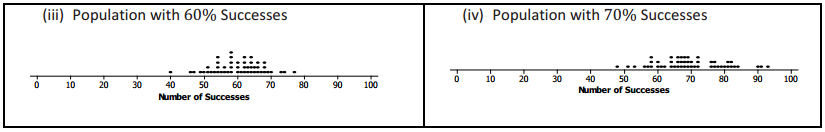
Nine different bags of chips were distributed to small teams of students in the class. Each bag had a different proportion of red chips. Each team simulated drawing 50 different random samples of size 30 from their bags and recorded the number of red chips for each sample. The graphs of their simulated sampling distributions are shown below.
Exercise 3.
Think about the number of red chips in the random sample of size 30 that was drawn from the mystery bag.
a. Based on the simulated sampling distributions, do you think that the mystery bag might have had 10% red chips? Explain your reasoning.
Answer:
If the random sample of size 30 from the mystery bag had 18 red chips, the answer would be “no” because 18 never showed up once in all of the samples.
b. Based on the simulated sampling distributions, which of the percentages 10%, 20%, 30%, 40%, 50%, 60%, 70%, 80%, and 90% might reasonably be the percentage of red chips in the mystery bag?
Answer:
If the number of red chips in the sample from the mystery bag was 18, it looks like, just by chance, the sample could have been drawn from a population having from 40% to 80% red chips.
c. Let p represent the proportion of red chips in the mystery bag. (For example, p = 0.40 if there are 40% red chips in the bag.) Based on your answer to part (b), write an inequality that describes plausible values for p. Interpret the inequality in terms of the mystery bag population.
Answer:
0.40 ≤ p ≤ 0.80
This means that based on the simulated sampling distributions, the true proportion of red chips in the mystery bag could have been anywhere from 0.40 to 0.80. It would not have been surprising for a random sample of size 30 drown from any of these populations to have included 18 red chips.
Exercise 4.
If the inequality like the one you described in part (c) of Exercise 3 went from 0.30 to 0.60, it is sometimes written as 0.45 ± 0. 15. The value 0. 15 is called a margin of error. The margin of error represents an interval from the expected proportion that would not contain any proportions or very few proportions based on the simulated sampling distribution. Proportions in this interval are not expected to occur when taking a sample from the mystery bag.
a. Write the inequality you found in Exercise 3 part (c), using this notation. What is the margin of error?
Answer:
Using 18 as the number of red chips in the random sample from the mystery bag, the interval would be 0.60 ± 0.20. The margin of error is defined as an interval of 0.20.
b. Suppose Sol said, “So this means that the actual proportion of red chips in the mystery bag was 60%.” Tonya argued that the actual proportion of red chips in the mystery bag was 20%. What would you say?
Answer:
They are both wrong. The notation does not mean that the center of the interval is the actual population but that it is the center of an interval made by adding and subtracting the margin of error. A random sample drawn from any proportion in the interval could have produced an outcome of 18 red chips. Tonya has mixed up the number describing the length of the interval with the population proportion.
Exploratory Challenge 2/Exercises 5 – 7: Samples of Size 50
Exercise 5.
Do you think the margin of error would be different in Exercise 4 if you had sampled 50 chips instead of 30? Try to convince a partner that your conjecture is correct.
Answer:
They might be different but maybe only a little bit. I am not sure why the sample size would make a difference because the counts would be different, but it would still be centered around the same proportion (40% of a sample of size 30 is 12 red chips; 40% of a sample of size 50 is 20 red chips – different counts but the same proportion).
Exercise 6.
Below are simulated sampling distributions of the number of red chips for samples of size 50 from populations with various percentages of red chips.
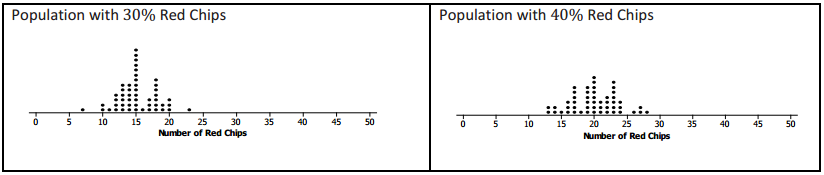
a. Suppose you drew 30 red chips in a random sample of 50 from the mystery bag. What are plausible values for the proportion of red chips in the mystery bag? Explain your reasoning.
Answer:
Plausible population proportions are from 0.50 to 0.70.
b. Write an expression that contains the margin of error based on your answer to part (a).
Answer:
The margin of error statement would be 0.60 ± 0. 10. The margin of error would be 0.10.
Exercise 7.
Remember your conjecture from Exercise 5, and compare the margin of error you found for a sample of size 30 (from Exercise 3) to the margin of error you found for a sample of size 50.
a. Was your reasoning in Exercise 5 correct? Why or why not?
Answer:
I forgot that the sample size might have to do with the spread of the distribution, not just the center, so my reasoning was not correct.
b. Explain why the change in the margin of error makes sense.
Answer:
The margin of error was 0.10 for the sample size of 50, which is less than the margin of error for the sample size of 30. It makes sense that the margin of error would decrease as the sample size increases because as the sample size increases, the variability from sample to sample decreases, and the sample proportions tend to be closer to the actual population proportion.
Eureka Math Algebra 2 Module 4 Lesson 16 Problem Set Answer Key
Question 1.
Tanya simulated drawing a sample of size 30 from a population of chips and got the following simulated sampling distribution for the number of red chips:
Which of the following results seem like they might have come from this population? Explain your reasoning.
I. 8 red chips in a random sample of size 30
II. 12 red chips in a random sample of size 30
III. 24 red chips in a random sample of size 30
Answer:
Samples that had 8 and 12 red chips might have come from this population because they occurred by chance in the random samples from the simulation. A sample with 24 red chips never occurred by chance, so it seems more unlikely to happen for this population.
Question 2.
64% of the students in a random sample of 100 high school students intended to go to college. The graphs below show the result of simulating random samples of size 100 from several different populations where the success percentage was known and recording the percentage of successes in the sample.
a. Based on these graphs, which of the following are plausible values for the percentage of successes in the population from which the sample was selected: 40%, 50%, 60%, or 70%? Explain your thinking.
Answer:
The graphs show that 64% successes were a likely outcome for samples from populations with 60% and 70% successes. While exactly 64% did not occur in the 50% success population, it was in the range of observed sample percentages and, thus, could have happened. None of the samples from the 40% success population had a percentage of successes as large as 64%, so it would not seem likely that the sample came from this population.
b. Would you need more information to determine plausible values for the actual proportion of the population of high school students who intend to go to some post-secondary school? Why or why not?
Answer:
Yes, you would need more information because you have not really looked at any simulated distributions of sample proportions larger than 70%. And 80% or 90% might turn out to be plausible as well.
Question 3.
Suppose the mystery bag had resulted in the following number of red chips. Using the simulated sampling distributions found earlier in this lesson, find a margin of error in each case.
a. The number of red chips in a random sample of size 30 was 10.
Answer:
0.20 to 0. 50, or0.35 ± 0. 15, for a margin of error of 0.15
b. The number of red chips in a random sample of size 30 was 21.
Answer:
0.50 to 0.80, or 0.65 ± 0. 15, for a margin of error of 0.15
c. The number of red chips in a random sample of size 50 was 22.
Answer:
0.40 to 0. 60, or 0. 50 ± 0. 10, for a margin of error of 0.10
Question 4.
The following intervals were plausible population proportions for a given sample. Find the margin of error in each case.
a. From 0.35 to 0.65
Answer:
0.50 ± 0.15
b. From 0.72 to 0.78
Answer:
0.75 ± 0.03
c. From 0.84 to 0.95
Answer:
0.895 ± 0.055
d. From0.47 to
0.57
Answer:
0.52 ± 0.05
Question 5.
Decide if each of the following statements is true or false. Explain your reasoning in each case.
a. The smaller the sample size, the smaller the margin of error.
Answer:
False. The smaller the sample size, the larger the margin of error.
b. If the margin of error is 0.05 and the observed proportion of red chips is 0.45, then the true population proportion is likely to be between 0.40 and 0.50.
Answer:
True. The range of plausible values for the population proportion is 0.40 to 0. 50.
Question 6.
Extension: The margin of error for a sample of size 30 is 0.20; for a sample of 50, it is 0. 10. If you increase the sample size to 70, do you think the margin of error for the percent of successes will be 0.05? Why or why not?
Answer:
No. When we simulated the sampling distributions for a sample size of 100, the margin of error got smaller but was not 0.05.
Eureka Math Algebra 2 Module 4 Lesson 16 Exit Ticket Answer Key
Question 1.
Suppose you drew a sample of 12 red chips in a sample of 30 from a mystery bag. Describe how you would find plausible population proportions using the simulated sampling distributions we generated from populations with known proportions of red chips.
Answer:
Answers will vary. I would look at the simulated distributions to see which ones contained the outcome of 12 red chips. For those that did, the corresponding population proportion would be Included In the set of plausible population proportions. (Students might use the actual distributions if they have them available and use the corresponding interval as an example in their answers – 0.20 to 0.50 in those above.)
Question 2.
What would happen to the interval containing plausible population proportions if you changed the sample size to 60?
Answer:
The width of the interval would decrease, and the margin of error would be smaller.