Engage NY Eureka Math Algebra 2 Module 4 Lesson 18 Answer Key
Eureka Math Algebra 2 Module 4 Lesson 18 Exercise Answer Key
Exploratory Challenge/Exercises 1 – 7: Random Segments
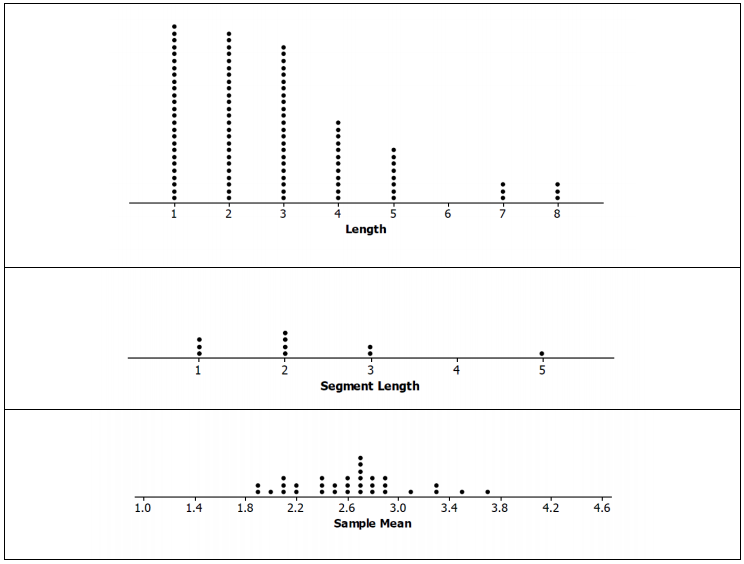
The worksheet contains 100 segments of different lengths. The length of a segment is the number of rectangles spanned on the grid. For example, segment 2 has a length 5.
Exercise 1.
Briefly review the sheet, and estimate the mean length of the segments. Will your estimate be close to the actual mean? Why or why not?
Ans:
Answers will vary. Some may estimate 5, others as low as 2.
Sample response: I estimate the mean length is 4. 1 believe my estimate will be close to the actual mean because it appears as if a large number of the segments are around 4, and ifS average the longer and shorter lengths, the average is also around 4.
Exercise 2.
Look at the sheet. With which of the statements below would you agree? Explain your reasoning.
The mean length of the segments is
a. Close to 1.
b. Close to 8.
c. Around 5.
d. Between 2 and 5.
Ans:
The only choice that makes sense to me is (d), between 2 and 5. The smallest segment length was 1, so it does not make sense that the mean would be the smallest. The largest segment length was 8, so again, it would not make sense to have the mean be 8 or even 5 because there are a lot of segments of lengths 1 and 2.
Exercise 3.
Follow your teacher’s directions to select ten random numbers between 1 and 100. For each random number, start at the upper left cell with a segment value of 2, and count down, and to the right the number of cells based on the random number selected. The number in the cell represents the length of a randomly selected segment.
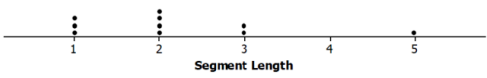
a. On a number line, graph the lengths of the corresponding segments on the worksheet.
Ans:
For the random numbers {8, 23, 35, 74, 40, 75, 9, 50, 54, 64}, the sample lengths would be {2, 2, 1, 1, 2, 1, 3, 5, 2, 3}. The graph would look like:
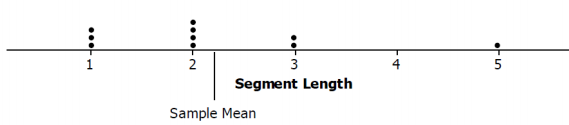
b. Find the mean and standard deviation of the lengths of the segments in your sample. Mark the mean length on your graph from part (a).
Ans:
The mean sample length is 2.2 units, and the standard deviation is 1.23 units.
Exercise 4.
Your sample provides some information about the mean length of the segments in one random sample of size 10, but that sample is only one among all the different possible random samples. Let’s look at other random samples and see how the means from those samples compare to the mean segment length from your random sample.
Record the mean segment length for your random sample on a sticky note, and post the note in the appropriate place on the number line your teacher set up.
Ans:
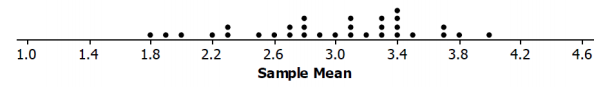
Sample response (based on a class with 31 students):
Simulated sampling distribution of mean segment lengths for samples of size 10.
a. Jonah looked at the plot and said, “Wow. Our means really varied.” What do you think he meant?
Ans:
Many of the samples had mean lengths that were different. Some were the same, but most were not.
b. Describe the simulated sampling distribution of mean segment lengths for samples of size lo.
Ans:
The maximum mean segment length in our samples of size 10 was 4.0, and the minimum was 1.7. The sample means seemed to center around 3, with most of the segments from about 2.5 to 3.5 units long.
c. How did your first estimate (from Exercise 1) compare to your sample mean from the random sample? How did it compare to the means in the simulated distribution of the sample means from the class?
Ans:
My estimate was way off. I thought the mean length would be larger, like maybe 4.5 units. My sample mean was only 2.2 units long, which was smaller than all but three of the other sample means.
Exercise 5.
Collect the values of the sample means from the class.
a. Find the mean and standard deviation of the simulated distribution of the sample means.
Ans:
Sample response (based on the 31 sample means used to produce the answer to Exercise 3): The mean of the simulated distribution of sample means is 2.97, and the standard deviation is 0.57.
b. lnterpret the standard deviation of the simulated sampling distribution in terms of the length of the segments.
Ans:
Sample response: A typical distance of a sample mean from the center of the sampling distribution is about 057.
c. What do you observe about the values of the means in the simulated sampling distribution that are within two standard deviations from the mean of the sampling distribution?
Ans:
Sample response: All of the sample means were within two standard deviations from the mean of the sampling distribution, from 1.53 to 4.11.
Exercise 6.
Generate another set of ten random numbers, find the corresponding lengths on the sheet, and calculate the mean length for your sample. Put a sticky note with your sample mean on the second number line. Then, answer the following questions.
Ans:
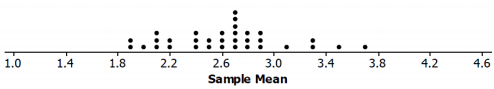
Sample response (based on a class with 31 students): second simulated sampling distribution of mean segment lengths for 33 samples of size 10.
a. Find the mean and standard deviation of the simulated distribution of the sample means.
Ans:
Sample response: The mean is 2.63 units, and the standard deviation is 0.44 unit.
b. Interpret the standard deviation of the simulated sampling distribution in terms of the length of the segments.
Ans:
Sample response: A typical distance of a sample mean from the center of the sampling distribution is about 0.44.
c. What do you observe about the values of the means in the simulated sampling distribution that are within two standard deviations from the mean of the sampling distribution?
Ans:
Sample response: Only one or two sample means were not within two standard deviations from the mean of the sampling distribution, 1.75 to 3. 51.
Exercise 7.
Suppose that we know the actual mean of all the segment lengths is 2.78 units.
a. Describe how the population mean relates to the two simulated distributions of sample means.
Ans:
The simulated sampling distributions of sample means were both centered around values very close to the population mean.
b. Tonya was concerned that neither of the simulated distributions of sample means had a value around 5, but some of the segments on the worksheet were 5 units long, and some were as big as 8 units long. What would you say to Tonya?
Ans:
The simulated sampling distribution was of the means of the samples, not of individual segment lengths. it could be possible to have a mean length of 5 from a sample of ten segment lengths, but it is not very likely.
Eureka Math Algebra 2 Module 4 Lesson 18 Problem Set Answer Key
Question 1.
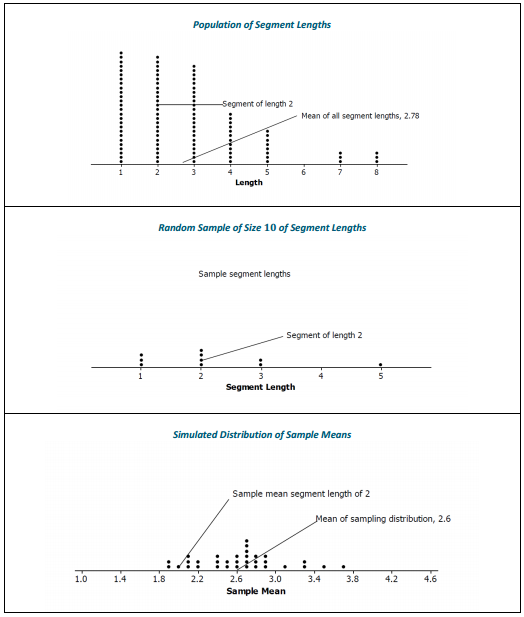
The three distributions below relate to the population of all of the random segment lengths and to samples drawn from that population. The eight phrases below could be used to describe a whole graph or a value on the graph. Identify where on the appropriate graph the phrases could be placed. (For example, segment of length 2 could be placed by any of the values in the column for 2 on the plot labeled Length.)
a. Random sample of size 10 of segment lengths
b. Segment of length 2
c. Sample mean segment length of 2
d. Mean of sampling distribution, 2.6
e. Simulated distribution of sample means
f. Sample segment lengths
g. Population of segment lengths
h. Mean of all segment lengths, 2.78
Ans:
Possible answers are shown below. (Note that segment of length 2 could be used in more than one place and on more than one graph.)
Question 2.
The following segment lengths were selected in four different random samples of size 10.
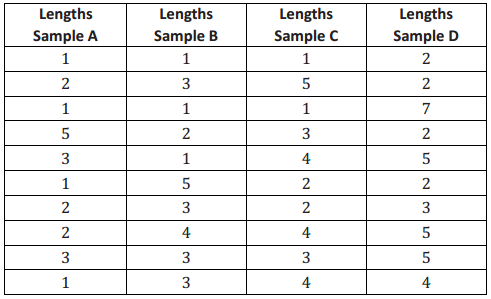
a. Find the mean segment length of each sample.
Ans:
Sample A mean is 2.1 (1.29); Sample B mean is 2.6 (1.35); Sample C mean is 2.9 (1.37); Sample D mean is 3.7 (1.77). The standard deviation of each sample is noted in parentheses as a reference for part (b).
b. Find the mean and standard deviation of the four sample means.
Ans:
The mean of the sample means is 2.825, and the standard deviation of the sample means is 0.67.
c. Interpret your answer to part (b) in terms of the variability in the sampling process.
Ans:
A typical distance of a sample mean from the mean of the four samples (2.825) is 0.67.
Question 3.
Two simulated sampling distributions of the mean segment lengths from random samples of size 10 are displayed below.
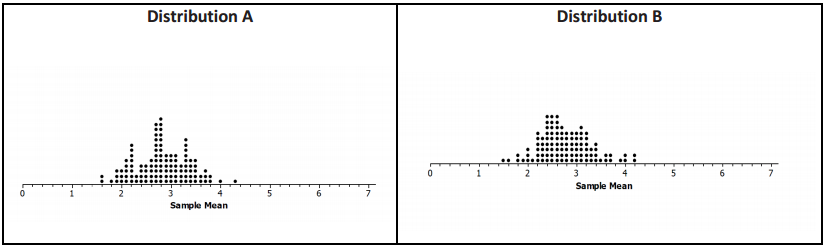
a. Compare the two distributions with respect to shape, center, and spread.
Ans:
Both distributions are mound-shaped with the center a bit below 3, about 2.8. The maximum mean segment length in both is about 4.2 units, and the minimum is about 1. 5 or 1.6. Most of the sample means in both distributions are between about 2 and 4.
b. Distribution A has a mean of 2.82, and Distribution B has a mean of 2.77. How do these means compare to the population mean of 2. 78?
Ans:
The mean segment lengths of the two simulated distributions of sample means are very close to the actual mean segment length.
c. Both Distribution A and Distribution B have a standard deviation 0.54. Make a statement about the distribution of sample means that makes use of this standard deviation.
Ans:
Answers will vary. Possible answers include the following:
→ Almost all of the sample means in Distribution A are within two standard deviations of the mean of the
sample means, 1.74 to 3.90. The same is true for the sample means in Distribution B; the sample means are almost all from 1.69 to 3.85.
→ A typical distance of a sample mean from the center of the sampling distribution is 0.54.
Question 4.
The population distribution of all the segment lengths is shown in the dot plot below. How does the population distribution compare to the two simulated sampling distributions of the sample means in Problem 3?
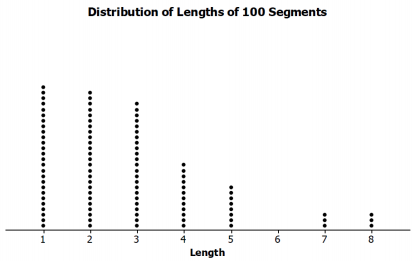
Ans:
The distribution of all of the lengths is skewed right. Most of the lengths were 1, 2, or 3 units. The simulated sampling distributions of the sample means were both mound-shaped, with the centers about the same, and not like the shape of the population.
Eureka Math Algebra 2 Module 4 Lesson 18 Exit Ticket Answer Key
Question 1.
Describe what a simulated distribution of sample means is and what the standard deviation of the distribution indicates.
Ans:
You may want to refer to the segment lengths in your answer. You draw samples of a given size from o population (here, it was the 100 segment lengths), find the mean segment length of each sample, and plot the sample mean lengths.
The resulting distribution of the sample means from those random samples is the simulated distribution of sample means. The standard deviation of that distribution gives you an idea of how the sample means vary from sample to sample.