Engage NY Eureka Math Algebra 2 Module 4 Lesson 21 Answer Key
Eureka Math Algebra 2 Module 4 Lesson 21 Example Answer Key
Example 1: Estimating a Population Mean Using a Random Sample
Provide a one-sentence summary of our findings from the previous lesson.
Answer:
We took lots of random samples of computer game ratings, computed their means, displayed the distribution of their means, and, finally, computed a margin of error.
What were drawbacks of the calculation method?
Answer:
Many samples are required. If we had increased the sample size or the number of samples, the time required to take all those samples, calculate their means, and analyze the distribution would have increased significantly.
In practice, you do not have to use that process to find the margin of error. Fortunately, just as was the case with estimating a population proportion, there are some general results that lead to a formula that allows you to estimate the margin of error using a single sample. You can then gauge the accuracy of your estimate of the population mean by calculating the margin of error using the sample standard deviation.
The standard deviation of the distribution of sample means is approximated by \(\frac{s}{\sqrt{n}}\), where s is the standard deviation of the sample and n is the size of the sample.
Eureka Math Algebra 2 Module 4 Lesson 21 Exercise Answer Key
Exercises 1 – 5:
Exercise 1.
Suppose a random sample of size ten produced the following ratings in the computer games rating example in the last lesson: 12, 5, 2, 4, 1, 4, 18, 10, 1, 16. Estimate the population mean rating based on these ten sampled ratings.
Answer:
\(\frac{73}{10}\) = 7.3
The sample mean estimate for the population mean rating is 7.3 rating points.
Exercise 2.
Calculate the sample standard deviation. Round your answer to three decimal places.
Answer:
The sample standard deviation is 6.2725 rating points.
Exercise 3.
Use the formula given above to calculate the approximate standard deviation of the distribution of sample means. Round your answer to three decimal places.
Answer:
\(\frac{s}{\sqrt{n}}=\frac{6.273}{\sqrt{10}}\) ≈ 1.984
The standard deviation of the distribution of sample means is 1.984 rating points.
Exercise 4.
Recall that the margin of error is twice the standard deviation of the distribution of sample means. What is the value of the margin of error based on this sample? Write a sentence interpreting the value of the margin of error in the context of this problem on computer game ratings.
Answer:
2(1.984) = 3.968
The margin of error is 3.968 rating points. The population mean rating for the 100 computer games is likely to be within 3.968 rating points of the sample mean estimate 7.3.
Exercise 5.
Based on the sample mean and the value of the margin of error, what is an interval of plausible values for the population mean?
Answer:
Because 7.3 – 3.968 = 3.332 and 7.3 + 3.968 = 11.268, plausible values for the population mean rating are from 3.332 to 11.268 rating points.
Exercises 6 – 13: The Gettysburg Address
The Gettysburg Address is considered one of history’s greatest speeches. Some students noticed that the speech was very short (about 268 words, depending on the version) and wondered if the words were also relatively short. To estimate the mean length of words in the population of words in the Gettysburg Address, work with a partner on the following steps. Your teacher will give you a copy of the Gettysburg Address with words numbered from 001 to 268.
Exercise 6.
Develop and describe a plan for collecting data from the Gettysburg Address and determining the typical length of a word. Then, implement your plan, and report your findings.
Answer:
Many answers are possible. Every answer should include the following:
- A description of how a word sample is chosen, making sure to describe how randomization occurs
- The actual sample chosen
- Calculations of the sample mean, standard deviation, and margin of error
- Interpretations in context of the sample mean, standard deviation, and margin of error.
Exercise 7.
Use a random number table or a calculator with a random number generator to obtain ten different random numbers from 001 to 268.
Answer:
Student answers will vary.
Sample solutions to Exercises 8-12 will use the following values.
219 229 2 113 77 140 185 70 119 54
Exercise 8.
Use the random numbers found in Exercise 7 as identification numbers for the words that will make up your random sample of words from the Gettysburg Address. Make a list of the ten words in your sample.
Answer:
219 the
229 resolve
2 score
113 consecrate
77 final
140 The
185 nobly
70 a
119 The
54 endure
Exercise 9.
Count the number of letters in each of the ten words in your sample.
Answer:
3 7 5 10 5 3 5 1 3 6
Exercise 10.
Calculate the sample mean number of letters for the ten words In your sample.
Answer:
\(\frac{48}{10}\) = 4.8
The mean of the ten-word lengths from Exercise 9 is 4.8 letters.
Exercise 11.
Calculate the sample standard deviation of the number of letters for the ten words in your sample. Round your answer to three decimal places.
Answer:
The standard deviation of the ten-word lengths from Exercise 9 is 2.530 letters.
Exercise 12.
Use the sample standard deviation from Exercise 11 to calculate the margin of error associated with using your sample mean as an estimate of the population mean. Round your answer to three decimal places.
Answer:
2\(\left(\frac{2.530}{\sqrt{10}}\right)\) ≈ 1.600
The margin of error of this estimate is approximately 1.600 letters.
Exercise 13.
Write a few sentences describing what you have learned about the mean length of the population of 268 words in the Gettysburg Address. Be sure to include an interpretation of the margin of error.
Answer:
We estimate the mean word length of words in the Gettysburg Address to be 4.8 letters. The margin of error of this estimate is 1.6 letters. So, plausible values for the population mean word length are from 3.2 to 6.4 letters.
Eureka Math Algebra 2 Module 4 Lesson 21 Problem Set Answer Key
Question 1.
A new brand of hot dog claims to have a lower sodium content than the leading brand.
a. A random sample of ten of these new hot dogs results in the following sodium measurements (in milligrams).
370 326 322 297 326 289 293 264 327 331
Estimate the population means sodium content of this new brand of hot dog based on the ten sampled measurements.
Answer:
Based on the data, an estimate for the population mean sodium content of this new brand of hot dog is 314.5 mg of sodium.
b. Calculate the margin of error associated with your estimate of the population mean from part (a). Round your answer to three decimal places.
Answer:
\(\left(\frac{29.436}{\sqrt{10}}\right)\) ≈ 18.617
The margin of error is approximately 18.617 mg.
c. The mean sodium content of the leading brand of hot dogs is known to be 350 mg. Based on the sample mean and the value of the margin of error for the new brand, is a mean sodium content of 350 mg a plausible value for the mean sodium content of the new brand? Comment on whether you think the new brand of hot dog has a lower sodium content on average than the leading brand.
Answer:
314.5 mg – 18.617 mg = 295.883 mg and 314.5 mg + 18.617 mg = 333.117 mg
Plausible values for population mean sodium content is between 295.883 mg and 333. 117 mg. This interval is well below 350 mg, which is the sodium content for the leading brand. So, the new hot dog brand has lower mean sodium content.
d. Another random sample of 40 new-brand hot dogs is taken. Should this larger sample of hot dogs produce a more accurate estimate of the population mean sodium content than the sample of size 10? Explain your answer by appealing to the formula for margin of error.
Answer:
The margin of error will be smaller. Sample size is in the denominator of the formula for margin of error.
Question 2.
It is well known that astronauts increase their height in space missions because of the lack of gravity. A question is whether or not we Increase height here on Earth when we are put into a situation where the effect of gravity Is minimized. In particular, do people grow taller when confined to a bed? A study was done in which the heights of six men were taken before and after they were confined to bed for three full days.
a. The before-after differences in height measurements (in millimeters) for the six men were
12.6 14.4 14.7 14.5 15.2 13.5.
Assuming that the men in this study are representative of the population of all men, what is an estimate of the population mean increase In height after three full days in bed?
Answer:
Based on the given data, an estimate of the population mean increase in height after three full days in bed is 14.15 mm.
b. Calculate the margin of error associated with your estimate of the population mean from part (a). Round your answer to three decimal places.
Answer:
2\(\left(\frac{0.946}{\sqrt{6}}\right)\) ≈ 0.768
The margin of error is approximated by 0.768 mm.
c. Based on your sample mean and the margin of error from parts (a) and (b), what are plausible values for the population mean height increase for all men who stay in bed for three full days?
Answer:
14.15 mm – 0.768 mm = 13.382 mm and 14.15 mm + 0.768 mm = 14.918 mm
Plausible values for the population mean height increase for all men who stay in bed for three full days are those between 13.382 mm and 14.918 mm.
Eureka Math Algebra 2 Module 4 Lesson 21 Exit Ticket Answer Key
Question 1.
A Health Group study recommends that the total weight of a male student’s backpack should not be more than 15% of his body weight. For example, if a student weighs 170 pounds, his backpack should not weigh more than 25. 5 pounds. Suppose that ten randomly selected eleventh-grade boys produced the following data:
![]()
a. For each student, calculate backpack weight as a percentage of body weight (round to one decimal place).
Answer:
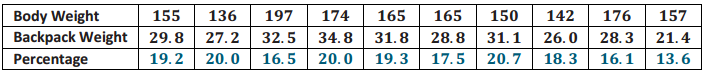
b. Based on the data in part (a), estimate the mean percentage of body weight that eleventh-grade boys carry in their backpacks.
Answer:
The sample mean percentage is 18.12 percentage points.
c. Find the margin of error for your estimate of part (b). Round your answer to three decimal places. Explain how you determined your answer.
Answer:
2\(\left(\frac{2.207}{\sqrt{10}}\right)\) ≈ 1.396
The standard deviation of the percentages Is 2.207 percent, so the margin of error is approximately 1.396 percentage points.
d. Comment on the amount of weight eleventh-grade boys at this school is carrying In their backpacks compared to the recommendation by the Health Group.
Answer:
18.12% – 1.396% = 16.724% and 18.12% + 1.396% = 19.516%
Based on the data in this study, plausible percentages of mean body weight percentage that eleventh graders are carrying in their backpacks are 16.724% to 19.516%. The interval (16.724%, 19.516%) is above the recommended 15% maximum. On average, eleventh-grade boys at this school are carrying too much weight in their backpacks.