Engage NY Eureka Math Algebra 2 Module 4 Lesson 24 Answer Key
Eureka Math Algebra 2 Module 4 Lesson 24 Exercise Answer Key
Exercises 1 – 17:
Twenty adult drivers were asked the following question:
“What speed is the fastest that you have driven ?”
The table below summarizes the fastest speeds driven in miles per hour (mph).
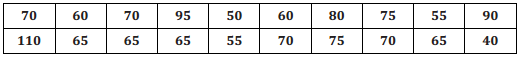
Exercise 1.
What is the mean fastest speed driven?
Answer:
69.25 mph
Exercise 2.
What is the range of fastest speed driven?
Answer:
70 mph
Exercise 3.
Imagine that the fastest speeds were randomly divided into two groups. How would the means and ranges compare to one another? To the means and ranges of the whole group? Explain your thinking.
Answer:
Answers will vary. Sample response: I think the mean of each group will be fairly close because most of the values appear to be between 60 and 80. I do not think the ranges of each group will be the same. Depending on the values in the group, one possible range could be as large as 70 mph (from 40 to 110) or as small as 10 mph (from 60 to 70).
I think the means of the two groups should be dose to the mean of the whole group, again because most values appear to be between 60 and 80. The range of the whole group is 70 mph, so the range of the two groups may be smaller than that.
Let’s investigate what happens when the fastest speeds driven are randomly divided into two equal-sized groups.
Exercise 4.
Following the instructions from your teacher, randomly divide the 20 values in the table above into two groups of 10 values each.
Answer:
Sample student responses; answers will vary. One example follows.
Exercise 5.
Do you expect the means of these two groups to be equal? Why or why not?
Answer:
The values of the means of the two groups will probably not be exactly equal, but I don’t expect them to be ves-y different.
Exercise 6.
Compute the means of these two groups. Write the means in the chart above.
Answer:
Group 1 mean: 67.5
Group2mean: 71
Exercise 7.
How do these two means compare to each other?
Answer:
The values of these two means are not very different from each other.
Exercise 8.
How do these two means compare to the mean fastest speed driven for the entire group (Exercise 1)?
Answer:
The values of these two means are close to the original mean. The value of one mean is larger than the original mean, and the value of the other mean is smaller than the original mean. (Note: The two group mean values are equidistant from the original mean value.)
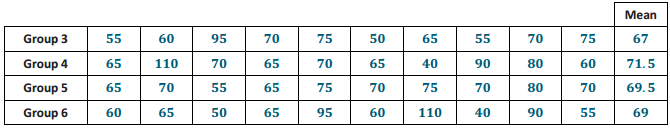
Exercise 9.
Use the instructions provided for Exerdse 4to repeat the random division process two more times. Compute the
mean of each group for each of the random divisions into two groups. Record your results in the table below.
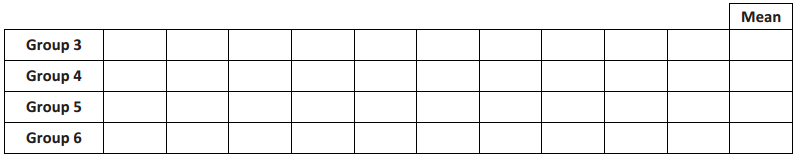
Answer:
Exercise 10.
Plot the means of all six groups on a class dot plot.
Answer:
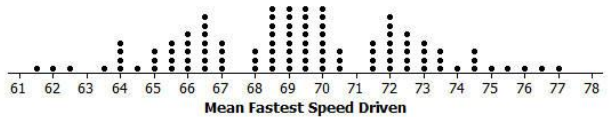
Exercise 11.
Based on the class dot plot, what can you say about the possible values of the group means?
Answer:
Answers will vary.
The group sample means are centered at the original mean of 69,25 mph.
There is variability in the group means. Some groups’ means vary more from the original mean of 69.25 than others. The group means that are closer to the original mean of 69.25 mph occur more often than the group means that are farther away from 69.25 mph.
Exercise 12.
What is the smallest possible value for a group mean? Largest possible value?
Answer:
Smallest possible mean (the 10 smallest values) = \(\frac{40+50+55+55+60+60+65+65+65+65}{10}\) = 58
Largest possible mean (the 10 largest values) = \(\frac{70+70+70+70+75+75+80+90+95+110}{10}\) = 80.5
The smallest possible mean is 58 mph, and the largest possible mean is 80.5 mph.
Exercise 13.
What is the largest possible range for the distribution of group means?
Answer:
80.5 mph – 58 mph = 22.5 mph
From Exercise 12, the largest possible range is 22.5 mph.
Exercise 14.
How does the largest possible range in the group means compare to the range of the original data set (Exercise 2)? Why is this so?
Answer:
The range of the original data is 70 mph. The largest possible range for the distribution of group means is 22.5 mph, which is much smaller. This difference is due to the use of means. The means of the two groups of 10 do not vary as much as the individual observations in the data set
Exercise 15.
What is the shape of the distribution of group means?
Answer:
It is symmetrical.
Exercise 16.
Will your answer to the above question always be true? Explain.
Answer:
Yes. When a single set of values is divided into two equal groups, the two group means will be equidistant from the single set’s mean. Thus, it will always produce a symmetrical distribution.
Exercise 17.
When a single set of values Is randomly divided into two equal groups, explain how the means of these two groups may be very different from each other and may be very different from the mean of the single set of values.
Answer:
It is possible that the random division could result in most of the smaller values being in one group and most of the larger values in the other group. This would produce group means that were very different from each other and from the single set’s mean. But with a random division, this is not very likely to occur.
Eureka Math Algebra 2 Module 4 Lesson 24 Problem Set Answer Key
In one high school, there are eight math classes during second period. The number of students In each second-period math class is recorded below.
32 27 26 23 25 22 30 19
This data set is randomly divided into two equal-sized groups, and the group means are computed.
Question 1.
Will the two group means be the same? Why or why not?
Answer:
No. The two group means tend to not be the same Just due to chance.
The random division into two groups process is repeated many times to create a distribution of group mean class size.
Question 2.
What is the center of the distribution of group mean class size?
Answer:
The distribution of the group mean class size is centered at the mean of the original set of 8 class sizes.
\(\frac{19+22+23+25+26+27+30+32}{8}\) = 25.5
The center of the distribution of group mean class size is 25.5.
Question 3.
What is the largest possible range of the distribution of group mean class size?
Answer:
The range of the distribution of mean class sizes would be the difference of the largest possible group mean and the smallest possible group mean.
Largest possible group mean: \(\frac{26+27+30+32}{4}\) = 28. 75
Smallest Possible group mean: \(\frac{19+22+23+25}{4}\) = 22.25
Largest possible group mean range: 28.75 – 22.25 = 6.5; the range is 6.5 students.
Question 4.
What possible values for the mean class size are more likely to happen than others? Explain why you chose these values.
Answer:
Below is a sample partial distribution of the group mean class sizes.
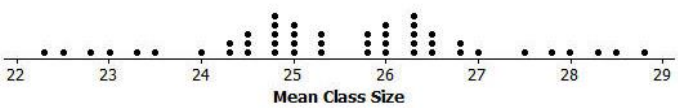
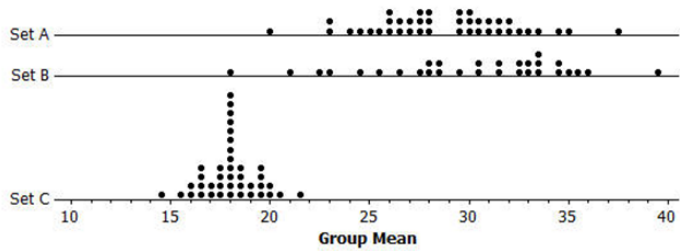
There are 3 different sets of numbers: Set A, Set B, and Set C. Each set contains 10 numbers. In two of the sets, the 10 numbers were randomly divided into two groups of 5 numbers each, and the mean for each group was calculated. These two means are plotted on a dot plot. This procedure was repeated many times, and the dot plots of the group means are shown below.
The third set did not use the above procedure to compute the means.
For each set, the smallest possible group mean and the largest possible group mean were calculated, and these two means are shown in the dot plots below.
Use the dot plots below to answer Problems 5 – 8.
Question 5.
Which set is not one of the two sets that were randomly divided into two groups of 5 numbers? Explain.
Answer:
Set B is not one of the two sets that were randomly divided into two subsets. When a set of numbers is divided into two equal groups, the resulting dot plot of group means will be symmetrical.
Question 6.
Estimate the mean of the original values in Set A. Show your work.
Answer:
Estimated mean of Set A: \(\frac{27+29.5}{2}\) = 28. 25
Question 7.
Estimate the range of the group means shown in the dot plot for Set C. Show your work.
Answer:
21.5 – 14.5 = 7
The estimated range of the distribution of sample means for Set C is 7.
Question 8.
Is the range of the original values in Set C smaller or larger than your answer in Problem 7? Explain.
Answer:
The range of Set C is larger than the range of the distribution of sample means from Set C. The range of the group means will always be smaller than the range of the original set of values.
Eureka Math Algebra 2 Module 4 Lesson 24 Exit Ticket Answer Key
Question 1.
When a single group is randomly divided into two groups, why do the two group means tend to be different?
Answer:
The two group means tend to be different because of random chance involved in the process of dividing the original group into two subgroups.