Engage NY Eureka Math Algebra 2 Module 4 Lesson 3 Answer Key
Eureka Math Algebra 2 Module 4 Lesson 3 Example Answer Key
Example 1:
Students at Rufus King High School were discussing some of the challenges of finding space for athletic teams to practice after school. Part of the problem, according to Kristin, is that female students are more likely to be involved in an after-school athletics program than male students. However, the athletic director assigns the available facilities as if male students are more likely to be involved. Before suggesting changes to the assignments, the students decided to investigate.
Suppose the following information is known about Rufus King High School: 40% of students are involved in one or more of the after-school athletics programs offered at the school. It is also known that 58% of the school’s students are female. The students decide to construct a hypothetical 1000 two-way table, like Table 1, to organize the data.
Table 1: Participation in After-School Athletics Programs (Yes or No) by Gender.
| Yes – Participate in After-School Athletics Programs | No – Do Not Participate in After-School Athletics Programs |
Total | |
| Female | Cell 1 | Cell 2 | Cell 3 |
| Male | Cell 4 | Cell 5 | Cell 6 |
| Total | Cell 7 | Cell 8 | Cell 9 |
Exercises 1 – 6: Organizing the Data
Exercise 1.
What cell in Table 1 represents a hypothetical group of 1,000 students at Rufus King High School?
Answer:
Cell 9
Exercise 2.
What cells in Table 1 can be filled based on the information given about the student population? Place these values in the appropriate cells of the table based on this information.
Answer:
Cells 3 and 7 can be can completed from the given information. See the completed table below.
Exercise 3.
Based only on the cells you completed in Exercise 2, which of the following probabilities can be calculated, and which cannot be calculated? Calculate the probability if it can be calculated. If it cannot be calculated, indicate why.
a. The probability that a randomly selected student is female
Answer:
Yes, this can be calculated. The probability is 0.58.
b. The probability that a randomly selected student participates in an after-school athletics program
Answer:
Yes, this can be calculated. The probability is 0.40.
c. The probability that a randomly selected student who does not participate in an after-school athletics program is male.
Answer:
No, this probability cannot be calculated. We need to know the value of cell 5 to calculate this probability.
d. The probability that a randomly selected male student participates in an after-school athletics program
Answer:
No, this probability cannot be calculated. We need to know the value of cell 4 to calculate this probability.
Exercise 4.
The athletic director indicated that 23.2% of the students at Rufus King are female and participate in after-school athletics programs. Based on this information, complete Table 1.
Answer:
| Yes – Participate in After-School Athletic Program | No – Do Not Participate in After-School Athletic Program | Total | |
| Female | 232 | 348 | 580 |
| Male | 168 | 252 | 420 |
| Total | 400 | 600 | 1,000 |
Exercise 5.
Consider the cells 1, 2, 4, and 5 of Table 1. Identify which of these cells represent students who are female or who participate in after-school athletics programs.
Answer:
Cells 1, 2, and 4
Exercise 6.
What cells of the two-way table represent students who are male and do not participate in after-school athletics programs?
Answer:
Cell 5
Example 2:
The completed hypothetical 1000 table organizes information in a way that makes it possible to answer various questions. For example, you can investigate whether female students are more likely to be involved in the after-school athletic programs.
Consider the following events:
→ Let A represent the event “a randomly selected student is female.”
→ Let “not A” represent “the complement of A.” The complement of A represents the event “a randomly selected student is not female,” which is equivalent to the event “a randomly selected student is male.”
→ Let B represent the event “a randomly selected student participates in an after-school athletics program.”
→ Let “not B” represent “the complement of B.” The complement of B represents the event “a randomly selected student does not participate in an after-school athletics program.”
→ Let “A or B” (described as A union B) represent the event “a randomly selected student is female or participates in an after-school athletics program.”
→ Let “A and B” (described as A intersect B) represent the event “a randomly selected student is female and participates in an after-school athletics program.”
Exercises 7 – 9:
Exercise 7.
Based on the descriptions above, describe the following events in words:
a. Not A or not B
Answer:
Male students or students not participating in an after-school athletics program.
b. A and not B
Answer:
Female students not participating in an after-school athletics program.
Exercise 8.
Based on the above descriptions and Table 1, determine the probability of each of the following events:
a. A
Answer:
\(\frac{580}{1000}\) = 0.58
b. B
Answer:
\(\frac{400}{1000}\) = 0.40
c. Not A
Answer:
\(\frac{420}{1000}\) = 0.42
d. Not B
Answer:
\(\frac{600}{1000}\) = 0.60
e. A or B
Answer:
\(\frac{(232+348+168)}{1000}=\frac{748}{1000}\) = 0.748
f. A and B
Answer:
\(\frac{232}{1000}\) = 0.232
Exercise 9.
Determine the following values:
a. The probability of A plus the probability of not A
Answer:
0.580 + 0.420 = 1.000
The sum is 1.
b. The probability of B plus the probability of not B
Answer:
0.400+0.600 = 1.000
The sum is 1.
c. What do you notice about the results of parts (a) and (b)? Explain.
Answer:
Both probabilities total 1. This makes sense since both parts are asking for the probability of A and not A or B and not B. The probabilities of an event and its complement always sum to 1.
Example 3: Conditional Probability
Another type of probability is called a conditional probability. Pulling apart the two-way table helps to define a conditional probability.
| Yes – Participate in After-School Athletics Program | No – Do Not Participate in After-School Athletics Program |
Total | |
| Female | Cell 1 | Cell 2 | Cell 3 |
Suppose that a randomly selected student is female. What is the probability that the selected student participates in an after-school athletics program? This probability is an example of what is called a conditional probability. This probability is calculated as the number of students who are female and participate in an after-school athletics program (or the students in cell 1) divided by the total number of female students (or the students in cell 3).
Exercises 10 – 15:
Exercise 10.
The following are also examples of conditional probabilities. Answer each question.
a. What is the probability that if a randomly selected student is female, she participates in the after-school athletic program?
Answer:
The probability that if a randomly selected student is female then she participates in the after-school athletic
program is the value in Cell I divided by the value in Cell 3.
\(\frac{232}{580}\) = 0.40
b. What is the probability that if a randomly selected student is female, she does not participate in after-school athletics?
Answer:
The probability that if a randomly selected student is female then she does not participate in the after-school athletic program is the value in Cell 2 divided by the value in Cell 3.
\(\frac{348}{580}\) = 0.60
Exercise 11.
Describe two conditional probabilities that can be determined from the following row in Table I.
| Yes – Participate in After-School Athletics Program | No – Do Not Participate in After-School Athletics Program |
Total | |
| Male | Cell 4 | Cell 5 | Cell 6 |
Answer:
The probability that if a randomly selected student is male, he participates in an after-school athletics program. The probability that if a randomly selected student is male, he does not participate in an after-school athletics
program.
Exercise 12.
Describe two conditional probabilities that can be determined from the following column in Table 1:
| Yes – Participate in After-School Athletics Program | |
| Female | Cell 1 |
| Male | Cell 4 |
| Total | Cell 7 |
Answer:
The probability that if a randomly selected student participates in an after-school athletics program, the student is female. The probability that if a randomly selected student participates in an after-school athletics program, the student is male.
Exercise 13.
Determine the following conditional probabilities:
a. A randomly selected student is female. What Is the probability she participates in an after-school athletics program? Explain how you determined your answer.
Answer:
\(\frac{232}{580}\) = 0.40
Since it is known that the selected student is female, I looked at the row for female students and used that information.
b. A randomly selected student is male. What is the probability he participates in an after-school athletics program?
Answer:
\(\frac{168}{420}\) = 0.40
c. A student is selected at random. What is the probability this student participates in an after-school athletics program?
Answer:
\(\frac{400}{1000}\) = 0.40
Exercise 14.
Based on the answers to Exercise 13, do you think that female student are more likely to be involved in after-school athletics programs? Explain your answer.
Answer:
No, the conditional probabilities indicate male and female students are equally likely to be involved in an after-school athletics program.
Exercise 15.
What might explain the concern female students expressed at the beginning of this lesson about the problem of assigning practice space?
Answer:
It is interesting that at this school, the probability that a randomly selected student is female is 0.58. There are more female students than male students at this school. As a result, if facilities are assigned equally (Given that both female and male students were found to be equally likely to be involved), the number of female students involved in after-school athletics programs is greater than the number of male students and might explain the concern regarding facilities.
Eureka Math Algebra 2 Module 4 Lesson 3 Problem Set Answer Key
Oostburg College has a rather large marching band. Engineering majors were heard bragging that students majoring in engineering are more likely to be involved in the marching band than students from other majors.
Question 1.
If the above claim is accurate, does that mean that most of the band is engineering students? Explain your answer.
Answer:
No. It means that if a randomly selected student is an engineering major, the probability this person is in the marching band is greater than if this person was not an engineering major.
Question 2.
The following graph was prepared to investigate the above claim:
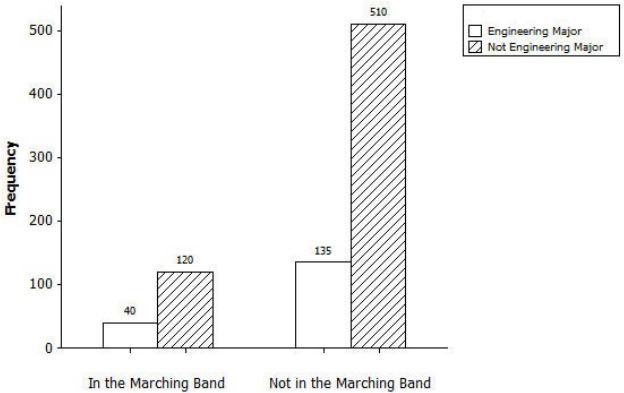
Based on the graph, complete the following two-way frequency table:
| In the Marching Band | Not in the Marching Band | Total | |
| Engineering Major | |||
| Not Engineering Major | |||
| Total |
Answer:
| In the Marching Band | Not in the Marching Band | Total | |
| Engineering Major | 40 | 135 | 175 |
| Not Engineering Major | 120 | 510 | 630 |
| Total | 160 | 645 | 805 |
Question 3.
Let M represent the event that a randomly selected student is in the marching band. Let E represent the event that a randomly selected student is an engineering major.
a. Describe the event represented by the complement of M.
Answer:
A randomly selected student is not in the marching band.
b. Describe the event represented by the complement of E.
Answer:
A randomly selected student is not majoring in engineering.
c. Describe the event M and E (M intersect E).
Answer:
A randomly selected student is majoring in engineering and is in the marching band.
d. Describe the event M or E (M union E).
Answer:
A randomly selected student is majoring in engineering or is in the marching band.
Question 4.
Based on the completed two-way frequency table, determine the following, and explain how you got your answer:
a. The probability that a randomly selected student is in the marching band
Answer:
\(\frac{160}{805}\) ≈ 0. 199
I compared the number of students in the marching band to the total number of students.
b. The probability that a randomly selected student Is an engineering major
Answer:
\(\frac{175}{805}\) ≈ 0.217
I compared the number of engineering majors to the total number of students.
c. The probability that a randomly selected student is in the marching band and an engineering major
Answer:
\(\frac{40}{805}\) ≈ 0.05
I found the number of students who are in the band and are engineering majors and compared it to the total number of students.
d. The probability that a randomly selected student is in the marching band and not an engineering major
Answer:
\(\frac{120}{805}\) ≈ 0.149
I found the number of students who are in the band and are NOT engineering majors and compared it to the total number of students.
Question 5.
Indicate if the following conditional probabilities would be calculated using the rows or the columns of the two-way frequency table:
a. A randomly selected student is majoring in engineering. What is the probability this student is in the marching band?
Answer:
This probability is based on the row Engineering Major.
b. A randomly selected student is not in the marching band. What is the probability that this student is majoring in engineering?
Answer:
This probability is based on the column not in the Marching Band.
Question 6.
Based on the two-way frequency table, determine the following conditional probabilities:
a. A randomly selected student is majoring in engineering. What is the probability that this student is in the marching band?
Answer:
\(\frac{40}{175}\) ≈ 0.229
b. A randomly selected student is not majoring in engineering. What is the probability that this student is in the
marching band?
Answer:
\(\frac{120}{630}\) ≈ 0. 190
Question 7.
The claim that started this investigation was that students majoring in engineering are more likely to be in the marching band than students from other majors. Describe the conditional probabilities that would be used to determine if this claim is accurate.
Answer:
Given a randomly selected student is an engineering major, what is the probability the student is in the marching band. Also, given a randomly selected student is not an engineering major, what is the probability the student is in the marching band.
Question 8.
Based on the two-way frequency table, calculate the conditional probabilities identified in Problem 7.
Answer:
The probabilities were calculated in Problem 6. Approximately 0.229 (or 22.9%) of the engineering students are in the marching band. Approximately 0. 190 (or 19.0%) of the students not majoring in engineering are in the marching band.
Question 9.
Do you think the claim that students majoring in engineering are more likely to be in the marching band than students for other majors is accurate? Explain your answer.
Answer:
The claim is accurate based on conditional probabilities.
Question 10.
There are 40 students at Oostburg College majoring in computer science. Computer science is not considered an engineering major. Calculate an estimate of the number of computer science majors you think are in the marching band. Explain how you calculated your estimate.
Answer:
The probability that a randomly selected student who is not majoring in engineering is in the marching band is 0. 190. As a result, you would estimate that 19% of the 40 computer science majors are in the marching band. Since 40(0.190) = 7.6. I would expect that 7 or 8 computer science majors are in the marching band.
Eureka Math Algebra 2 Module 4 Lesson 3 Exit Ticket Answer Key
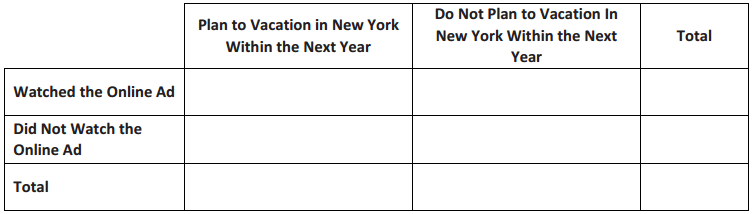
A state nonprofit organization wanted to encourage its members to consider the State of New York as a vacation destination. They are investigating whether their online ad campaign influenced its members to plan a vacation in New York within the next year. The organization surveyed its members and found 75% of them have seen the online ad. 40% of its members indicated they are planning to vacation in New York within the next year, and 15% of its members did not see the ad and do not plan to vacation in New York within the next year.
Question 1.
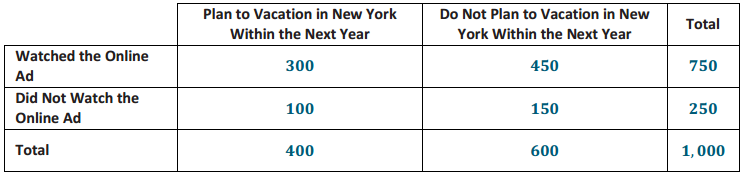
Complete the following hypothetical 1000 two-way frequency table:
Answer:
Question 2.
Based on the two-way table, describe two conditional probabilities you could calculate to help decide if members who saw the online ad are more likely to plan a vacation in New York within the next year than those who did not see the ad.
Answer:
The probability that a randomly selected member who watched the ad is planning to vacation in New York. The probability that a randomly selected member who did not watch the ad is planning to vacation in New York.
Question 3.
Calculate the probabilities you described in Problem 2.
Answer:
The probability that a member who watched the ad is planning a vacation in New York: \(\frac{300}{750}\) = 0.400
The probability that a member who did not watch the ad is planning a vacation in New York: \(\frac{100}{250}\) = 0.400.
Question 4.
Based on the probabilities calculated in Problem 3, do you think the ad campaign is effective in encouraging people to vacation in New York? Explain your answer.
Answer:
The conditional probabilities are the same. It does not appear that the ad campaign is encouraging people to vacation in New York.