Engage NY Eureka Math Algebra 2 Module 4 Lesson 5 Answer Key
Eureka Math Algebra 2 Module 4 Lesson 5 Example Answer Key
Example 1:
Shading Regions of a Venn Diagram
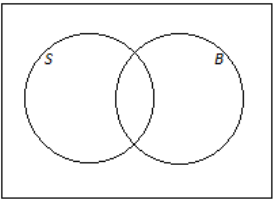
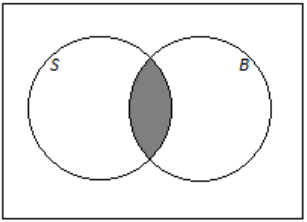
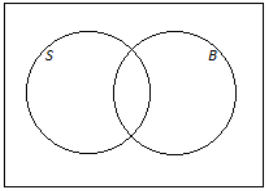
At a high school, some students play soccer, and some do not. Also, some students play basketball, and some do not. This scenario can be represented by a Venn diagram, as shown below. The circle labeled S represents the students who play soccer, the circle labeled B represents the students who play basketball, and the rectangle represents all the students at the school.
On the Venn diagrams provided, shade the region representing the following instances:
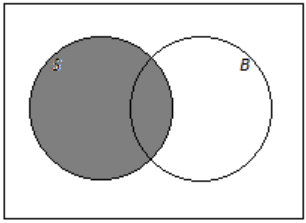
a. The students who play soccer
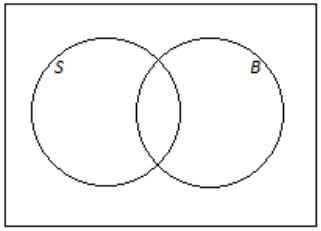
Answer:
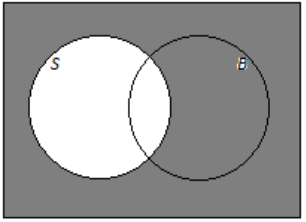
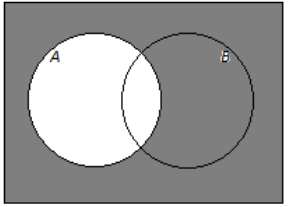
b. The students who do not play soccer
Answer:
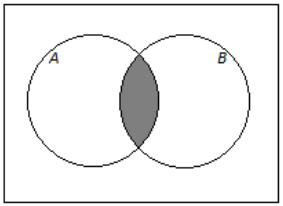
c. The students who play soccer and volley ball
Answer:
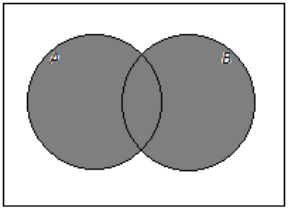
d. The students who play soccer or volley ball
Answer:
Exercise 1:
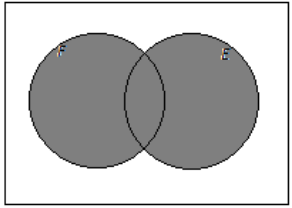
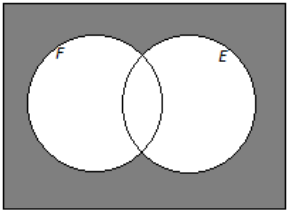
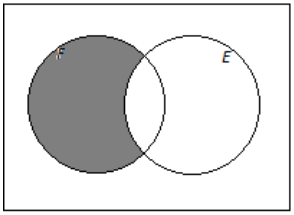
An online bookstore offers a large selection of books. Some of the books are works of fiction, and some are not. Also, some of the books are available as e-books, and some are not. Let F be the set of books that are works of fiction, and let E be the set of books that are available as e-books. On the Venn diagrams provided, shade the regions representing the following instances:
a. Books that are available as e-books

Answer:

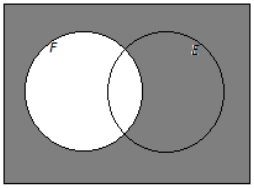
b. Books that are not works of fiction
Answer:
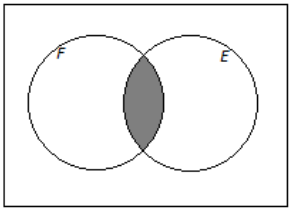
c. Books that are works of fiction and available as e-books
Answer:
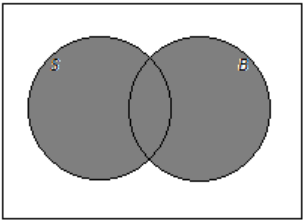
d. Book as that are works of fiction or available as e-books
Answer:
e. Books that are neither works of fiction nor available as e-books
Answer:
f. Books that are works of fiction that are not available as e-books
Answer:
Example 2:
Showing Numbers of Possible Outcomes (and Probabilities) in a Venn Diagram
Think again about the school introduced in Example 1. Suppose that 230 students play soccer, 190 students play basketball, and 60 students play both sports. There are a total of 500 students at the school.
a. Complete the Venn diagram below by writing the numbers of students in the various regions of the diagram.
Answer:
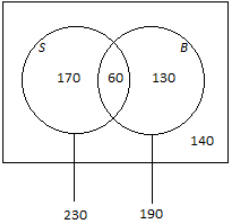
b. How many students play basketball but not soccer?
Answer:
190 – 60 = 130
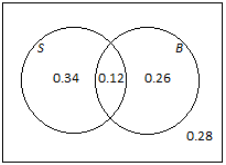
c. Suppose that a student will be selected at random from the school.
i. What is the probability that the selected student plays both sports?
Answer:
\(\frac{60}{500}\) = 0.12
ii. Complete the Venn diagram below by writing the probabilities associated with the various regions of the diagram.
Answer:
Example 3:
Adding and Subtracting Probabilities
Think again about the online bookstore introduced in Exercise 1, and suppose that 62% of the books are works of fiction, 47% are available as e-books, and 14% are available as e-books but are not works of fiction. A book will be selected at random.
a. Using a Venn diagram, find the following probabilities:
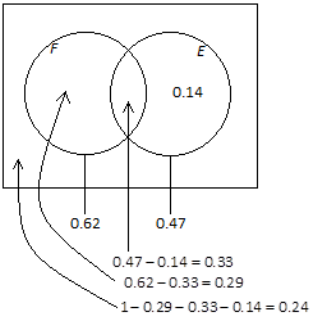
i. The book is a work of fiction and available as an e-book.
Answer:
P(F and E) = 0.33
ii. The book is neither a work of fiction nor available as an e-book.
Answer:
P(neither F nor E) = 0.24
b. Return to the information given at the beginning of the question: 62% of the books are works of fiction, 47% are available as e-books, and 14% are available as e-books but are not works of fiction.
i. How would this information be shown in a hypothetical 1000 table? (Show your answers in the table provided below.)
| Fiction | Not Fiction | Total | |
| Available as E-Book | |||
| Not Available as E-Book | |||
| Total | 1,000 |
Answer:
| Fiction | Not Fiction | Total | |
| Available as E-Book | 330 | 140 | 470 |
| Not Available as E-Book | 290 | 240 | 530 |
| Total | 620 | 380 | 1,000 |
ii. Complete the hypothetical 1000 table given above.
Answer:
| Fiction | Not Fiction | Total | |
| Available as E-Book | 330 | 140 | 470 |
| Not Available as E-Book | 290 | 240 | 530 |
| Total | 62 | 380 | 1,000 |
iii. Complete the table below showing the probabilities of the events represented by the cells in the table.
| Fiction | Not Fiction | Total | |
| Available as E-Book | |||
| Not Available as E-Book | |||
| Total |
Answer:
| Fiction | Not Fiction | Total | |
| Available as E-Book | 0.33 | 0.14 | 0.47 |
| Not Available as E-Book | 0.29 | 0.24 | 0.536 |
| Total | 0.62 | 0.38 | 1 |
iv. How do the probabilities in your table relate to the probabilities you calculated in part (a)?
Answer:
The probabilities are the same.
Exercise 2:
When a fish is selected at random from a tank, the probability that it has a green tail is 0.64, the probability that it has red fins is 0.25, and the probability that it has both a green tail and red fins is 0.19.
a. Draw a Venn diagram to represent this information.
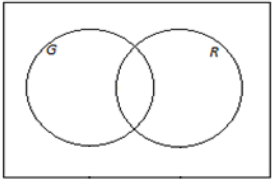
Answer:
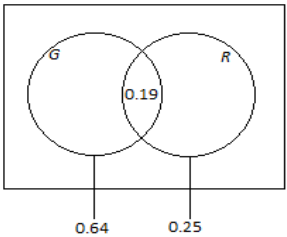
b. Find the following probabilities:
i. The fish has red fins but does not have a green tail.
Answer:
0.25 – 0.19 = 0.06
ii. The fish has a green tail but not red fins.
Answer:
0.64 – 0.19 = 0.45
iii. The fish has neither a green tail nor red fins.
Answer:
1 – 0.45 – 0.19 – 0.06 = 0.30
c. Complete the table below showing the probabilities of the events corresponding to the cells of the table.
| Green Tail | Not Green Tail | Total | |
| Red Fins | |||
| Not Red Fins | |||
| Total |
Answer:
| Green Tail | Not Green Tail | Total | |
| Red Fins | 0.19 | 0.06 | 0.25 |
| Not Red Fins | 0.45 | 0.30 | 0.75 |
| Total | 0.64 | 0.36 | 1.00 |
Exercise 3:
In a company, 43% of the employees have access to a fax machine, 38% have access to a fax machine and a scanner, and 24% have access to neither a fax machine nor a scanner. Suppose that an employee will be selected at random.
Using a Venn diagram, calculate the probability that the randomly selected employee will not have access to a scanner. (Note that Venn diagrams and probabilities use decimals or fractions, not percentages.) Explain how you used the Venn diagram to determine your answer.
Answer:
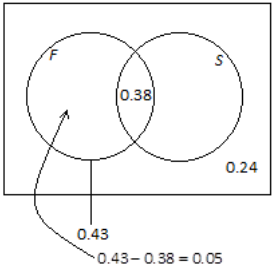
P(not S) = 0.05 +0.24 = 0.29
I can see from the Venn diagram that 5% of the employees have access to a fax machine but not a scanner, and 24% do not have access to either. So, I combined the two to find the probability that a randomly selected employee will not have access to a scanner.
Eureka Math Algebra 2 Module 4 Lesson 5 Problem Set Answer Key
Question 1.
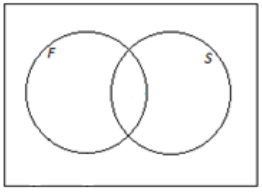
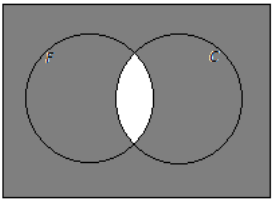
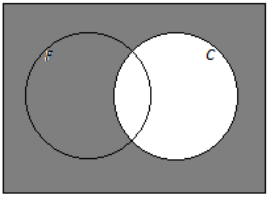
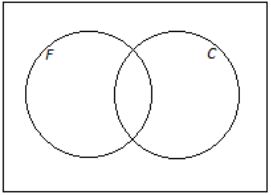
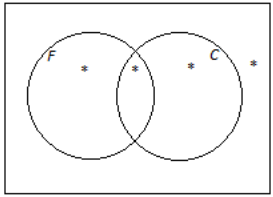
On a flight, some of the passengers have frequent-flier status, and some do not. Also, some of the passengers have checked baggage, and some do not. Let the set of passengers who have frequent-flier status be F and the set of passengers who have checked baggage be C. On the Venn diagrams provided, shade the regions representing the following instances:
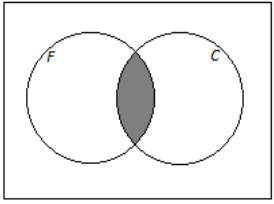
a. Passengers who have frequent-flier status and have checked baggage
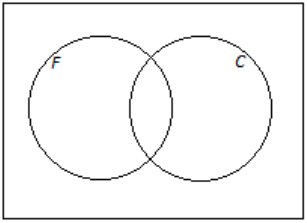
Answer:
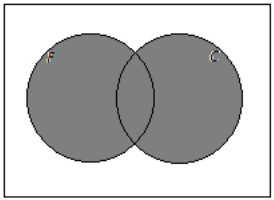
b. Passengers who have frequent-flier status or have checked baggage
Answer:
c. Passengers who do not have frequent-flier status and checked baggage
Answer:
d. Passengers who have frequent-flier status or do not have checked baggage
Answer:
Question 2.
For the scenario introduced in Problem 1, suppose that, of the 400 people on the flight, 368 have checked baggage, 228 have checked baggage but do not have frequent-flier status, and 8 have neither frequent-flier status nor checked baggage.
a. Using a Venn diagram, calculate the following:
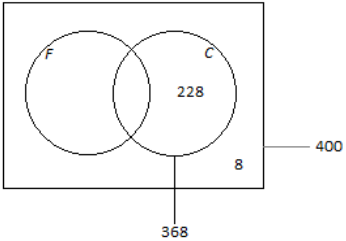
i. The number of people on the flight who have frequent-flier status and have checked baggage
Answer:
Number of passengers with frequent-flier status and checked baggage:
368 – 228 = 140
ii. The number of people on the flight who have frequent-flier status.
Answer:
Number of passengers with frequent-flier status:
400 – 8 – 228 = 164
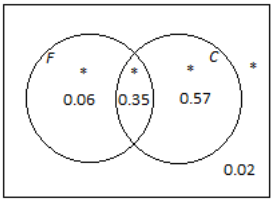
b. In the Venn diagram provided below, write the probabilities of the events associated with the regions marked with a star (*).
Answer:
Question 3.
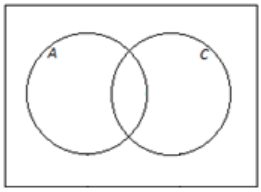
When an animal is selected at random from those at a zoo, the probability that it is North American (meaning that its natural habitat is in the North American continent) is 0. 65, the probability that it is both North American and a carnivore is 0. 16, and the probability that it is neither American nor a carnivore is 0.17.
a. Using a Venn diagram, calculate the probability that a randomly selected animal is a carnivore.
Answer:
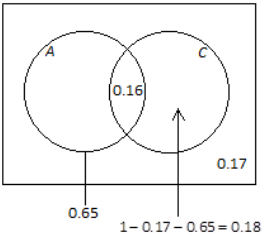
P(C) = 0.16 + 0.8 = 0.34
b. Complete the table below showing the probabilities of the events corresponding to the cells of the table.
| North American | Not North American | Total | |
| Carnivore | |||
| Not Carnivore | |||
| Total |
Answer:
| North American | Not North American | Total | |
| Carnivore | 0.16 | 0.18 | 0.34 |
| Not Carnivore | 0.49 | 0.17 | 0.66 |
| Total | 0.65 | 0.335 | 1.00 |
Question 4.
This question introduces the mathematical symbols for and, or, and not.
Considering all the people in the world, let A be the set of Americans (citizens of the United States), and let B be the set of people who have brothers.
→ The set of people who are Americans and have brothers is represented by the shaded region in the Venn diagram below.
→ This set is written A ∩ B (read A intersect B), and the probability that a randomly selected person is American and has a brother is written P(A ∩ B).
→ The set of people who are Americans or have brothers is represented by the shaded region in the Venn diagram below.
→ This set is written A U B (read A union B), and the probability that a randomly selected person is American or has a brother is written P(A U B).
→ The set of people who are not Americans is represented by the shaded region in the Venn diagram below.
This set is written Ac (read A complement), and the probability that a randomly selected person is not American is written P(Ac)
Now, think about the cars available at a dealership. Suppose a car is selected at random from the cars at this dealership. Let the event that the car has manual transmission be denoted by M, and let the event that the car is a sedan be denoted by S. The Venn diagram below shows the probabilities associated with four of the regions of the diagram.
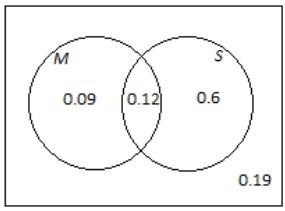
a. What is the value of P(M ∩ S)?
Answer:
0.12
b. Complete this sentence using and or or:
P(M ∩ S) is the probability that a randomly selected car has a manual transmission ____ is a sedan.
Answer:
and
c. What is the value of P(M U S)?
Answer:
0.09 + 0.12 + 0.60 = 0.81
d. Complete this sentence using and or or:
P(M US) is the probability that a randomly selected car has a manual transmission ___ is a sedan.
Answer:
or
e. What is the value of P(Sc)?
Answer:
1 – (0.6 + 0.12) = 0.28
f. Explain the meaning of P(Sc).
Answer:
P(Sc) is the probability that a randomly selected car is not a sedan.
Eureka Math Algebra 2 Module 4 Lesson 5 Exit Ticket Answer Key
Question 1.
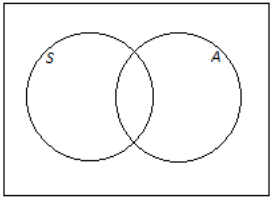
At a high school, some students take Spanish, and some do not. Also, some students take an arts subject, and some do not. Let S be the set of students who take Spanish and A be the set of students who take an arts subject. On the Venn diagrams given, shade the region representing the following instances:
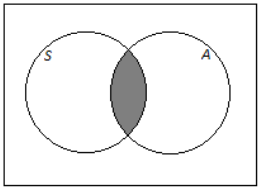
a. Students who take Spanish and an arts subject
Answer:
b. Students who take Spanish or an arts subject
Answer:

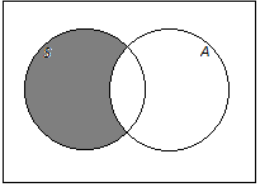
c. Students who take Spanish but do not take an arts subject
Answer:
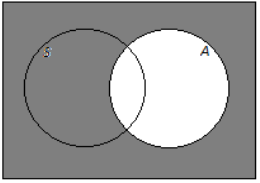
d. Students who do not take an arts subject
Answer:
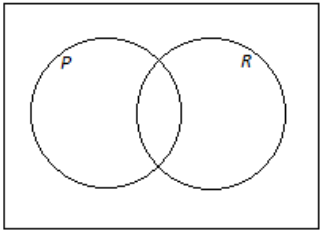
Question 2.
When a player is selected at random from a high school boys baseball team, the probability that he is a pitcher is 0. 35, the probability that he is right-handed is 0. 79, and the probability that he is a right-handed pitcher is 0.26. Let P be the event that a player is a pitcher, and let R be the event that a player is right-handed. A Venn diagram is provided below.
Answer:
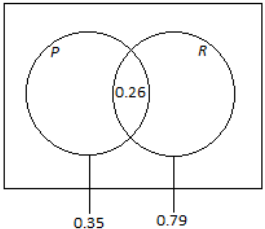
Use the Venn diagram to calculate the probability that a randomly selected player is each of the following. Explain how you used the Venn diagram to determine your answer.
a. Right-handed but not a pitcher
Answer:
0.79 – 0.26 = 0.53
I found the probability that the player was right-handed (0.79) and subtracted the probability that the player was also a pitcher (0.26).
b. A pitcher but not right-handed
Answer:
0.35 – 0.26 = 0.09
I found the probability that the player was a pitcher (0.35) and subtracted the probability that the player was also right-handed (0.26).
c. Neither right-handed nor a pitcher
Answer:
1 – 0.09 – 0.26 – 0.53 = 0.12
I used the Venn diagram to determine all of the probabilities associated with the player being right-handed and/or a pitcher. Then, I subtracted each from 1 to find the probability that the player was not either.