Engage NY Eureka Math Algebra 2 Module 4 Lesson 8 Answer Key
Eureka Math Algebra 2 Module 4 Lesson 8 Example Answer Key
Example 1: Center, Shape, and Spread
Have you ever noticed how sometimes batteries seem to last a long time, and other times the batteries seem to last only a short time?
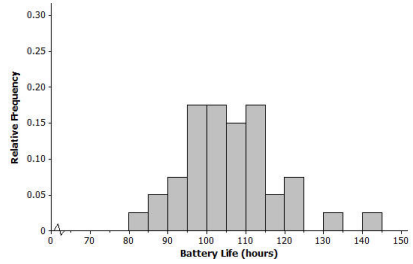
The histogram below shows the distribution of battery life (hours) for a sample of 40 batteries of the same brand. When studying a distribution, it is important to think about the shape, center, and spread of the data.
Exercises 1 – 9:
Exercise 1.
Would you describe the distribution of battery life as approximately syrnmetric or as skewed? Explain your answer.
Answer:
The distribution is approximately symmetric. The right and left halves of the distribution are similar.
Exercise 2.
Is the mean of the battery life distribution closer to 95, 105, or 115 hours? Explain your answer.
Answer:
The mean of the battery life distribution is closer to 105 hours because the data appear to center around 105.
Exercise 3.
Consider 5, 10, or 25 hours as an estimate of the standard deviation to the battery life distribution.
a. Consider 5 hours as an estimate of the standard deviation. Is it a reasonable description of a typical distance from the mean? Explain your answer.
Answer:
Most of the distances from the mean are greater than 5 hours. it is not a good estimate of the standard deviation.
b. Consider 10 hours as an estimate of the standard deviation, Is it a reasonable description of a typical distance from the mean? Explain your answer.
Answer:
It looks like 10 is a reasonable estimate of a typical distance from the mean. It is a reasonable estimate of the standard deviation.
c. Consider 25 hours as an estimate of the standard deviation. Is it a reasonable description of a typical distance from the mean? Explain your answer.
Answer:
Nearly all of the data values are less than 25 hours from the mean of 105. It is not a good estimate of the standard deviation.
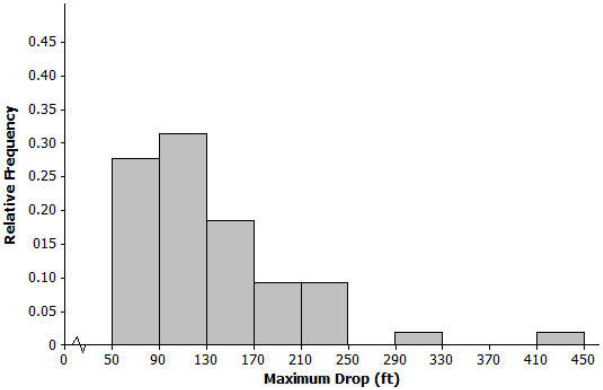
The histogram below shows the distribution of the greatest drop (in feet) for 55 major roller coasters in the United States.
Exercise 4.
Would you describe this distribution of roller coaster maximum drop as approximately symmetric or as skewed? Explain your answer.
Answer:
The distribution is skewed to the right because there is a long tail on the right side.
Exercise 5.
Is the mean of the maximum drop distribution closer to 90, 135, or 240 feet? Explain your answer.
Answer:
The mean is closer to 135 feet because 90 is too small and 240 is too large to be considered a typical value for this data set.
Exercise 6.
Is the standard deviation of the maximum drop distribution closer to 40, 70, or 100 hours? Explain your answer.
Answer:
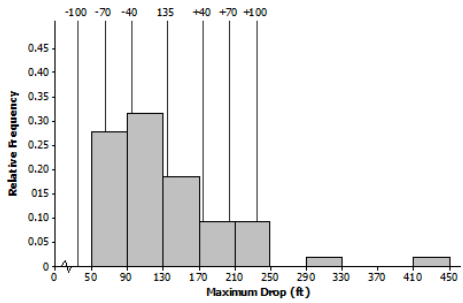
It seems that 70 is about right for a typical distance from the mean. A deviation of 40 would be too small, and 100 would be too large to be considered a typical distance from the mean for this data set. Most of the data values differ from the estimated mean of 135 by more than 40, which means that 40 is not a reasonable estimate of the standard deviation.
Most of the data values differ from the estimated mean of 135 by less than 100, which means that 100 is not a reasonable estimate of the standard deviation. This can be illustrated for students using the following picture:
Exercise 7.
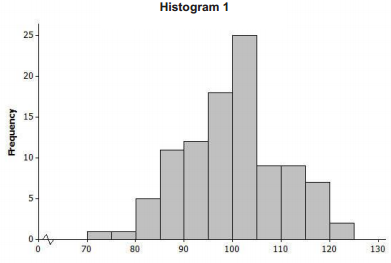
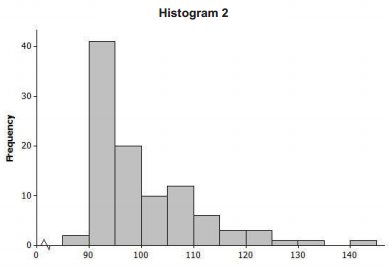
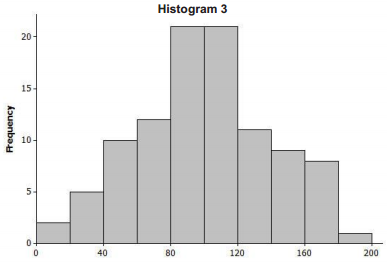
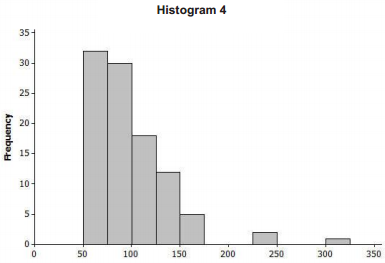
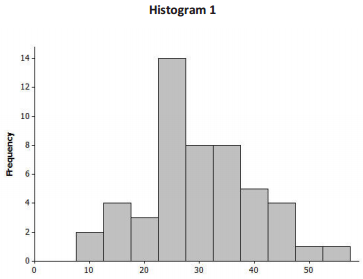
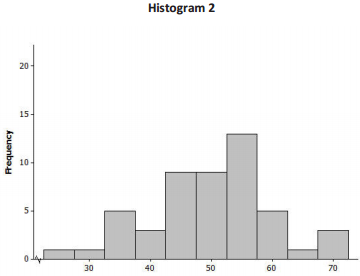
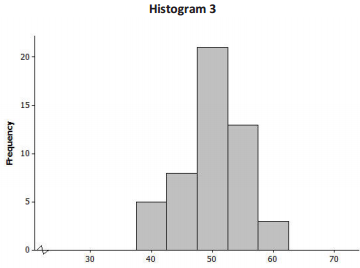
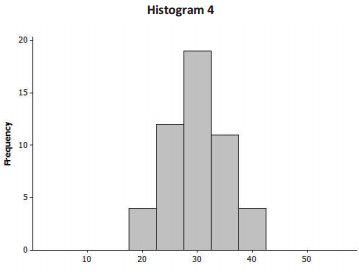
Consider the following histograms: Histogram 1, Histogram 2, Histogram 3, and Histogram 4. Descriptions of our distributions are also given. Match the description of the distribution with the appropriate histogram.
| Histogram | Distribution |
| 1 | |
| 2 | |
| 3 | |
| 4 |
Description of distributions:
| Distribution | Shape | Mean | Standard Deviatioin |
| A | Skewed to the right | 100 | 10 |
| B | Approximately symmetric, mound shaped | 100 | 10 |
| C | Approximately symmetric, mound shaped | 100 | 40 |
| D | Skewed to the right | 100 | 40 |
Histograms:
Answer:
| Histogram | Distribution |
| 1 | B |
| 2 | A |
| 3 | C |
| 4 | D |
Exercise 8.
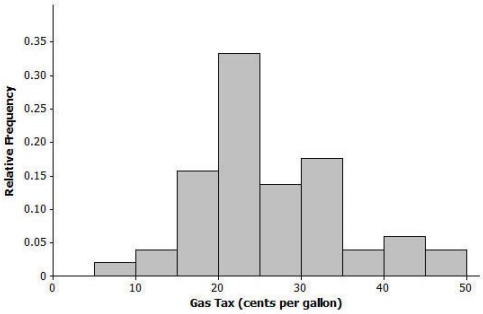
The histogram below shows the distribution of gasoline tax per gallon for the 50 states and the District of Columbia in 2010. Describe the shape, center, and spread of this distribution.
Answer:
The distribution shape is skewed to the right. Answers for center and spread will vary, but the center is approximately 25, and the standard deviation is approximately 10.
Exercise 9.
The histogram below shows the distribution of the number of automobile accidents per year for every 1,000 people in different occupations. Describe the shape, center, and spread of this distribution.
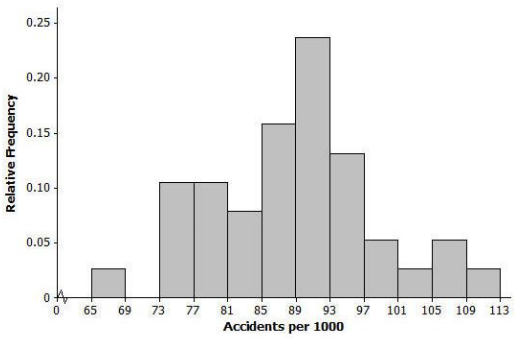
Answer:
The shape of the distribution is approximately symmetric. Answers for center and spread will vary, but the center is approximately 89, and the standard deviation is approximately 10.
Eureka Math Algebra 2 Module 4 Lesson 8 Problem Set Answer Key
Question 1.
For each of the following histograms, describe the shape, and give estimates of the mean and standard deviation of the distributions:
a. Distribution of head circumferences (mm)
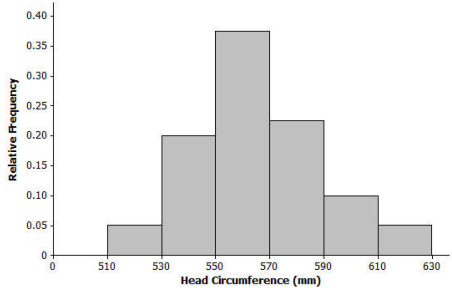
Answer:
Shape: Approximately symmetric and mound-shaped
Mean: Approximately 560
Standard Deviation: Approximately 25
b. Distribution of NBA arena seating capacity
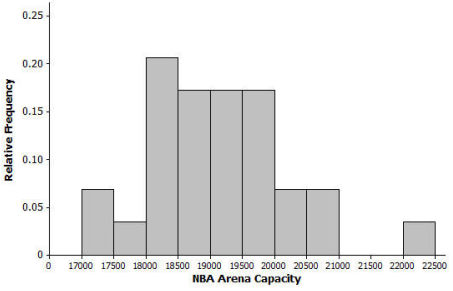
Answer:
Shape: Approximately symmetric
Center: Approximately 19,000
Spread: The standard deviation is approximately 1,000
Question 2.
For each of the following, match the description of each distribution with the appropriate histogram:
| Histogram | Distribution |
| 1 | |
| 2 | |
| 3 | |
| 4 |
Answer:
| Histogram | Distribution |
| 1 | C |
| 2 | B |
| 3 | A |
| 4 | D |
Description of distributions:
| Distribution | Shape | Mean |
Standard Deviation |
|
A |
Approximately symmetric, mound-shaped | 50 |
5 |
|
B |
Approximately symmetric, mound-shaped | 50 |
10 |
|
C |
Approximately symmetric, mound-shaped | 30 |
10 |
|
D |
Approximately symmetric, mound-shaped | 30 |
5 |
Question 3.
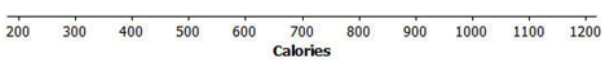
Following are the number of calories ¡n a basic hamburger (one meat patty with no cheese) at various fast food restaurants around the country:
380, 790, 680, 460, 725, 1130, 240, 260, 930, 331, 710, 680, 1080, 612, 1180, 400, 866, 700, 1060, 270, 550, 380, 940, 280, 940, 550, 549, 937, 820, 870, 250, 740
a. Draw a dot plot on the scale below.
Answer:
Completed dot plot:
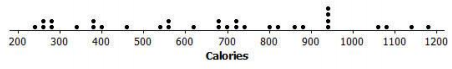
b. Describe the shape of the calorie distribution.
Answer:
Approximately symmetric
c. Using technology, find the mean and standard deviation of the calorie data.
Answer:
Mean: 665
Standard deviation: 283
d. Why do you think there is a lot of variability in the calorie data?
Answer:
Answers will vary. Possible answers include that the size (number of ounces) of the hamburger patty may be different, the type of bun may vary, and burgers may have different types and amounts of various condiments.
Eureka Math Algebra 2 Module 4 Lesson 8 Exit Ticket Answer Key
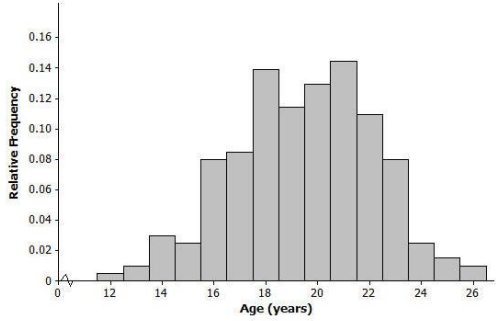
A local utility company wanted to gather data on the age of air conditioners that people have in their homes. The company took a random sample of 200 residents of a large city and asked if the residents had an air conditioner, and if they did, how old it was. Below is the distribution in the reported ages of the air conditioners.
Question 1.
Would you describe this distribution of air conditioner ages as approximately symmetric or as skewed? Explain your answer.
Answer:
The distribution is approximately symmetric. The left and right sides of the distribution are similar. This distribution would also be described as mound-shaped.
Question 2.
Is the mean of the age distribution closer to 15, 20, or 25 years? Explain your answer.
Answer:
The mean of the age distribution is closer to 20 years because the distribution ¡s centered at about 20.
Question 3.
Is the standard deviation of the age distribution closer to 3, 6, or 9 years? Explain your answer.
Answer:
A reasonable estimate of an average distance from the mean would be 3, so the standard deviation of the age distribution would be about 3.