Engage NY Eureka Math 6th Grade Module 1 Lesson 10 Answer Key
Eureka Math Grade 6 Module 1 Lesson 10 Exploratory Challenge Answer Key
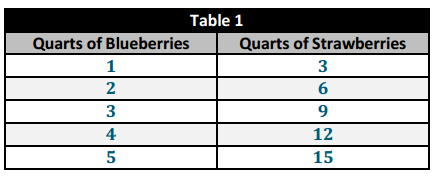
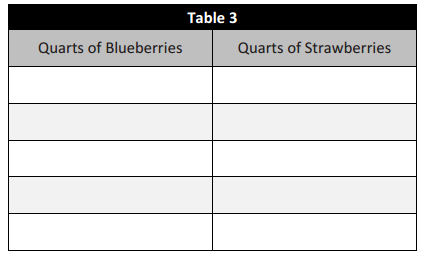
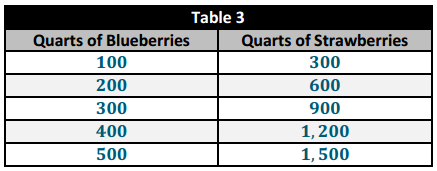
Imagine that you are making a fruit salad. For every quart of blueberries you add, you would like to put in 10 quarts of strawberries. Create three ratio tables that show the amounts of blueberries and strawberries you would use If you needed to make fruit salad for greater numbers of people.
Table 1 should contain amounts where you have added fewer than 10 quarts of blueberries to the salad.
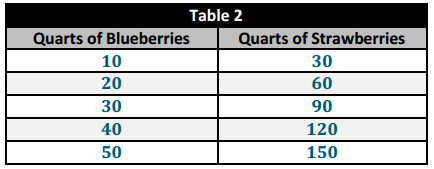
Table 2 should contain amounts of blueberries between and including 10 and 50 quarts.
Table 10 should contain amounts of blueberries greater than or equal to 100 quarts.
Answer:
Student answers may vary. Here are possible solutions:
Answer:
Answer:
Answer:
The answers to the questions will depend on the variation of the table that students have created.
a. Describe any patterns you see in the tables. Be specific in your descriptions.
Answer:
The value in the second column is always three times as much as the corresponding value in the first column. In the first table, the entries in the first column increase by 1, and the entries in the second column increase by 3. In the second table, the entries in the first column increase by 10, and the entries in the second column increase by 30. In the third table, the entries in the first column increase by 100, and the entries in the second column increase by 300.
b. How are the amounts of blueberries and strawberries related to each other?
Answer:
The amount of strawberries is always three times the amount of blueberries. Students could also respond that the ratio of the number of quarts of blueberries to the number of quarts of strawberries is always equivalent to 1:3.
c. How are the values in the Blueberries column related to each other?
Answer:
Answers will vary. However, students could use the chart paper and write on the table to see the patterns. Most tables should have addition repeating throughout.
d. How are the values in the Strawberries column related to each other?
Answer:
Answers will vary. However, students could use the chart paper and write on the table to see the patterns. Most tables should have addition repeating throughout.
e. If we know we want to add 7 quarts of blueberries to the fruit salad in Table 1, how can we use the table to help us determine how many strawberries to add?
Answer:
We could extend our table until we get to 7 in the blueberry column.
f. If we know we used 70 quarts of blueberries to make our salad, how can we use a ratio table to find out how many quarts of strawberries were used?
Answer:
We could start with the ratio 1: 3 that was given in the description and then multiply by ten to get 10 and 30. These would be the first values in our table. Then, we would count up by tens in the Blueberries column and count up by 30’s in the Strawberries column.
Eureka Math Grade 6 Module 1 Lesson 10 Exercise Answer Key
Exercise 1.
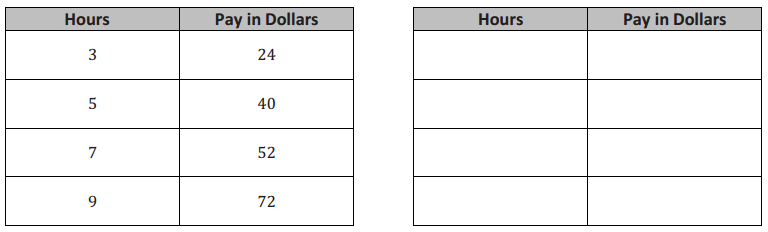
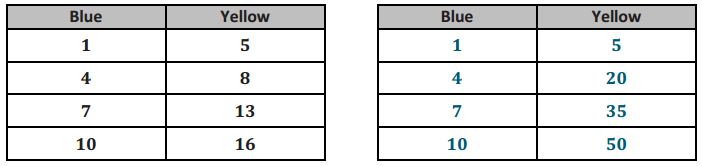
The following tables were made incorrectly. Find the mistakes that were made, create the correct ratio table, and state the ratio that was used to make the correct ratio table.
a.
Answer:
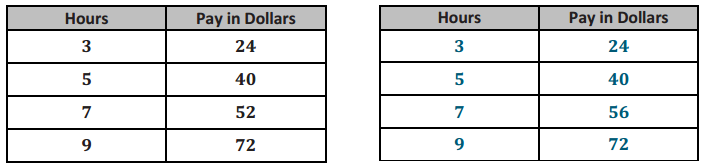
b.
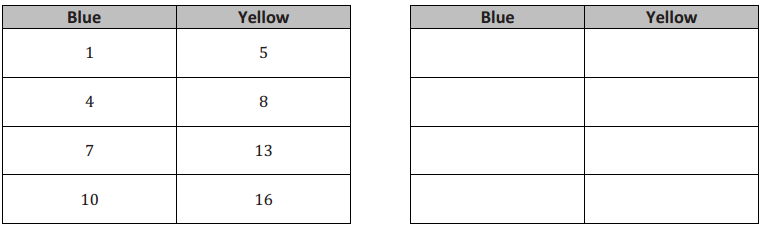
Answer:
Eureka Math Grade 6 Module 1 Lesson 10 Problem Set Answer Key
Question 1.
a. Create a ratio table for making lemonade with a lemon juice-to-water ratio of 1: 3. Show how much lemon juice would be needed if you use 36 cups of water to make lemonade.
Answer:
| Lemon Juice (cups) | Water (cups) |
| 1 | 3 |
| 2 | 6 |
| 3 | 9 |
| 4 | 12 |
| 12 | 36 |
12 cups of lemon Juice would be needed if 36 cups of water is used.
b. How is the value of the ratio used to create the table?
Answer:
The value of the ratio is \(\frac{1}{3}\). If we know the amount of lemon juice, we can multiply that amount by 3 to get the amount of water. If we know the amount of water, we can multiply that amount by \(\frac{1}{3}\) (or divide by 3) to get the amount of lemon juice.
Question 2.
Ryan made a table to show how much blue and red paint he mixed to get the shade of purple he will use to paint the room. He wants to use the table to make larger and smaller batches of purple paint.
| Blue | Red |
| 12 | 3 |
| 20 | 5 |
| 28 | 7 |
| 36 | 9 |
a. What ratio was used to create this table? Support your answer.
Answer:
The ratio of the amount of blue paint to the amount of red point is 4: 1. I know this because 12: 3, 20: 5, 28: 7, and 36:9 are all equivalent to 4: 1.
b. How are the values in each row related to each other?
Answer:
In each row, the amount of red paint is \(\frac{1}{4}\) times the amount of blue paint, or the amount of blue paint is 4 times the amount of red paint.
c. How are the values in each column related to each other?
Answer:
The values in the columns are increasing using the ratio. Since the ratio of the amount of blue paint to the amount of red paint is 4: 1, we have used 4 × 2: 1 × 2, or 8: 2, and repeatedly added to form the table. 8 was added to the entries in the blue column while 2 was added to the entries in the red column.
Eureka Math Grade 6 Module 1 Lesson 10 Exit Ticket Answer Key
Question 1.
Show more than one way you could use the structure of the table to find the unknown value. Fill in the unknown values.
| Number of Weeks | Amount of Money in Account |
| 2 | $350 |
| 4 | $700 |
| 6 | $1,050 |
| 8 | |
| 10 |
Answer:
| Number of Weeks | Amount of Money in Account |
| 2 | $350 |
| 4 | $700 |
| 6 | $1,050 |
| 8 | $1,400 |
| 10 | $1,750 |
I can add two to the weeks each time to get the next number. I can add $350 to the money to get the next values.
In the rows, we have 2:350, which is equal to 1: 175. So the money is 175 times larger than the week. I can just multiply the week by 175 to get the amount of money in the account.
The ratio used to create the table was 1: 175.