Engage NY Eureka Math Grade 6 Module 6 Lesson 13 Answer Key
Eureka Math Grade 6 Module 6 Lesson 13 Exercise Answer Key
Exercises 1 – 4: More French Fries
Exercise 1.
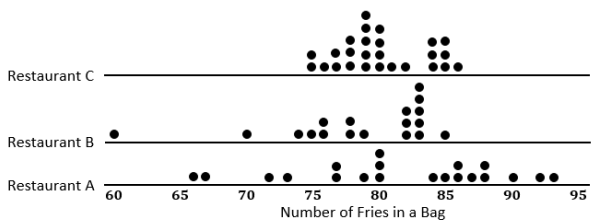
In Lesson 12, you thought about the claim made by a chain restaurant that the typical number of french fries in a large bag was 82. Then, you looked at data on the number of fries in a bag from three of the restaurants.
a. How do you think the data were collected, and what problems might have come up in collecting the data?
Answer:
Answers will vary. They probably went to the restaurants and ordered a bunch of large bags of french fries. Sometimes the fries are broken, so they might have to figure out what to do with those – either count them as a whole, discord them, or put them together to make whole fries.
b. What scenario(s) would give counts that might not be representative of typical bags?
Answer:
Answers will vary. Different workers might put different amounts in a bog, so if you bought the bags at lunch, you might have different numbers than if you did it in the evening. The restaurants might weigh the bags to see that the weight was constant despite the size of the fries, so you could have some weight of fries even though you had different counts for the bags.
Exercise 2.
The medians of the top half and the medians of the bottom half of the data for each of the three restaurants are as follows: Restaurant A – 87. 5 and 77; Restaurant B – 83 and 76; Restaurant C – 84 and 78. The difference between the medians of the two halves are called the interquartile range, or IQR.
a. What is the IQR for each of the three restaurants?
Answer:
The IQR for Restaurant A is 87.5 – 77 = 10.5; Restaurant B is 83 – 76 = 7; Restaurant C is 84 – 78 = 6.
b. Which of the restaurants had the smallest IQR, and what does that tell you?
Answer:
Restaurant Chad the smallest IQR. This indicates that the spread around the median number of fries is smaller than for either of the other two restaurants. About half of the data are within a range of 6 fries and near the median, so the median is a pretty good description of what is typical.
c. The median of the bottom half of the data is called the lower quartile (denoted by Q1), and the median of the top half of the data ¡s called the upper quartile (denoted by Q3). About what fraction of the data would be between the lower and upper quartiles? Explain your thinking.
Answer:
About \(\frac{1}{2}\), or 50%, of the counts would be between the quartiles because about \(\frac{1}{4}\) of the counts are between the median and \(\frac{1}{4}\) of the lower quartile, and of the counts are between the median and the upper quartile.
Exercise 3.
Why do you think that the median of the top half of the data is called the upper quartile and the median of the bottom half of the data is called the lower quartile?
Answer:
Answers will vary. Students might say that quartile is related to quarter, and the lower quartile, the median, and the upper quartile divide the data into four sections with about one fourth, or a quarter, of the data values in each section.
Exercise 4.
a. Mark the quartiles for each restaurant on the graphs below.
Answer:
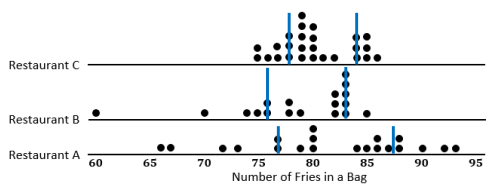
b. Does the IQR help you decide which of the three restaurants seems most likely to really have 82 fries in a typical large bag? Explain your thinking.
Answer:
The IQR does help decide which restaurant is most likely to have 82 fries in a typical large bag because the IQR explains the variability of the data. Because Restaurant Chas the smallest IQR, the middle half of the counts of the number of fries in a bag is really close to the median. In addition, Restaurant C also has the smallest range.
Exercise 5: When Should You Use the IQR?
Exercise 5.
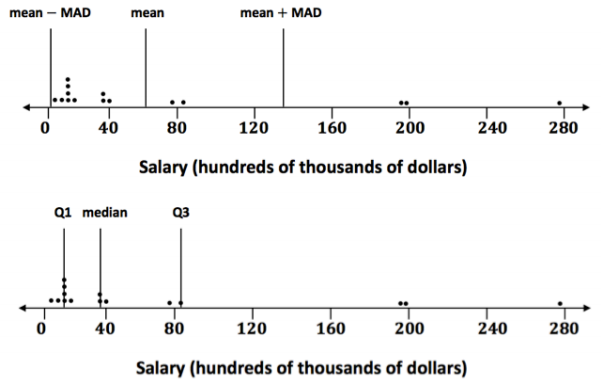
When should you use the IQR? The data for the 2012 salaries for the Lakers basketball team are given in the two plots below. (See Problem 5 in the Problem Set from Lesson 12.)
a. The data are given in hundreds of thousands of dollars. What would a salary of 40 hundred thousand dollars be?
Answer:
The salary would be $4, 000,000.
b. The vertical lines on the top plot show the mean and the mean plus and minus the MAD. The bottom plot shows the median and the IQR. Which interval is a better picture of the typical salaries? Explain your thinking.
Answer:
The median and the IQR seem to represent the typical salaries better than the mean plus or minus the MAD. The mean salary is above all but five of the salaries. Both the mean and the MAD are affected by the three unusually large salaries in the data set.
Exercise 6: On Your Own with IQRs
Exercise 6.
Create three different examples where you might collect data and where that data might have an IQR of 20. Define a median in the context of each example. Be specific about how the data might have been collected and the units involved. Be ready to describe what the median and IQR mean in each context.
Answer:
It may be difficult for students to get started on the exercise. if students struggle, consider a class discussion of one of the examples that follow. Student answers will vary.
Some examples that could be included in this exercise are as follows: number of books read by students during a school year (some students read a lot of books, while other students may not read as many), number of movies viewed at a theater during the lost year by students in a class, number of text messages students receive during a specific day (for example, on Monday), number of commercials on TV during a specific time period that are about buying a car, number of different states students have visited, number of healthy trees on certain blocks of a city, and number of students in each classroom of a school during a specific time period.
Remind students that the goal is to have them think of data that if collected might have an IQR of approximately 20, meaning that the middle half of the data would spread out over an interval of length 20. These ideas also allow students to start thinking of the process of actually collecting data that are needed later.
Eureka Math Grade 6 Module 6 Lesson 13 Example Answer Key
Example 1: Finding the IQR
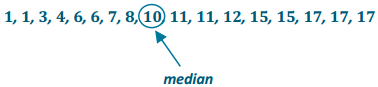
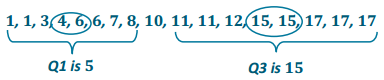
Read through the following steps. If something does not make sense to you, make a note, and raise it during class discussion. Consider the data: 1, 1,3,4,6,6,7,8, 10, 11, 11, 12, 15, 15, 17, 17, 17
Creating an IQR:
a. Put the data in order from smallest to largest.
Answer:
The data are already ordered.
1, 1,3,4,6,6,7,8, 10,11, 11, 12, 15, 15, 17,17, 17.
b. Find the minimum and maximum.
Answer:
The minimum data point is 1, and the maximum is 17.
![]()
c. Find the median.
Answer:
There are 17 data points, so the ninth one from the smallest or the largest is the median.
d. Find the lower quartile and upper quartile.
Answer:
The lower quartile (Q1) is halfway between the 4th and 5th data points (the average of 4 and 6), or 5, and the upper quartile (Q3) is halfway between the 13th and the 14th data points (the average of 15 and 15), or 15.
e. Calculate the IQR by finding the difference between Q3 and Q1.
Answer:
IQR = 15 – 5 = 10.
Eureka Math Grade 6 Module 6 Lesson 13 Problem Set Answer Key
Question 1.
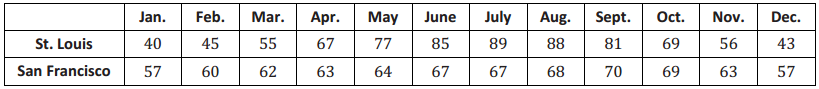
The average monthly high temperatures (in degrees Fahrenheit) for St. Louis and San Francisco are given in the table below.
a. How do you think the data might have been collected?
Answer:
Someone at a park or the airport or someplace probably records the temperature every hour of every day and then takes oil of the highest daily temperatures and finds the mean.
b. Do you think it would be possible for \(\frac{1}{4}\) of the temperatures in the month of July for St. Louis to be 95°F or above? Why or why not?
Answer:
Yes, it is possible. The mean temperature in St. Louis for July is 89° F. There are 31 days in July, s0 \(\frac{1}{4}\) of the days would be about 8 days. Student answers should have 8 or more temperatures that are above 95 °F, and then the other values could be anything that would result in an overall mean of 89 °F.
For example, if the temperature was 95°F for 5 days, 100°Ffor 3 days, and 86°F for all of the rest of the days, there would be 8 days with temperatures of 95 °F or higher, and the mean for the month would be 89°F.
c. Make a prediction about how the values of the IQR for the temperatures for each city compare. Explain your thinking.
Answer:
San Francisco probably has the smaller IQR because those temperatures do not seem to vary as much as the St. Louis temperatures.
d. Find the IQR for the average monthly high temperature for each city. How do the results compare to what you predicted?
Answer:
The IQRs for San Francisco and St. Louis are 6.5°F and 33°F, respectively. This result matches my prediction in part (c).
Question 2.
The plot below shows the years in which each of 100 pennies were made.
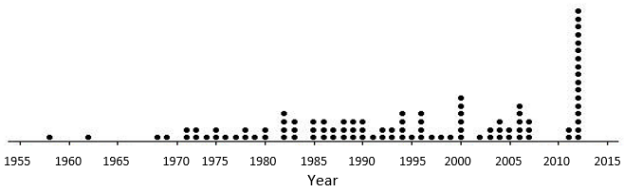
a. What does the stack of 17 dots at 2012 representing 17 pennies tell you about the age of these pennies in 2014?
Answer:
17 pennies were made in 2012, and they would be 2 years old in 2014.
b. Here is some information about the sample of 100 pennies. The mean year they were made is 1994; the first
year any of the pennies were made was 1958; the newest pennies were made in 2012; Q1 is 1984, the median is 1994, and Q3 is 2006; the MAD is 11.5 years. Use the information to indicate the years in which the middle half of the pennies were made.
Answer:
In this case, the IQR is 22 years, so the middle half of the pennies was mode over an interval 22 years.
Question 3.
In each of parts (a) – (c), create a data set with at least 6 values such that it has the following properties:
a. A small IQR and a big range (maximum-minimum)
Answer:
Answers will vary. One example is (0, 100, 50, 50, 50, 50, 50) where the range is 100 and the IQR is 0.
b. An IQR equal to the range
Answer:
Answers will vary. One example is (10, 10, 10, 15, 20, 20, 20).
c. The lower quartile is the same as the median.
Answer:
Answers will vary. One example is (1, 1, 1, 1, 1, 5, 6.7).
Question 4.
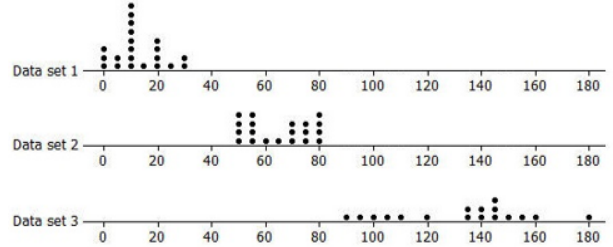
Rank the following three data sets by the value of the IQR.
Answer:
Data set 1 has the smallest IQR at about 14 data; set 2 has the next smallest IQR at about 22 and data set 3 has the largest IQR at about 41.
Question 5.
Here are the number of fries in each of the bags from Restaurant A:
80, 72, 77, 80, 90, 85, 93, 79, 84, 73, 87, 67, 80, 86, 92, 88, 86, 88, 66, 77
a. Suppose one bag of fries had been overlooked and that bag had only 50 fries. If that value is added to the data set, would the IQR change? Explain your reasoning.
Answer:
The IQR would be larger, 12.5, because the median number of fries would be at 80 now instead of 82, which would make the lower quartile at 75 instead of 77.
b. Will adding another data value always change the IQR? Give an example to support your answer.
Answer:
No. It depends on how many values you have in the data set and what value is added. For example, if the set of data is (2,2,2,6,9,9,9), the IQR is 9 – 2 = 7. If you add another 6, the IQR would stay at 7.
Eureka Math Grade 6 Module 6 Lesson 13 Exit Ticket Answer Key
Question 1.
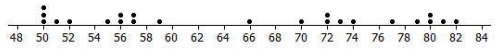
On the dot plot below, insert the following words in approximately the correct position. Maximum Minimum IQR Median Lower Quartile (Q1) Upper Quartile (Q3)
Answer:
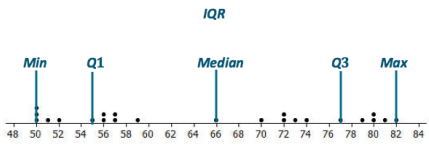
Question 2.
Estimate the IQR for the data set shown in the dot plot.
Answer:
The IQR is approximately 22.