Engage NY Eureka Math Grade 6 Module 6 Lesson 15 Answer Key
Eureka Math Grade 6 Module 6 Lesson 15 Example Answer Key
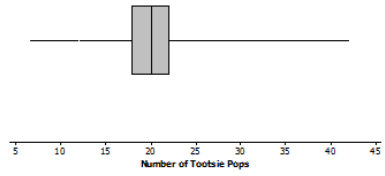
Example 1: Tootsie Pops
Ninety-four people were asked to grab as many Tootsie Pops as they could hold. Here is a box plot for these data. Are you surprised?
Answer:
Answers will vary. Students might indicate that they are surprised that some people were able to hold as many as 40 Tootsie Pops or that they are surprised at how much person-to-person variability there is. They may also comment on the fact that about half the people were able to hold between 18 and 23 Tootsie Pops.
Eureka Math Grade 6 Module 6 Lesson 15 Exercise Answer Key
Exercises 1 – 5:
Exercise 1.
What might explain the variability in the number of Tootsie Pops that the 94 people were able to hold?
Answer:
Answers will vary. Possible answers include the size of people’s hands, handspan, and whether a person is flexible in moving his fingers.
Exercise 2.
Use a box plot to estimate the values in the five-number summary.
Answer:
Min = 7, Q1 = 18, Median = 20, Q3 = 22, Max = 42.
Exercise 3.
Describe how the box plot can help you understand differences in the numbers of Tootsie Pops people could hold.
Answer:
The maximum of about 42 and minimum of about 7 indicate that there is o lot of variability in the number of Tootsie Pops that people can hold, with the numbers covering a range of about 35 Tootsie Pops. The “box” port of the box plot shows that about half of the peopk con hold within about 2 Tootsie Pops of the median, which was 20 Tootsie Pops.
Exercise 4.
Here is Jayne’s description of what she sees in the box plot. Do you agree or disagree with her description? Explain your reasoning.
“One person could hold as many as 42 Tootsie Pops. The number of Tootsie Pops people could hold was really different and spread about equally from 7 to 42. About one-half of the people could hold more than 20 Tootsie Pops.”
Answer:
You cannot tell that they are evenly spread—the “box” part of the box plot contains about half of the values for the number of Tootsie Pops. However, the box is only four units long. That means half of the people were bunched over those four numbers.
Exercise 5.
Here is a different box plot of the same data on the number of Tootsie Pops 94 people could hold.
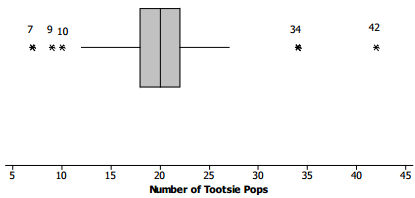
a. Why do you suppose there are five values that are shown as separate points and are labeled?
Answer:
Maybe because they are far away from most of the other values. It shows that more than half ofthe data an from about 12 to 27 Tootsie Pops.
b. Does knowing these data values change anything about your responses to Exercises 1 to 4 above?
Answer:
Not really, except maybe to say that only a few of the people could hold more than 30 Tootsie Pops; the rest held fewer than that. And only a few people could hold 10 or fewer Tootsie Pops.
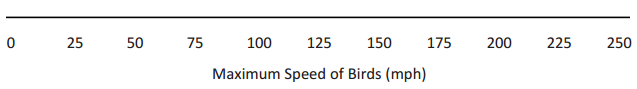
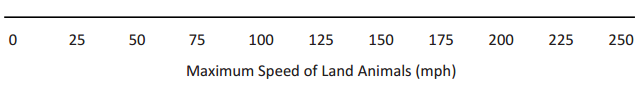
Exercises 6 – 10: Maximum Speeds
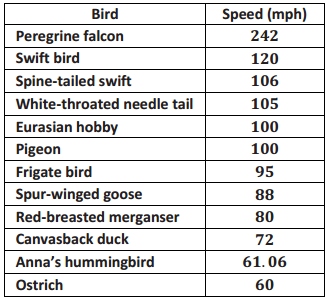
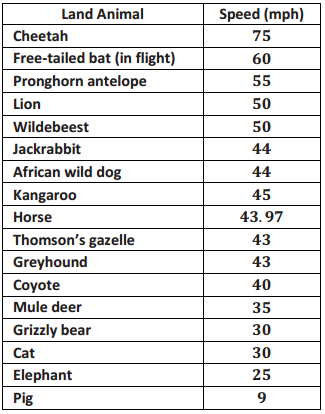
The maximum speeds of selected birds and land animals are given in the tables below.
Exercise 6.
As you look at the speeds, what strikes you as interesting?
Answer:
Answers will vary. Some students might suggest birds are really fast, especially the falcon. Others may notice that only two of the speeds have decimals. The speeds of specific animals might strike students as interesting.
Exercise 7.
Do birds or land animals seem to have the greatest variability in speeds? Explain your reasoning.
Answer:
It looks like the speeds of the birds vary a lot, as they go from 60 mph for some birds to 242 mph for others. The speeds of the land animals vary but not as much; they go from 9 mph to 75 mph.
Exercise 8.
Find the five-number summary for the speeds in each data set. What do the five-number summaries tell you about the distribution of speeds for each data set?
Answer:
Land animal five-number summary: Min = 9, Q1 = 32.5, Median = 43.97, Q3 = 50, Max = 75
Bird five-number summary: Min = 60, Q1 = 76, Median = 97.5, Q3 = 105.5, Max = 242
The summaries give me a sense of the range or span of the speeds (maximum-minimum speed) and how the speeds are grouped around the median.
Exercise 9.
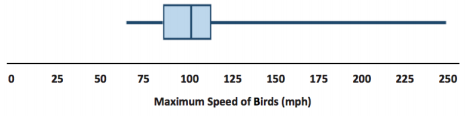
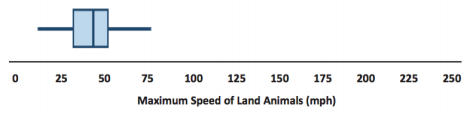
Use the five-number summaries to make a box plot for each of the two data sets.
Answer:
Exercise 10.
Write several sentences describing the speeds of birds and land animals.
Answer:
Answers will vary. At least one bird flies really fast: the falcon at 242 mph. Three-fourths of the birds fly less than 106 mph, and the slowest bird flies 60 mph. The land animals’ running speeds are slower, ranging from 9 mph to 75 mph. The middle half of the speeds for land animals is between 32.5 mph and 50 mph.
Exercises 11 – 15: What is the Same, and What is Different?
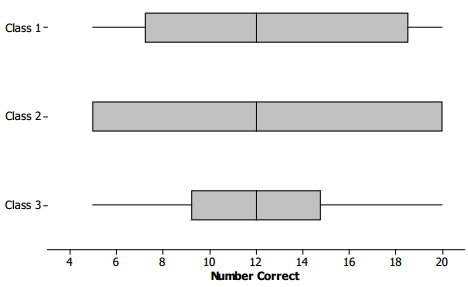
Consider the following box plots, which show the number of correctly answered questions on a 20-question quiz for students in three different classes.
Exercise 11.
Describe the variability in the scores of each of the three classes.
Answer:
The range (max-min) is the same for all three classes, and so is the median, but the intervals that contain the middle half of the scores (the length of the box part of the box plot) are different. The third class has a small box, so the scores in the middle are close together.
In Class 2, the minimum and lower quartile are the same scores, and the maximum and upper quartile are also the same score, so lots of scores are piled at the ends of the range. The middle half of the scores in Class 1 are spread out more than Class 3 but not as much as Class 2.
Teacher Note: The box plot for Class 2 may be difficult for students to interpret at first. If they have trouble, consider discussing the example provided earlier in the teacher flotes that shows how it is possible that the minimum and the lower quartile might be equal and how the upper quartile and the maximum might be equal.
Exercise 12.
a. Estimate the interquartile range for each of the three sets of scores.
Answer:
Class 1 IQR = 10; Class 2 IQR = 15; Class 3 IQR = 6
b. What fraction of students would have scores In the interval that extends from the lower quartile to the upper quartile?
Answer:
About one-half.
c. What does the value of the IQR tell you about how the scores are distributed?
Answer:
For Class 1, half of the scores are spread over an interval of width 10, and for Class 3, half of the scores are bunched together over an interval of width 5. For Class 2, the middle half of the data is spread over an interval of width 15, and in fact, because the quartiles are equal to the minimum and the maximum for Class 2, all of the data values are included in this interval with data values bunched up at the minimum and the maximum.
Exercise 13.
Which class do you believe performed the best? Be sure to use information from the box plots to back up your answer.
Answer:
1. Answers will vary. A few sample answers are provided.
2. Class 3, as it has the smallest IQR. About half of the students scored close to the median score. Scores were more consistent for this class.
3. Approximately 25% of the students in Class 1 scored 18 or higher compared to 25% of the students in Class 3 who scored 15 or higher. Therefore, Class 1 performed the best.
4. In Class 2, several students must have scored near the top in order for the Q3 and maximum to be the same.
Therefore, Class 2 performed the best.
Exercise 14.
a. Find the IQR for the three data sets in the first two examples: maximum speed of birds, maximum speed of
land animals, and number of Tootsie Pops.
Answer:
Land animals: 50 – 32. 5for an IQR of 17.5
Birds: 105.5 – 76 for an IQR of 29.5
Tootsie Pops: 22 – 18 for an IQR of 4
b. Which data set had the highest percentage of data values between the lower quartile and the upper quartile? Explain your thinking.
Answer:
All of the data sets should have about half of the data values between the quartiles.
Exercise 15.
A teacher asked students to draw a box plot with a minimum value at 34 and a maximum value at 64 that had an interquartile range of 10. Jeremy said he could not draw just one because he did not know where to put the box on the number line. Do you agree with Jeremy? Why or why not?
Answer:
Jeremy is correct since a box with a width of 10 could be drawn anywhere between the minimum and maximum values.
Eureka Math Grade 6 Module 6 Lesson 15 Problem Set Answer Key
Question 1.
The box plot below summarizes the maximum speeds of certain kinds of fish.
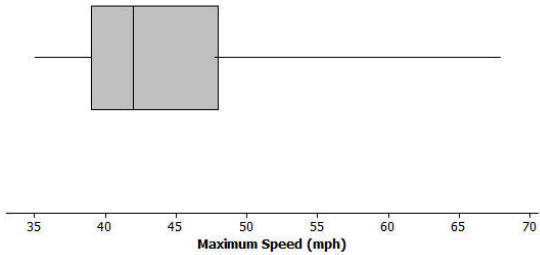
a. Estimate the values in the five-number summary from the box plot.
Answer:
Answers will vary. Min = 35 mph; Q1 = 39 mph; Median = 42 mph; Q3 = 48 mph; Max = 68 mph
b. The fastest fish is the sailfish at 68 mph, followed by the marlin at 50 mph. What does this tell you about the speed of the fish speeds in the top quarter of the box plot?
Answer:
The Q3 is about 48, so all but one of the fish in the top quarter ore between 48 mph and 50 mph.
c. Use the five-number summary and the IQR to describe the speeds of the fish.
Answer:
The speeds of fish vary from 35 mph to 68 mph. The IQR is 9 mph; the middle half of the speeds are between 39 mph and 48 mph. Half of the speeds are less than 42 mph.
Question 2.
Suppose the interquartile range for the number of hours students spent playing video games during the school week was 10. What do you think about each of the following statements? Explain your reasoning.
a. About half of the students played video games for 10 hours during a school week.
Answer:
This may not be correct, as you know the width of the interval that contains the middle half of the times was 10, but you do not know where it starts or stops. You do not know the lower or upper quartile.
b. All of the students played at least 10 hours of video games during the school week.
Answer:
This may not be correct for the same reason as in part (a).
c. About half of the class could have played video games from 10 to 20 hours a week or from 15 to 25 hours.
Answer:
Either could be correct, as the only information you have is the IQR of 10, and the statement says ‘could be,” not “is.”
Question 3.
Suppose you know the following for a data set: The minimum value is 130, the lower quartile is 142, the IQR is 30, half of the data are less than 168, and the maximum value is 195.
a. Think of a context for which these numbers might make sense.
Answer:
Answers will vary. For example, one possibility is the number of calories in a serving of fruit.
b. Sketch a box plot.
Answer:
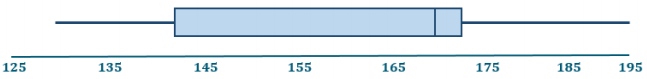
c. Are there more data values above or below the median? Explain your reasoning.
Answer:
The number of data values on either side of the median should be about the same: one-half of all of the data.
Question 4.
The speeds for the fastest dogs are given in the table below.
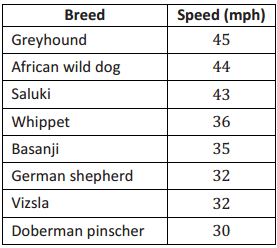
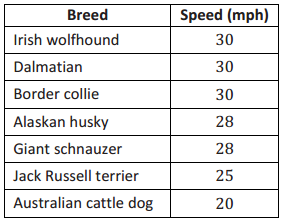
a. Find the five-number summary for this data set and use it to create a box plot of the speeds.
Answer:
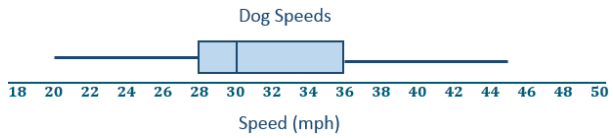
Min = 20, Q1 = 28, Median = 30, Q3 = 36, Max = 45
b. Why is the median not in the center of the box?
Answer:
The median is not in the center of the box because about \(\frac{1}{4}\) of the speeds are between 30 and 36, and another \(\frac{1}{4}\) are closer together, between 28 and 30.
c. Write a few sentences telling your friend about the speeds of the fastest dogs.
Answer:
Half of the dogs run faster than 30 mph the fastest dog in the list is the greyhound with a speed of 45 mph. The slowest dog in the list is the Australian cattle dog with a speed of 20 mph. The middle 50% of the speeds are between 28 mph and 36 mph.
Eureka Math Grade 6 Module 6 Lesson 15 Exit Ticket Answer Key
Question 1.
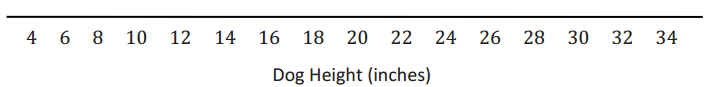
Given the following information, create a box plot, and find the IQR.
For a large group of dogs, the shortest dog was 6 inches, and the tallest was 32 inches. One-half of the dogs were taller than 18 inches. One-fourth of the dogs were shorter than 15 inches. The upper quartile of the dog heights was 23 inches.
Answer:
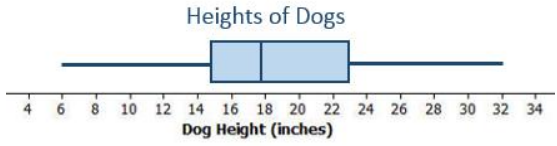
IQR = 23 – 15 = 8
The IQR is 8.