Engage NY Eureka Math 7th Grade Module 5 Lesson 21 Answer Key
Eureka Math Grade 7 Module 5 Lesson 21 Exercise Answer Key
Exercise 1.
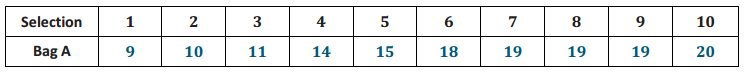
To begin your investigation, start by selecting a random sample of ten numbers from Bag A. Remember to mix the numbers in the bag first. Then, select one number from the bag. Do not put it back into the bag. Write the number in the chart below. Continue selecting one number at a time until you have selected ten numbers. Mix up the numbers in the bag between each selection.
Answer:
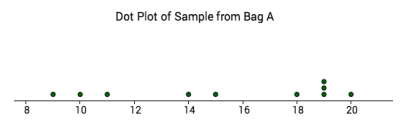
a. Create a dot plot of your sample of ten numbers. Use a dot to represent each number in the sample.
Answer:
The dot plot will vary based on the sample selected. One possible answer is shown here.
b. Do you think the mean of all the numbers in Bag A might be 10? Why or why not?
Answer:
Anticipate that students will indicate a mean of a sample from Bag A is greater than 10. Responses depend on students’ samples and the resulting dot plots. In most cases, the dots will center around a value that is greater than 10 because the mean of the population is greater than 10.
c. Based on the dot plot, what would you estimate the mean of the numbers in Bag A to be? How did you make your estimate?
Answer:
Answers will vary depending on students’ samples. Anticipate that most students’ estimates will correspond to roughly where the dots in the dot plot center. The population mean here is 14.5, so answers around 14 or 15 would be expected.
d. Do you think your sample mean will be close to the population mean? Why or why not?
Answer:
Students could answer “Yes,” “No,” or “I don’t know.” The goal of this question is to get students to think about the difference between a sample mean and the population mean.
e. Is your sample mean the same as your neighbors’ sample means? Why or why not?
Answer:
No. When selecting a sample at random, different students get different sets of numbers. This is sampling variability.
Exercise 2.
Repeat the process by selecting a random sample of ten numbers from Bag B.
Answer:

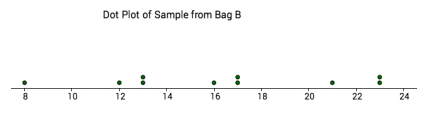
a. Create a dot plot of your sample of ten numbers. Use a dot to represent each of the numbers in the sample.
Answer:
The dot plots will vary based on the sample selected. One possible answer is shown here.
b. Based on your dot plot, do you think the mean of the numbers in Bag C is the same as or different from the mean of the numbers in Bag A? Explain your thinking.
Answer:
Answers will vary, as students will compare their center of the dot plot of the sample from Bag B to the center of the dot plot of the sample from Bag A. The centers will probably not be exactly the same; however, anticipate centers that are close to each other.
Exercise 3.
Repeat the process once more by selecting a random sample of ten numbers from Bag C.
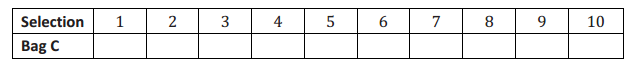
Answer:
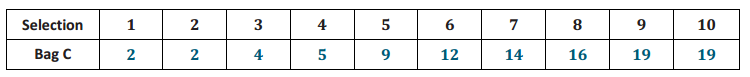
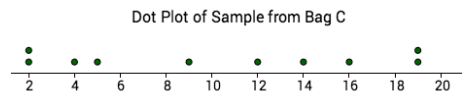
a. Create a dot plot of your sample of ten numbers. Use a dot to represent each of the numbers in the sample.
Answer:
The dot plots will vary based on the sample selected. One possible answer is shown here.
b. Based on your dot plot, do you think the mean of the numbers in Bag C is the same as or different from the mean of the numbers in Bag A? Explain your thinking.
Answer:
Anticipate that students will indicate that the center of the dot plot of the sample from Bag C is less than the center of the dot plot of the sample from Bag A. Because the population mean for Bag C is less than the population mean for Bag A, the center of the dot plot will usually be less for the sample from Bag C.
Exercise 4.
Are your dot plots of the three bags the same as the dot plots of other students in your class? Why or why not?
Answer:
The dot plots will vary. Because different students generally get different samples when they select a sample from the bags, the dot plots will vary from student to student.
Exercise 5.
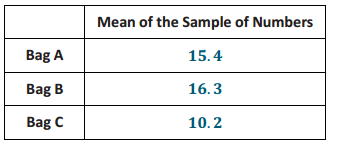
Calculate the mean of the numbers for each of the samples from Bag A, Bag B, and Bag C.
Answer:
a. Are the sample means you calculated the same as the sample means of other members of your class? Why or why not?
Answer:
No. When selecting a sample at random, you get different sets of numbers (again, sampling variability).
b. How do your sample means for Bag A and for Bag B compare?
Answer:
Students might answer that the mean for the sample from Bag A is larger, smaller, or equal to the mean for the sample from Bag B, depending on their samples. For the example given above, the sample mean for Bag A is smaller than the sample mean for Bag B.
c. Calculate the difference of the sample mean for Bag A minus the sample mean for Bag B (Mean A – Mean B). Based on this difference, can you be sure which bag has the larger population mean? Why or why not?
Answer:
No. It is possible that you could get a sample mean that is larger than the population mean of Bag A and then get a sample mean that is smaller than the population mean of Bag B, or vice versa.
Exercise 6.
Based on the class dot plots of the sample means, do you think the mean of the numbers in Bag A and the mean of the numbers in Bag B are different? Do you think the mean of the numbers in Bag A and the mean of the numbers in Bag C are different? Explain your answers.
Answer:
Answers will vary. Sample response: Bags A and B are similar, and Bag C is different from the other two.
Exercise 7.
Based on the difference between the sample mean of Bag A and the sample mean of Bag B (Mean A – Mean B) that you calculated in Exercise 5, do you think that the two populations (Bags A and B) have different means, or do you think that the two population means might be the same?
Answer:
Answers will vary, as the difference of the means will be based on each student’s samples. Anticipate answers that indicate the difference in the sample means that the population means might be the same for differences that are close to 0. (Students learn later in this lesson that the populations of Bags A and B are the same, so most students will see differences that are not too far from 0.)
Exercise 8.
Based on this difference, can you be sure which bag has the larger population mean? Why or why not?
Answer:
No. It is possible that you could get a sample mean that is larger than the population mean of Bag A and then get a sample mean that is smaller than the population mean of Bag B, or vice versa.
Exercise 9.
Is your difference in sample means the same as your neighbors’ differences? Why or why not?
Answer:
No. As the samples will vary due to sampling variability, so will the means of each sample.
Exercise 10.
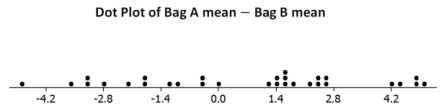
Plot your difference of the means (Mean A – Mean B) on a class dot plot. Describe the distribution of differences plotted on the graph. Remember to discuss center and spread.
Answer:
Answers will vary. The distribution of the differences is expected to cluster around 0. One example for a class of 30 students is shown here.
Exercise 11.
Why are the differences in the sample means of Bag A and Bag B not always 0?
Answer:
For the difference in sample means to be 0, the sample means must be the same value. This would rarely happen when selecting random samples.
Exercise 12.
Does the class dot plot contain differences that were relatively far away from 0? If yes, why do you think this happened?
Answer:
For the dot plot given as an example above, some differences were as large as 4.
Exercise 13.
Suppose you will take a sample from a new bag. How big would the difference in the sample mean for Bag A and the sample mean for the new bag (Mean A – Mean new) have to be before you would be convinced that the population mean for the new bag is different from the population mean of Bag A? Use the class dot plot of the differences in sample means for Bags A and B (which have equal population means) to help you answer this question.
Answer:
Students should recognize that the difference would need to be relatively far away from 0. They may give answers like “a difference of 5 (or larger)” or something similar. Remind students that the differences noted in the class dot plot are a result of sampling from bags that have the same numbers in them. As a result, students would be expected to suggest values that are greater than the values in the class dot plot.
Exercise 14.
Calculate the sample mean of Bag A minus the sample mean of Bag C (Mean A – Mean C).
Answer:
Answers will vary, as the samples collected by students will vary. Students might suspect, however, that they are being set up for a discussion about populations that have different means. As a result, ask students what they think their difference is indicating about the populations of the two bags. For several students, this difference is larger than the difference they received for Bags A and B and might suggest that the means of the bags are different.
Not all students, however, will have differences that are noticeably different from what they obtained for Bags A and B, and as a result, they will indicate that the bags could have the same or similar distribution of numbers.
Exercise 15.
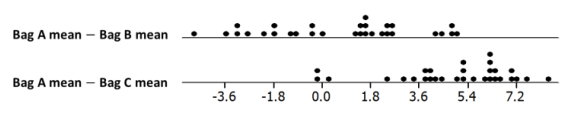
Plot your difference (Mean A – Mean C) on a class dot plot.
Answer:
Have each student or group of students place their differences on a class dot plot similar to what was developed for the dot plot of the difference of means in Bags A and B. Place the dot plots next to each other so that students can compare the centers and spread of each distribution. One example based on a class of 30 students is shown here. Notice that the differences for Bag A – Bag B center around 0, while the differences for Bag A – Bag C do not center around 0.
Exercise 16.
How do the centers of the class dot plots for Mean A – Mean B and Mean A – Mean C compare?
Answer:
The center of the second dot plot Mean A – Mean C is shifted over to the right. Thus, it is not centered at 0; rather, it is centered over a value that is larger than 0.
Exercise 17.
Each bag has a population mean that is either 10.5 or 14.5. State what you think the population mean is for each bag. Explain your choice for each bag.
Answer:
The population mean is 14.5 for Bags A and B and 10.5 for Bag C. Students indicate their selections based on the class dot plots and the sample means they calculated in the exercises.
Eureka Math Grade 7 Module 5 Lesson 21 Problem Set Answer Key
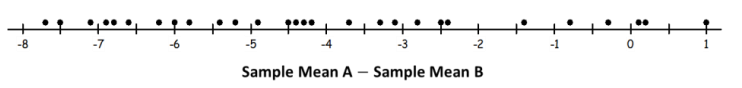
Below are three dot plots. Each dot plot represents the differences in sample means for random samples selected from two populations (Bag A and Bag B). For each distribution, the differences were found by subtracting the sample means of Bag B from the sample means of Bag A (sample mean A – sample mean B).
Question 1.
Does the graph below indicate that the population mean of Bag A is larger than the population mean of Bag B? Why or why not?
Answer:
No. Since most of the differences are negative, it appears that the population mean of Bag A is smaller than the population mean of Bag B.
Question 2.
Use the graph above to estimate the difference in the population means (Mean A – Mean B).
Answer:
About -4. This is about the middle of the graph.
Question 3.
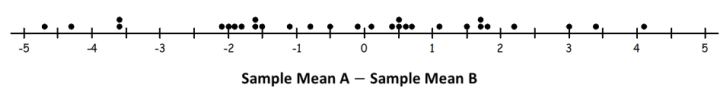
Does the graph below indicate that the population mean of Bag A is larger than the population mean of Bag B? Why or why not?
Answer:
No. The dots are all centered around 0, meaning that the population means of Bag A and Bag B might be equal.
Question 4.
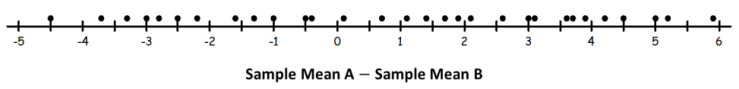
Does the graph below indicate that the population mean of Bag A is larger than the population mean of Bag B? Why or why not?
Answer:
Yes. The dots are near 1.5. There is a small difference in the population means, but it is so small that it is difficult to detect. (Note to teachers: Some students may answer, “No. The dots appear centered around 0.” Problem 6 should cause students to rethink this answer.)
Question 5.
In the above graph, how many differences are greater than 0? How many differences are less than 0? What might this tell you?
Answer:
There are 18 dots greater than 0 and 12 dots less than 0. It tells me that there are more positive differences, which may mean that the population mean for Bag A is bigger than the population mean for Bag B.
Question 6.
In Problem 4, the population mean for Bag A is really larger than the population mean for Bag B. Why is it possible to still get so many negative differences in the graph?
Answer:
It is possible to get so many negative values because the population mean of Bag A may only be a little bigger than the population mean of Bag B.
Eureka Math Grade 7 Module 5 Lesson 21 Exit Ticket Answer Key
Question 1.
How is a meaningful difference in sample means different from a non-meaningful difference in sample means? You may use what you saw in the dot plots of this lesson to help you answer this question.
Answer:
A meaningful difference in sample means is one that is not likely to have occurred by just chance if there is no difference in the population means. A meaningful difference in sample means would be one that is very far from 0 (or not likely to happen if the population means are equal). A non-meaningful difference in sample means would be one that is relatively close to 0, which indicates the population means are equal.
Note that how big this difference needs to be in order to be declared meaningful depends on the context, the sample size, and the variability in the populations.