Engage NY Eureka Math 8th Grade Module 5 Lesson 5 Answer Key
Eureka Math Grade 8 Module 5 Lesson 5 Exploratory Challenge/Exercise Answer Key
Exploratory Challenge/Exercises 1–3
Exercise 1.
The distance that Giselle can run is a function of the amount of time she spends running. Giselle runs 3 miles in 21 minutes. Assume she runs at a constant rate.
a. Write an equation in two variables that represents her distance run, y, as a function of the time, x, she spends running.
\(\frac{3}{21}\) = \(\frac{y}{x}\)
y = \(\frac{1}{7}\) x
b. Use the equation you wrote in part (a) to determine how many miles Giselle can run in 14 minutes.
Answer:
y = \(\frac{1}{7}\) (14)
y = 2
Giselle can run 2 miles in 14 minutes.
c. Use the equation you wrote in part (a) to determine how many miles Giselle can run in 28 minutes.
Answer:
y = \(\frac{1}{7}\) (28)
y = 4
Giselle can run 4 miles in 28 minutes.
d. Use the equation you wrote in part (a) to determine how many miles Giselle can run in 7 minutes.
Answer:
y = \(\frac{1}{7}\) (7)
y = 1
Giselle can run 1 mile in 7 minutes.
e. For a given input x of the function, a time, the matching output of the function, y, is the distance Giselle ran in that time. Write the inputs and outputs from parts (b)–(d) as ordered pairs, and plot them as points on a coordinate plane.
Answer:
(14, 2), (28, 4), (7, 1)
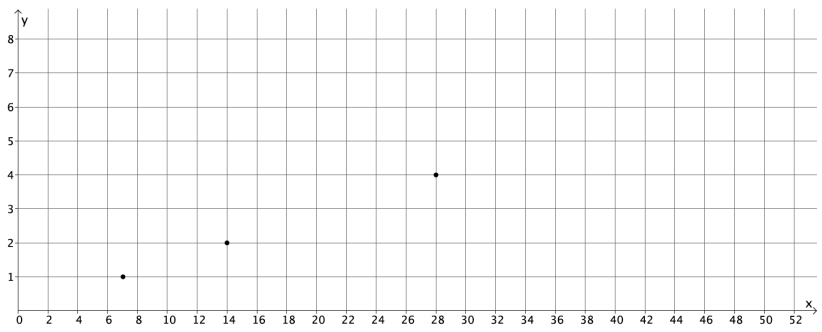
f. What do you notice about the points you plotted?
Answer:
The points appear to be in a line.
g. Is the function discrete?
Answer:
The function is not discrete because we can find the distance Giselle runs for any given amount of time she spends running.
h. Use the equation you wrote in part (a) to determine how many miles Giselle can run in 36 minutes. Write your answer as an ordered pair, as you did in part (e), and include the point on the graph. Is the point in a place where you expected it to be? Explain.
Answer:
y = \(\frac{1}{7}\) (36)
y = \(\frac{36}{7}\)
y = 5 \(\frac{1}{7}\)
(36, 5 \(\frac{1}{7}\)) The point is where I expected it to be because it is in line with the other points.
i. Assume you used the rule that describes the function to determine how many miles Giselle can run for any given time and wrote each answer as an ordered pair. Where do you think these points would appear on the graph?
Answer:
I think all of the points would fall on a line.
j. What do you think the graph of all the possible input/output pairs would look like? Explain.
Answer:
I know the graph will be a line as we can find all of the points that represent fractional intervals of time too. We also know that Giselle runs at a constant rate, so we would expect that as the time she spends running increases, the distance she can run will increase at the same rate.
k. Connect the points you have graphed to make a line. Select a point on the graph that has integer coordinates. Verify that this point has an output that the function would assign to the input.
Answer:
Answers will vary. Sample student work:
The point (42, 6) is a point on the graph.
y = \(\frac{1}{7}\) x
6 = \(\frac{1}{7}\) (42)
6 = 6
The function assigns the output of 6 to the input of 42.
l. Sketch the graph of the equation y = \(\frac{1}{7}\) x using the same coordinate plane in part (e). What do you notice about the graph of all the input/output pairs that describes Giselle’s constant rate of running and the graph of the equation y = \(\frac{1}{7}\) x?
Answer:
The graphs of the equation and the function coincide completely.
Exercise 2.
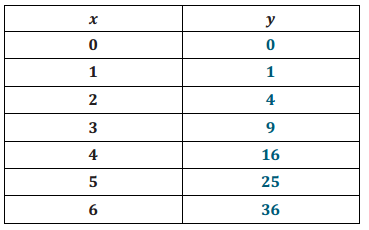
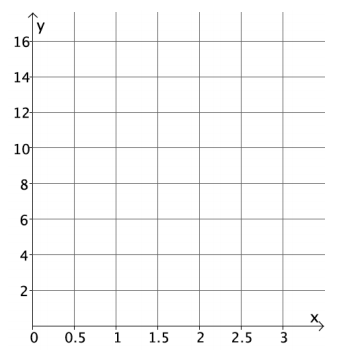
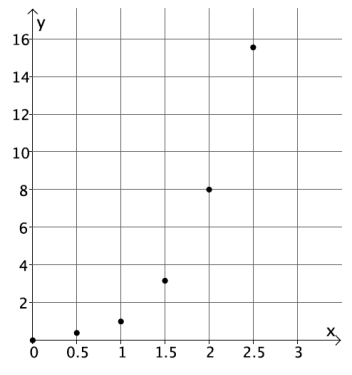
Sketch the graph of the equation y = x2 for positive values of x. Organize your work using the table below, and then answer the questions that follow.
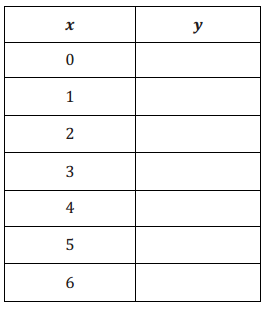
Answer:
a. Plot the ordered pairs on the coordinate plane.
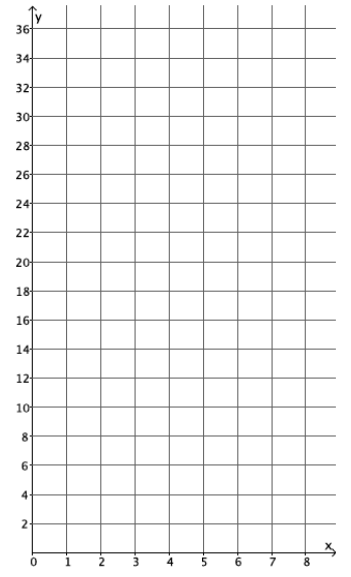
Answer:
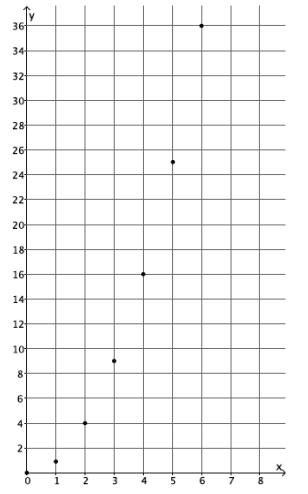
b. What shape does the graph of the points appear to take?
Answer:
It appears to take the shape of a curve.
c. Is this equation a linear equation? Explain.
Answer:
No, the equation y = x2 is not a linear equation because the exponent of x is greater than 1.
d. Consider the function that assigns to each square of side length s units its area A square units. Write an equation that describes this function.
Answer:
A = s2
e. What do you think the graph of all the input/output pairs (s, A) of this function will look like? Explain.
Answer:
I think the graph of input/output pairs will look like the graph of the equation y = x2. The inputs and outputs would match the solutions to the equation exactly. For the equation, the y value is the square of the x value. For the function, the output is the square of the input.
f. Use the function you wrote in part (d) to determine the area of a square with side length 2.5 units. Write the input and output as an ordered pair. Does this point appear to belong to the graph of y = x2?
Answer:
A = (2.5)2
A = 6.25
The area of the square is 6.25 units squared. (2.5, 6.25) The point looks like it would belong to the graph of y = x2; it looks like it would be on the curve that the shape of the graph is taking.
Exercise 3.
The number of devices a particular manufacturing company can produce is a function of the number of hours spent making the devices. On average, 4 devices are produced each hour. Assume that devices are produced at a constant rate.
a. Write an equation in two variables that describes the number of devices, y, as a function of the time the company spends making the devices, x.
Answer:
\(\frac{4}{1}\) = \(\frac{y}{x}\)
y = 4x
b. Use the equation you wrote in part (a) to determine how many devices are produced in 8 hours.
Answer:
y = 4(8)
y = 32
The company produces 32 devices in 8 hours.
c. Use the equation you wrote in part (a) to determine how many devices are produced in 6 hours.
Answer:
y = 4(6)
y = 24
The company produces 24 devices in 6 hours.
d. Use the equation you wrote in part (a) to determine how many devices are produced in 4 hours.
Answer:
y = 4(4)
y = 16
The company produces 16 devices in 4 hours.
e. The input of the function, x, is time, and the output of the function, y, is the number of devices produced. Write the inputs and outputs from parts (b)–(d) as ordered pairs, and plot them as points on a coordinate plane.
Answer:
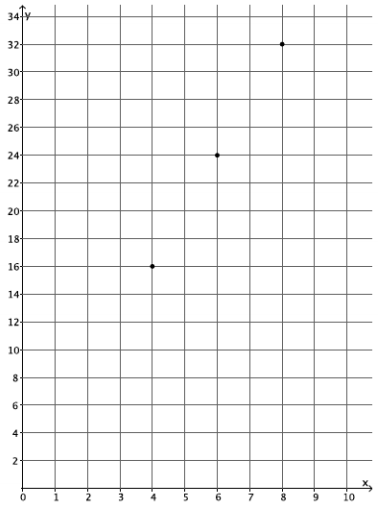
(8, 32), (6, 24), (4, 16)
f. What shape does the graph of the points appear to take?
Answer:
The points appear to be in a line.
g. Is the function discrete?
Answer:
The function is not discrete because we can find the number of devices produced for any given time, including fractions of an hour.
h. Use the equation you wrote in part (a) to determine how many devices are produced in 1.5 hours. Write your answer as an ordered pair, as you did in part (e), and include the point on the graph. Is the point in a place where you expected it to be? Explain.
Answer:
y = 4(1.5)
y = 6
(1.5, 6) The point is where I expected it to be because it is in line with the other points.
i. Assume you used the equation that describes the function to determine how many devices are produced for any given time and wrote each answer as an ordered pair. Where do you think these points would appear on the graph?
Answer:
I think all of the points would fall on a line.
j. What do you think the graph of all possible input/output pairs will look like? Explain.
Answer:
I think the graph of this function will be a line. Since the rate is continuous, we can find all of the points that represent fractional intervals of time. We also know that devices are produced at a constant rate, so we would expect that as the time spent producing devices increases, the number of devices produced would increase at the same rate.
k. Connect the points you have graphed to make a line. Select a point on the graph that has integer coordinates. Verify that this point has an output that the function would assign to the input.
Answer:
Answers will vary. Sample student work:
The point (5, 20) is a point on the graph.
y = 4x
20 = 4(5)
20 = 20
The function assigns the output of 20 to the input of 5.
l. Sketch the graph of the equation y = 4x using the same coordinate plane in part (e). What do you notice about the graph of input/output pairs that describes the company’s constant rate of producing devices and the graph of the equation y = 4x?
Answer:
The graphs of the equation and the function coincide completely.
Exploratory Challenge/Exercise 4.
Examine the three graphs below. Which, if any, could represent the graph of a function? Explain why or why not for each graph.
Graph 1:
Answer:
This is the graph of a function. Each input is a real number x, and we see from the graph that there is an output y to associate with each such input. For example, the ordered pair (-2, 4) on the line associates the output 4 to the input -2.
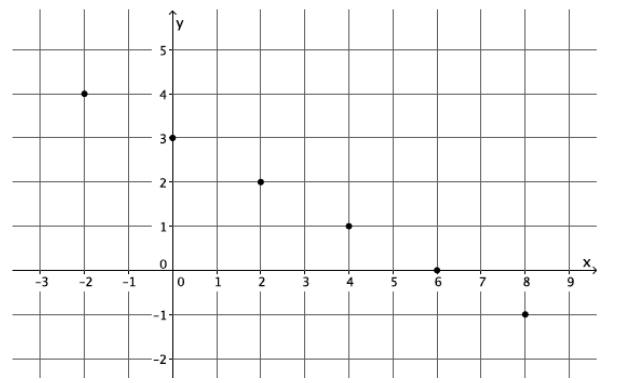
Graph 2:
Answer:
This is not the graph of a function. The ordered pairs (6, 4) and (6, 6) show that for the input of 6 there are two different outputs, both 4 and 6. We do not have a function.
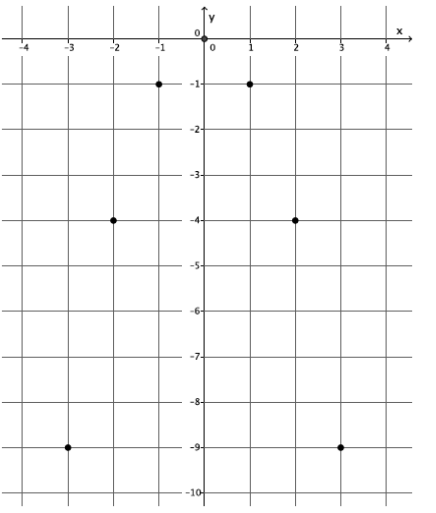
Graph 3:
Answer:
This is the graph of a function. The ordered pairs (-3, -9), (-2, -4), (-1, -1), (0, 0), (1, -1), (2, -4), and (3, -9) represent inputs and their unique outputs.
Eureka Math Grade 8 Module 5 Lesson 5 Problem Set Answer Key
Question 1.
The distance that Scott walks is a function of the time he spends walking. Scott can walk \(\frac{1}{2}\) mile every 8 minutes. Assume he walks at a constant rate.
a. Predict the shape of the graph of the function. Explain.
Answer:
The graph of the function will likely be a line because a linear equation can describe Scott’s motion, and I know that the graph of the function will be the same as the graph of the equation.
b. Write an equation to represent the distance that Scott can walk in miles, y, in x minutes.
Answer:
\(\frac{0.5}{8}\) = \(\frac{y}{x}\)
y = \(\frac{0.5}{8}\) x
y = \(\frac{1}{16}\) x
c. Use the equation you wrote in part (b) to determine how many miles Scott can walk in 24 minutes.
Answer:
y = \(\frac{1}{16}\) (24)
y = 1.5
Scott can walk 1.5 miles in 24 minutes.
d. Use the equation you wrote in part (b) to determine how many miles Scott can walk in 12 minutes.
Answer:
y = \(\frac{1}{16}\) (12)
y = \(\frac{3}{4}\)
Scott can walk 0.75 miles in 12 minutes.
e. Use the equation you wrote in part (b) to determine how many miles Scott can walk in 16 minutes.
Answer:
y = \(\frac{1}{16}\) (16)
y = 1
Scott can walk 1 mile in 16 minutes.
f. Write your inputs and corresponding outputs as ordered pairs, and then plot them on a coordinate plane.
Answer:
(24, 1.5), (12, 0.75), (16, 1)
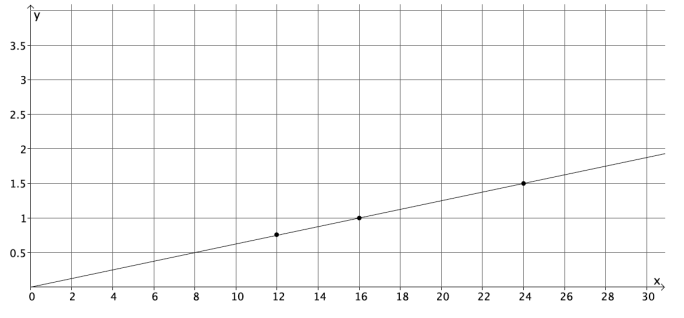
g. What shape does the graph of the points appear to take? Does it match your prediction?
Answer:
The points appear to be in a line. Yes, as I predicted, the graph of the function is a line.
h. Connect the points to make a line. What is the equation of the line?
Answer:
It is the equation that described the function: y = \(\frac{1}{16}\) x.
Question 2.
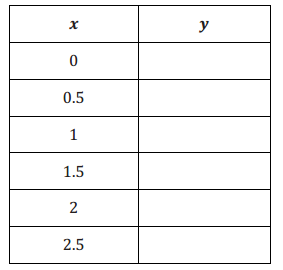
Graph the equation y = x3 for positive values of x. Organize your work using the table below, and then answer the questions that follow.
Answer:
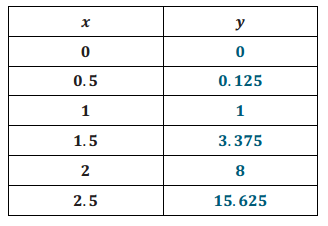
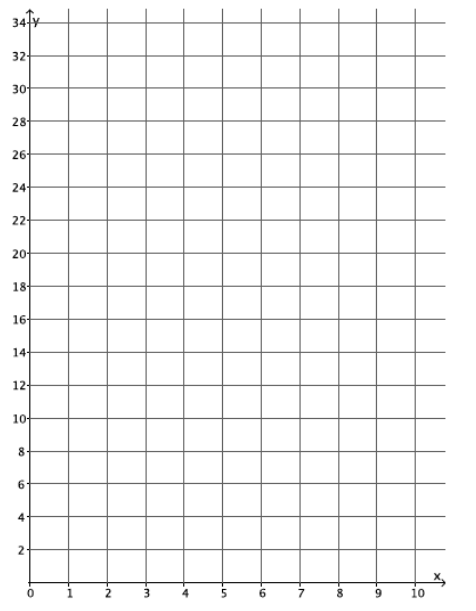
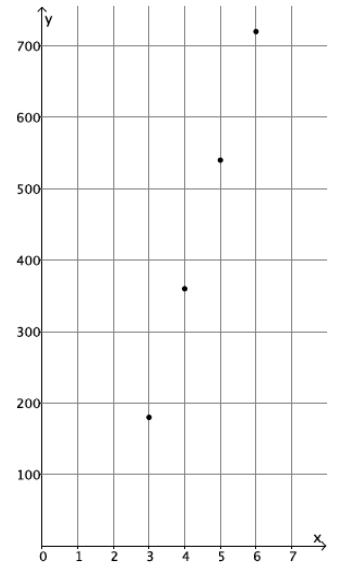
a. Plot the ordered pairs on the coordinate plane.
Answer:
b. What shape does the graph of the points appear to take?
Answer:
It appears to take the shape of a curve.
c. Is this the graph of a linear function? Explain.
Answer:
No, this is not the graph of a linear function. The equation y = x3 is not a linear equation.
d. Consider the function that assigns to each positive real number s the volume V of a cube with side length s units. An equation that describes this function is V = s3. What do you think the graph of this function will look like? Explain.
Answer:
I think the graph of this function will look like the graph of the equation y = x3. The inputs and outputs would match the solutions to the equation exactly. For
the equation, the y-value is the cube of the x-value.
For the function, the output is the cube of the input.
e. Use the function in part (d) to determine the volume of a cube with side length of 3 units. Write the input and output as an ordered pair. Does this point appear to belong to the graph of y = x3?
Answer:
V = (3)3
V = 27
(3, 27) The point looks like it would belong to the graph of y = x3; it looks like it would be on the curve that the shape of the graph is taking.
Question 3.
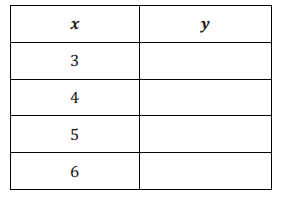
Sketch the graph of the equation y = 180(x – 2) for whole numbers. Organize your work using the table below, and then answer the questions that follow.
Answer:
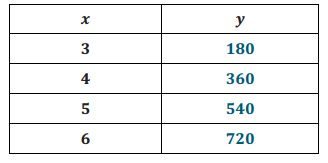
a. Plot the ordered pairs on the coordinate plane.
Answer:
b. What shape does the graph of the points appear to take?
Answer:
It appears to take the shape of a line.
c. Is this graph a graph of a function? How do you know?
Answer:
It appears to be a function because each input has exactly one output.
d. Is this a linear equation? Explain.
Answer:
Yes, y = 180(x – 2) is a linear equation. It can be rewritten as y = 180x-360.
e. The sum S of interior angles, in degrees, of a polygon with n sides is given by S = 180(n-2). If we take this equation as defining S as a function of n, how do you think the graph of this S will appear? Explain.
Answer:
I think the graph of this function will look like the graph of the equation y = 180(x-2). The inputs and outputs would match the solutions to the equation exactly.
f. Is this function discrete? Explain.
Answer:
The function S = 180(n – 2) is discrete. The inputs are the number of sides, which are integers. The input, n, must be greater than 2 since three sides is the smallest number of sides for a polygon.
Question 4.
Examine the graph below. Could the graph represent the graph of a function? Explain why or why not.
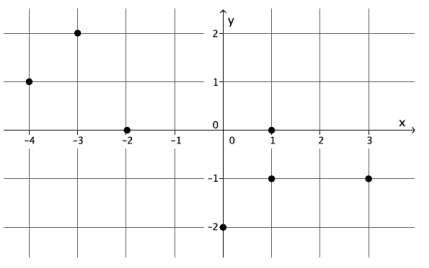
Answer:
This is not the graph of a function. The ordered pairs (1, 0) and (1, -1) show that for the input of 1 there are two different outputs, both 0 and -1. For that reason, this cannot be the graph of a function because it does not fit the definition of a function.
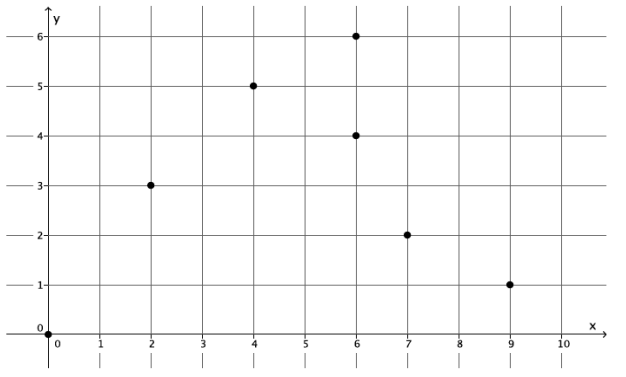
Question 5.
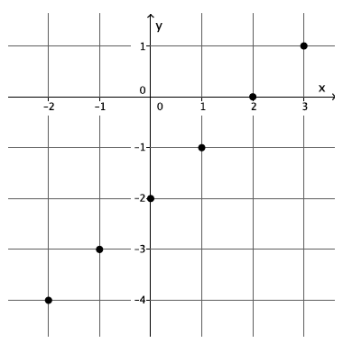
Examine the graph below. Could the graph represent the graph of a function? Explain why or why not.
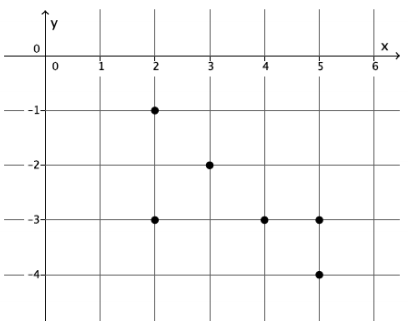
Answer:
This is not the graph of a function. The ordered pairs (2, -1) and (2, -3) show that for the input of 2 there are two different outputs, both -1 and -3. Further, the ordered pairs (5, -3) and (5, -4) show that for the input of 5 there are two different outputs, both -3 and -4. For these reasons, this cannot be the graph of a function because it does not fit the definition of a function.
Question 6.
Examine the graph below. Could the graph represent the graph of a function? Explain why or why not.
Answer:
This is the graph of a function. The ordered pairs (-2, -4), (-1, -3), (0, -2), (1, -1), (2, 0), and (3, 1) represent inputs and their unique outputs. By definition, this is a function.
Eureka Math Grade 8 Module 5 Lesson 5 Exit Ticket Answer Key
Question 1.
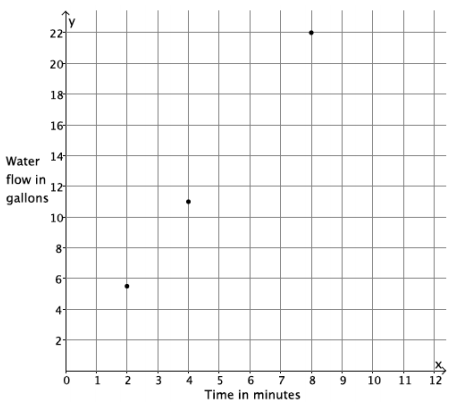
Water flows from a hose at a constant rate of 11 gallons every 4 minutes. The total amount of water that flows from the hose is a function of the number of minutes you are observing the hose.
a. Write an equation in two variables that describes the amount of water, y, in gallons, that flows from the hose as a function of the number of minutes, x, you observe it.
Answer:
\(\frac{11}{4}\) = \(\frac{y}{x}\)
y = \(\frac{11}{4}\) x
b. Use the equation you wrote in part (a) to determine the amount of water that flows from the hose during an 8-minute period, a 4-minute period, and a 2-minute period.
Answer:
y = \(\frac{11}{4}\) (8)
y = 22
In 8 minutes, 22 gallons of water flow out of the hose.
y = \(\frac{11}{4}\) (4)
y = 11
In 4 minutes, 11 gallons of water flow out of the hose.
y = \(\frac{11}{4}\) (2)
y = 5.5
In 2 minutes, 5.5 gallons of water flow out of the hose.
c. An input of the function, x, is time in minutes, and the output of the function, y, is the amount of water that flows out of the hose in gallons. Write the inputs and outputs from part (b) as ordered pairs, and plot them as points on the coordinate plane.
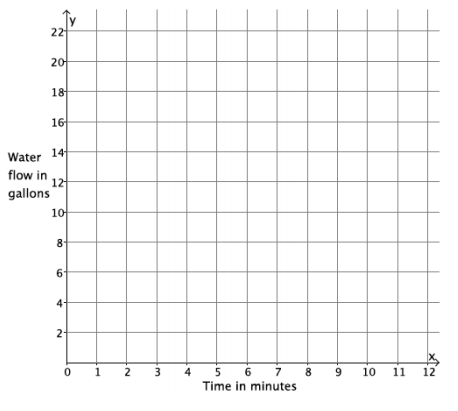
Answer:
(8, 22), (4, 11), (2, 5.5)