Engage NY Eureka Math 8th Grade Module 5 Lesson 8 Answer Key
Eureka Math Grade 8 Module 5 Lesson 8 Exploratory Challenge/Exercise Answer Key
Exercise 1.
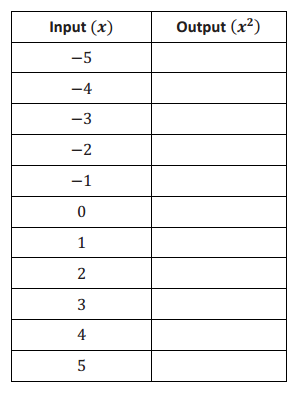
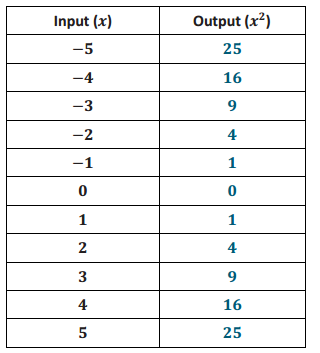
Consider the function that assigns to each number x the value x2.
a. Do you think the function is linear or nonlinear? Explain.
Answer:
I think the function is nonlinear. The equation describing the function is not of the form y = mx + b.
b. Develop a list of inputs and outputs for this function. Organize your work using the table below. Then, answer the questions that follow.
Answer:
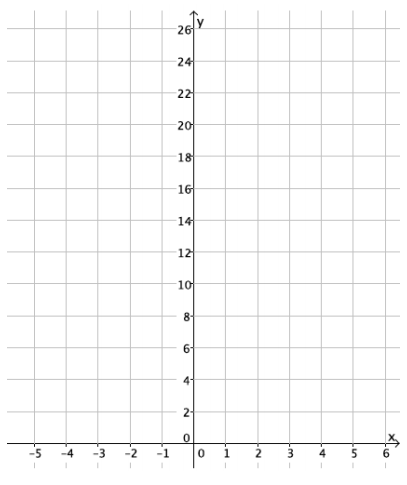
c. Plot the inputs and outputs as ordered pairs defining points on the coordinate plane.
Answer:
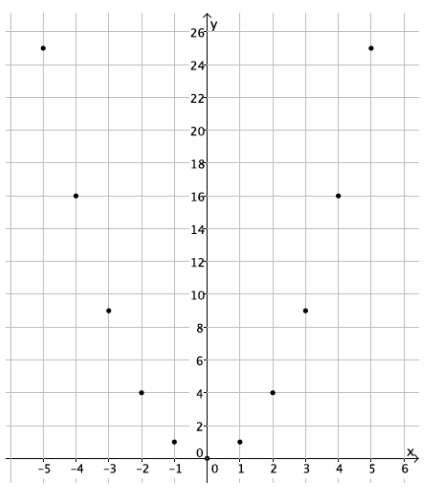
d. What shape does the graph of the points appear to take?
Answer:
It appears to take the shape of a curve.
e. Find the rate of change using rows 1 and 2 from the table above.
Answer:
\(\frac{25 – 16}{ – 5 – ( – 4)}\) = \(\frac{9}{ – 1}\) = – 9
f. Find the rate of change using rows 2 and 3 from the table above.
Answer:
\(\frac{16 – 9}{ – 4 – ( – 3)} = \) = \(\frac{7}{ – 1}\) = – 7
g. Find the rate of change using any two other rows from the table above.
Answer:
Student work will vary.
\(\frac{16 – 25}{4 – 5}\) = \(\frac{ – 9}{ – 1}\) = 9
h. Return to your initial claim about the function. Is it linear or nonlinear? Justify your answer with as many pieces of evidence as possible.
Answer:
This is definitely a nonlinear function because the rate of change is not a constant for different intervals of inputs. Also, we would expect the graph of a linear function to be a set of points in a line, and this graph is not a line. As was stated before, the expression x2 is nonlinear.
Exercise 2.
Consider the function that assigns to each number x the value x3.
a. Do you think the function is linear or nonlinear? Explain.
Answer:
I think the function is nonlinear. The equation describing the function is not of the form y = mx + b.
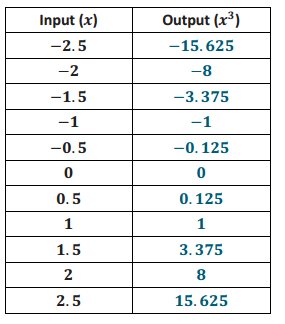
b. Develop a list of inputs and outputs for this function. Organize your work using the table below. Then, answer the questions that follow.
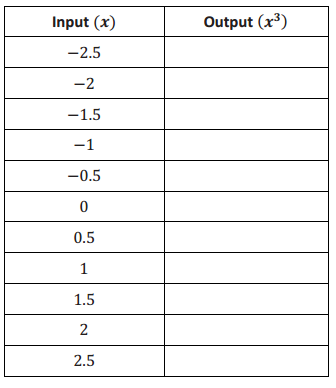
Answer:
c. Plot the inputs and outputs as ordered pairs defining points on the coordinate plane.
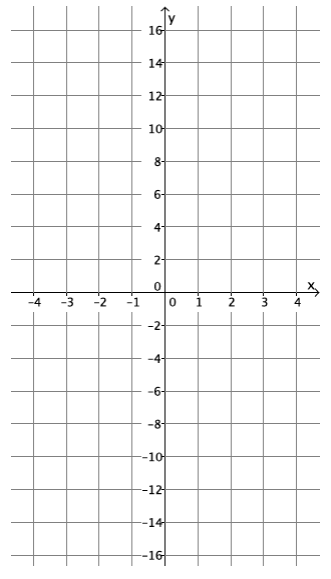
Answer:
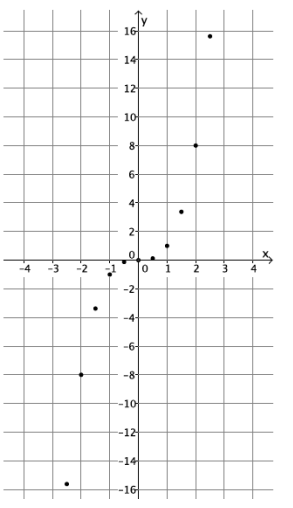
d. What shape does the graph of the points appear to take?
Answer:
It appears to take the shape of a curve.
e. Find the rate of change using rows 2 and 3 from the table above.
Answer:
\(\frac{ – 8 – ( – 3.375)}{ – 2 – ( – 1.5)}\) = \(\frac{ – 4.625}{ – 0.5}\) = 9.25
f. Find the rate of change using rows 3 and 4 from the table above.
Answer:
\(\frac{ – 3.375 – ( – 1)}{ – 1.5 – ( – 1)}\) = \(\frac{ – 2.375}{ – 0.5}\) = 4.75
g. Find the rate of change using rows 8 and 9 from the table above.
Answer:
\(\frac{1 – 3.375}{1 – 1.5}\) = \(\frac{ – 2.375}{ – 0.5}\) = 4.75
h. Return to your initial claim about the function. Is it linear or nonlinear? Justify your answer with as many pieces of evidence as possible.
Answer:
This is definitely a nonlinear function because the rate of change is not a constant for any interval of inputs. Also, we would expect the graph of a linear function to be a line, and this graph is not a line. As was stated before, the expression x3 is nonlinear.
Exercise 3.
Consider the function that assigns to each positive number x the value \(\frac{1}{x}\).
a. Do you think the function is linear or nonlinear? Explain.
Answer:
I think the function is nonlinear. The equation describing the function is not of the form y = mx + b.
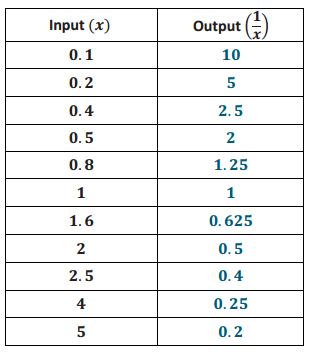
b. Develop a list of inputs and outputs for this function. Organize your work using the table below. Then, answer the questions that follow.
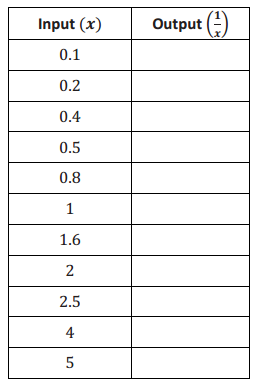
Answer:
c. Plot the inputs and outputs as ordered pairs defining points on the coordinate plane.
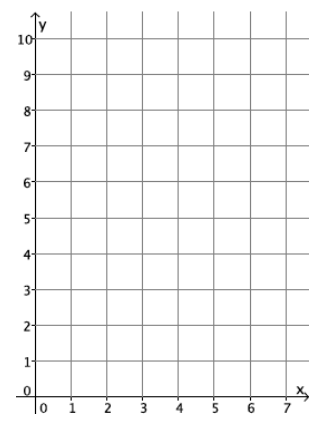
Answer:
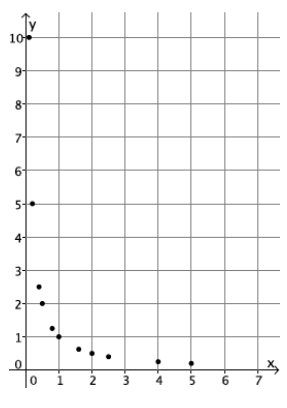
d. What shape does the graph of the points appear to take?
Answer:
It appears to take the shape of a curve.
e. Find the rate of change using rows 1 and 2 from the table above.
Answer:
\(\frac{10 – 5}{0.1 – 0.2}\) = \(\frac{5}{ – 0.1}\) = – 50
f. Find the rate of change using rows 2 and 3 from the table above.
Answer:
\(\frac{5 – 2.5}{0.2 – 0.4}\) = \(\frac{2.5}{ – 0.2}\) = – 12.5
g. Find the rate of change using any two other rows from the table above.
Answer:
Student work will vary.
\(\frac{1 – 0.625}{1 – 1.6}\) = \(\frac{0.375}{ – 0.6}\) = – 0.625
h. Return to your initial claim about the function. Is it linear or nonlinear? Justify your answer with as many pieces of evidence as possible.
Answer:
This is definitely a nonlinear function because the rate of change is not a constant for any interval of inputs. Also, we would expect the graph of a linear function to be a line, and this graph is not a line. As was stated before, the expression \(\frac{1}{x}\) is nonlinear.
Exercises 4–10
In each of Exercises 4–10, an equation describing a rule for a function is given, and a question is asked about it. If necessary, use a table to organize pairs of inputs and outputs, and then plot each on a coordinate plane to help answer the question.
Exercise 4.
What shape do you expect the graph of the function described by y = x to take? Is it a linear or nonlinear function?
Answer:
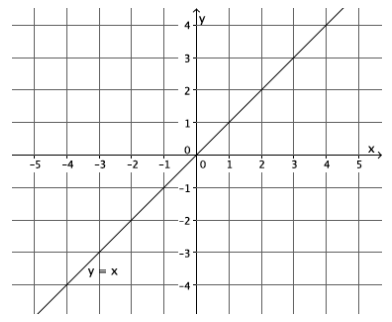
I expect the shape of the graph to be a line. This function is a linear function described by the linear equation y = x. The graph of this function is a line.
Exercise 5.
What shape do you expect the graph of the function described by y = 2x2 – x to take? Is it a linear or nonlinear function?
Answer:
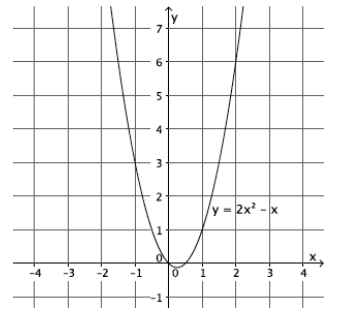
I expect the shape of the graph to be something other than a line. This function is nonlinear because its graph is not a line. Also the equation describing the function is not of the form y = mx + b. It is not linear.
Exercise 6.
What shape do you expect the graph of the function described by 3x + 7y = 8 to take? Is it a linear or nonlinear function?
Answer:
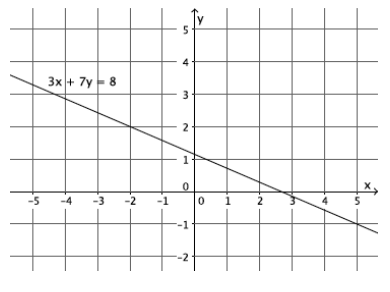
I expect the shape of the graph to be a line. This function is a linear function described by the linear equation 3x + 7y = 8. The graph of this function is a line. (We have y = – \(\frac{3}{7}\) x + \(\frac{8}{7}\).)
Exercise 7.
What shape do you expect the graph of the function described by y = 4x3 to take? Is it a linear or nonlinear function?
Answer:
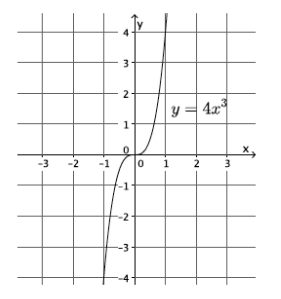
I expect the shape of the graph to be something other than a line. This function is nonlinear because its graph is not a line. Also the equation describing the function is not of the form y = mx + b. It is not linear.
Exercise 8.
What shape do you expect the graph of the function described by \(\frac{3}{x}\) = y to take? Is it a linear or nonlinear function? (Assume that an input of x = 0 is disallowed.)
Answer:
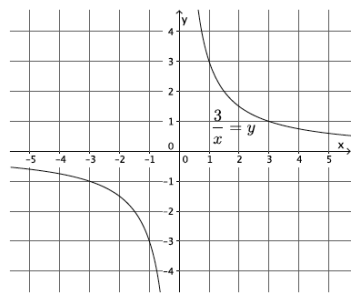
I expect the shape of the graph to be something other than a line. This function is nonlinear because its graph is not a line. Also the equation describing the function is not of the form y = mx + b. It is not linear.
Exercise 9.
What shape do you expect the graph of the function described by \(\frac{4}{x^{2}}\) = y to take? Is it a linear or nonlinear function? (Assume that an input of x = 0 is disallowed.)
Answer:
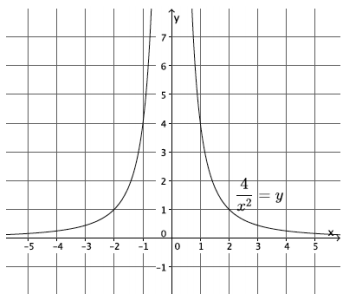
I expect the shape of the graph to be something other than a line. This function is nonlinear because its graph is not a line. Also the equation describing the function is not of the form y = mx + b. It is not linear.
Exercise 10.
What shape do you expect the graph of the equation x2 + y2 = 36 to take? Is it a linear or nonlinear function? Is it a function? Explain.
Answer:
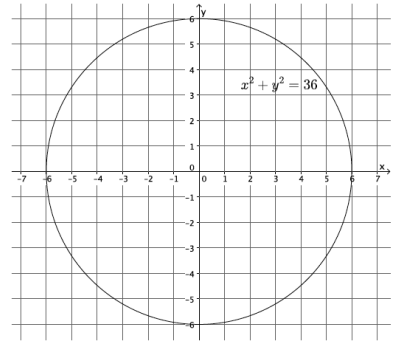
I expect the shape of the graph to be something other than a line. It is nonlinear because its graph is not a line. It is not a function because there is more than one output for any given value of x in the interval ( – 6, 6). For example, at x = 0 the y – value is both 6 and – 6. This does not fit the definition of function because functions assign to each input exactly one output. Since there is at least one instance where an input has two outputs, it is not a function.
Eureka Math Grade 8 Module 5 Lesson 8 Problem Set Answer Key
Question 1.
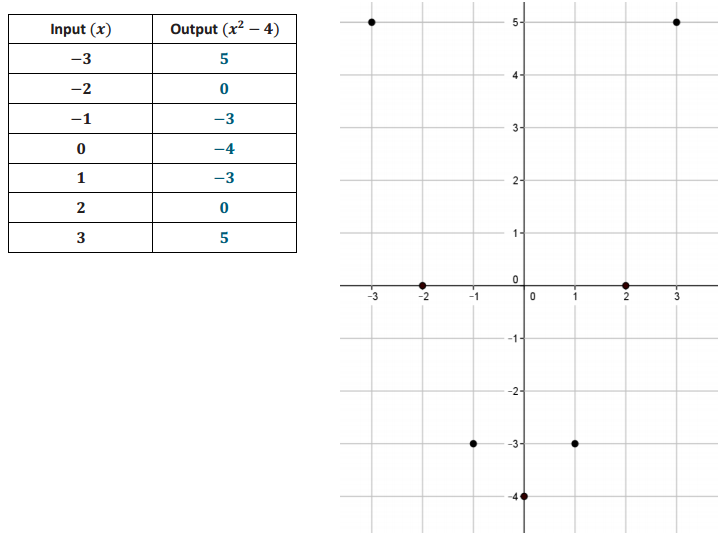
Consider the function that assigns to each number x the value x2 – 4.
a. Do you think the function is linear or nonlinear? Explain.
Answer:
The equation describing the function is not of the form y = mx + b. It is not linear.
b. Do you expect the graph of this function to be a straight line?
Answer:
No
c. Develop a list of inputs and matching outputs for this function. Use them to begin a graph of the function.
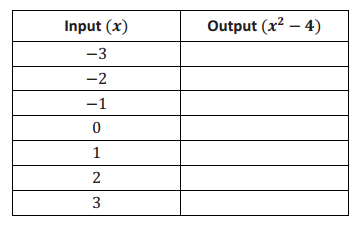
Answer:
Question 2.
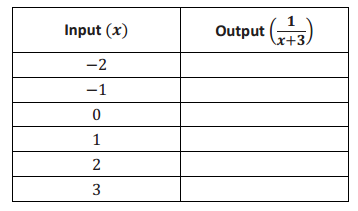
Consider the function that assigns to each number x greater than – 3 the value \(\frac{1}{x + 3}\).
a. Is the function linear or nonlinear? Explain.
Answer:
The equation describing the function is not of the form y = mx + b. It is not linear.
b. Do you expect the graph of this function to be a straight line?
Answer:
No
c. Develop a list of inputs and matching outputs for this function. Use them to begin a graph of the function.
Answer:
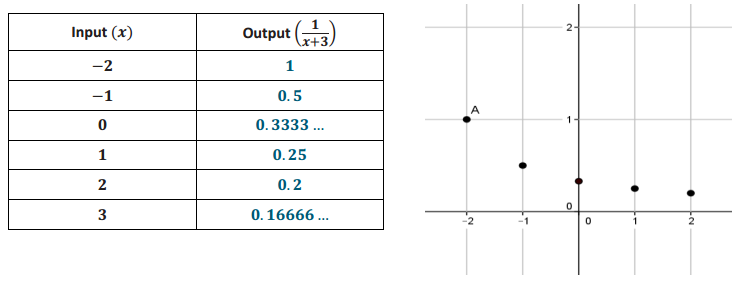
d. Was your prediction to (b) correct?
Answer:
Yes, the graph appears to be taking the shape of some type of curve.
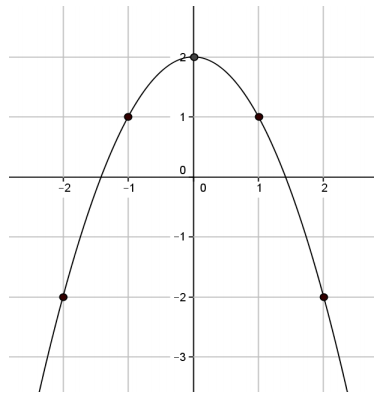
Question 3.
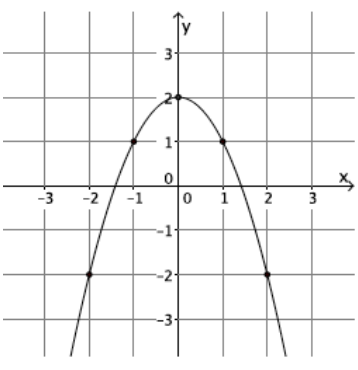
a. Is the function represented by this graph linear or nonlinear? Briefly justify your answer.
Answer:
The graph is clearly not a straight line, so the function is not linear.
b. What is the average rate of change for this function from an input of x = – 2 to an input of x = – 1?
Answer:
\(\frac{ – 2 – 1}{ – 2 – ( – 1)}\) = \(\frac{ – 3}{ – 1}\) = 3
c. What is the average rate of change for this function from an input of x = – 1 to an input of x = 0?
Answer:
\(\frac{1 – 2}{ – 1 – 0}\) = \(\frac{ – 1}{ – 1}\) = 1
As expected, the average rate of change of this function is not constant.
Eureka Math Grade 8 Module 5 Lesson 8 Exit Ticket Answer Key
Question 1.
The graph below is the graph of a function. Do you think the function is linear or nonlinear? Briefly justify your answer.
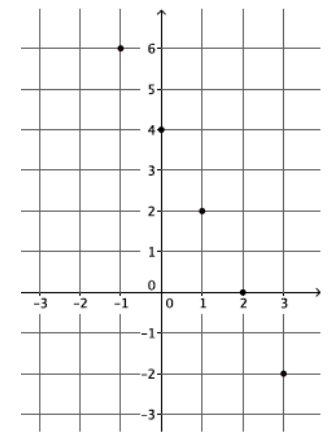
Answer:
Student work may vary. The plot of this graph appears to be a straight line, and so the function is linear.
Question 2.
Consider the function that assigns to each number x the value \(\frac{1}{2}\) x2. Do you expect the graph of this function to be a straight line? Briefly justify your answer.
Answer:
The equation is nonlinear (not of the form y = mx + b), so the function is nonlinear. Its graph will not be a straight line.