Engage NY Eureka Math 8th Grade Module 6 Lesson 13 Answer Key
Eureka Math Grade 8 Module 6 Lesson 13 Exercise Answer Key
Exercises 1–8
On an upcoming field day at school, the principal wants to provide ice cream during lunch. She offers three flavors: chocolate, strawberry, and vanilla. She selected your class to complete a survey to help her determine how much of each flavor to buy.
Exercise 1.
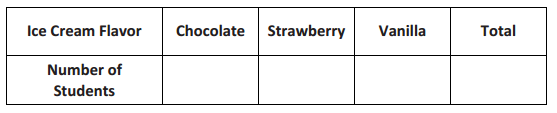
Answer the following question. Wait for your teacher to count how many students selected each flavor.
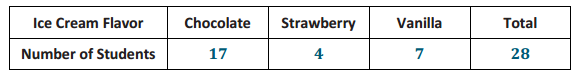
Then, record the class totals for each flavor in the table below.
“Which of the following three ice cream flavors is your favorite: chocolate, strawberry, or vanilla?”
Answer:
Answers will vary. One possibility is shown below.
Exercise 2.
Which ice cream flavor do most students prefer?
Answer:
Students should respond with the most-selected flavor. For the data set shown here, that is chocolate.
Exercise 3.
Which ice cream flavor do the fewest students prefer?
Answer:
Students should respond with the least-selected flavor. For the data set shown here, that is strawberry.
Exercise 4.
What percentage of students preferred each flavor? Round to the nearest tenth of a percent.
Answer:
Answers will vary based on the data gathered in Exercise 1.
Chocolate: \(\frac{17}{28}\) ≈ 60.7%
Strawberry: \(\frac{4}{28}\) ≈ 14.3%
Vanilla: \(\frac{7}{28}\) = 25%
Exercise 5.
Do the numbers in the table in Exercise 1 summarize data on a categorical variable or a numerical variable?
Answer:
The numbers in this table summarize data on a categorical variable—the preferred flavor of ice cream.
Exercise 6.
Do the students in your class represent a random sample of all the students in your school? Why or why not? Discuss this with your neighbor.
Answer:
No, because there is no indication that the students were selected randomly.
Exercise 7.
Is your class representative of all the other classes at your school? Why or why not? Discuss this with your neighbor.
Answer:
This class might be representative of the other eighth-grade classes but might not be representative of sixth- and seventh-grade classes.
Exercise 8.
Do you think the principal will get an accurate estimate of the proportion of students who prefer each ice cream flavor for the whole school using only your class? Why or why not? Discuss this with your neighbor.
Answer:
It is unlikely to give a good estimate. It would depend on how representative the class is of all of the students at the school.
Example 1
Students in a different class were asked the same question about their favorite ice cream flavors. The table below shows the ice cream flavors and the number of students who chose each flavor for that particular class. This table is called a one-way frequency table because it shows the counts of a univariate categorical variable.
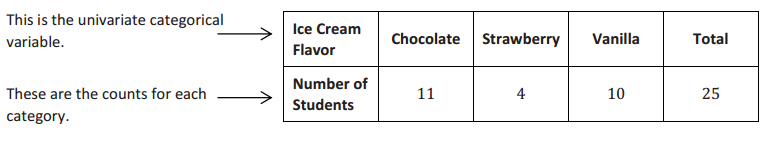
We compute the relative frequency for each ice cream flavor by dividing the count by the total number of observations.
relative frequency = \(\frac{\text { count for a category }}{\text { total number of observations }}\)
Since 11 out of 25 students answered chocolate, the relative frequency would be \(\frac{11}{25}\) = 0.44. This relative frequency shows that 44% of the class prefers chocolate ice cream. In other words, the relative frequency is the proportional value that each category is of the whole.
Exercises 9–10
Use the table for the preferred ice cream flavors from the class in Example 1 to answer the following questions.
Exercise 9.
What is the relative frequency for the category strawberry?
Answer:
Relative frequency = \(\frac{4}{25}\) = 0.16
Exercise 10.
Write a sentence interpreting the relative frequency value in the context of strawberry ice cream preference.
Answer:
16% of the students in this class prefer strawberry ice cream.
Example 2.
The principal also wondered if boys and girls have different favorite ice cream flavors. She decided to redo the survey by taking a random sample of students from the school and recording both their favorite ice cream flavors and their genders. She asked the following two questions:
“Which of the following ice cream flavors is your favorite: chocolate, strawberry, or vanilla?”
“What is your gender: male or female?”
The results of the survey are as follows:
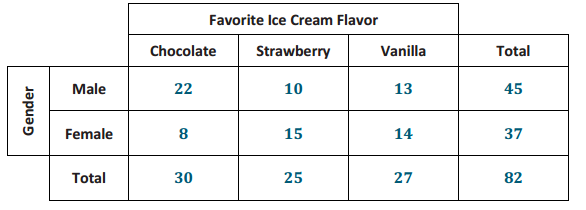
Of the 30 students who prefer chocolate ice cream, 22 are males.
Of the 25 students who prefer strawberry ice cream, 15 are females.
Of the 27 students who prefer vanilla ice cream, 13 are males.
The values of two variables, which were ice cream flavor and gender, were recorded in this survey. Since both of the variables are categorical, the data are bivariate categorical data.
Exercises 11–17
Exercise 11.
Can we display these data in a one-way frequency table? Why or why not?
Answer:
No, a one-way frequency table is for univariate data. Here we have bivariate data, so we would need to use a two-way table.
Exercise 12.
Summarize the results of the second survey of favorite ice cream flavors in the following table:
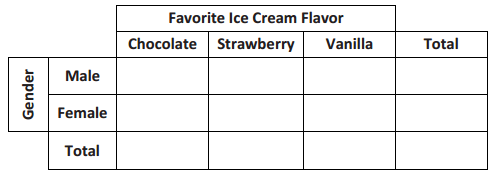
Answer:
Exercise 13.
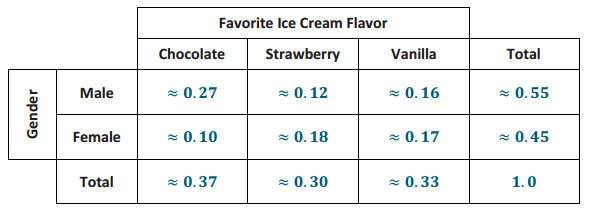
Calculate the relative frequencies of the data in the table in Exercise 12, and write them in the following table.
Answer:
Use the relative frequency values in the table to answer the following questions:
Exercise 14.
What is the proportion of the students who prefer chocolate ice cream?
Answer:
0.37
Exercise 15.
What is the proportion of students who are female and prefer vanilla ice cream?
Answer:
0.17
Exercise 16.
Write a sentence explaining the meaning of the approximate relative frequency 0.55.
Answer:
Approximately 55% of students responding to the survey are males.
Exercise 17.
Write a sentence explaining the meaning of the approximate relative frequency 0.10.
Answer:
Approximately 10% of students responding to the survey are females who prefer chocolate ice cream.
Example 3.
In the previous exercises, you used the total number of students to calculate relative frequencies. These relative frequencies were the proportion of the whole group who answered the survey a certain way. Sometimes we use row or column totals to calculate relative frequencies. We call these row relative frequencies or column relative frequencies.
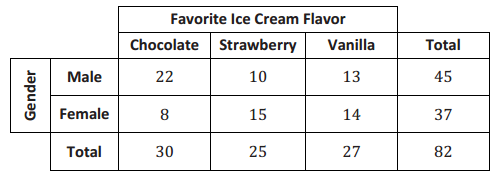
Below is the two-way frequency table for your reference. To calculate “the proportion of male students who prefer chocolate ice cream,” divide the 22 male students who preferred chocolate ice cream by the total of 45 male students. This proportion is \(\frac{22}{45}\) ≈ 0.49. Notice that you used the row total to make this calculation. This is a row relative frequency.
Exercises 18–22
In Exercise 13, you used the total number of students to calculate relative frequencies. These relative frequencies were the proportion of the whole group who answered the survey a certain way.
Exercise 18.
Suppose you are interested in the proportion of male students who prefer chocolate ice cream. How is this value different from “the proportion of students who are male and prefer chocolate ice cream”? Discuss this with your neighbor.
Answer:
The proportion of students who are male and prefer chocolate ice cream is \(\frac{22}{82}\) ≈ 0.27. This proportion uses all
82 students. The proportion of male students who prefer chocolate ice cream is \(\frac{22}{45}\) ≈ 0.49. This proportion uses only the 45 male students as its total.
Exercise 19.
Use the table provided in Example 3 to calculate the following relative frequencies.
a. What proportion of students who prefer vanilla ice cream are female?
\(\frac{14}{27}\) ≈ 0.52
b. What proportion of male students prefer strawberry ice cream? Write a sentence explaining the meaning of this proportion in the context of this problem.
Answer:
\(\frac{10}{45}\) ≈ 0.22 Twenty-two percent of male students in this survey prefer strawberry ice cream.
c. What proportion of female students prefer strawberry ice cream?
Answer:
\(\frac{15}{37}\) ≈ 0.41
d. What proportion of students who prefer strawberry ice cream are female?
Answer:
\(\frac{15}{25}\) ≈ 0.60
Exercise 20.
A student is selected at random from this school. What would you predict this student’s favorite ice cream to be? Explain why you chose this flavor.
Answer:
I would predict that the student’s favorite flavor is chocolate because more students chose chocolate in the survey.
Exercise 21.
Suppose the randomly selected student is male. What would you predict his favorite flavor of ice cream to be? Explain why you chose this flavor.
Answer:
I would predict his favorite flavor to be chocolate because more male students chose chocolate in the survey.
Exercise 22.
Suppose the randomly selected student is female. What would you predict her favorite flavor of ice cream to be? Explain why you chose this flavor.
Answer:
I would predict her favorite flavor to be strawberry because more female students chose strawberry in the survey.
Eureka Math Grade 8 Module 6 Lesson 13 Problem Set Answer Key
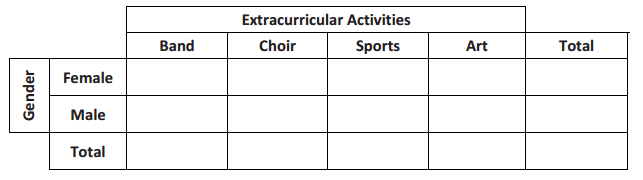
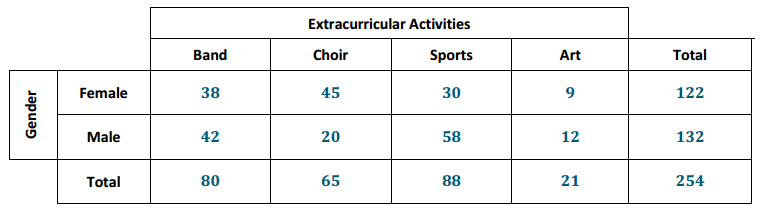
Every student at Abigail Douglas Middle School is enrolled in exactly one extracurricular activity. The school counselor recorded data on extracurricular activity and gender for all 254 eighth-grade students at the school.
The counselor’s findings for the 254 eighth-grade students are the following:
Of the 80 students enrolled in band, 42 are male.
Of the 65 students enrolled in choir, 20 are male.
Of the 88 students enrolled in sports, 30 are female.
Of the 21 students enrolled in art, 9 are female.
Question 1.
Complete the table below.
Answer:
Question 2.
Write a sentence explaining the meaning of the frequency 38 in this table.
Answer:
The frequency of 38 represents the number of eighth-grade students who are enrolled in band and are female.
Use the table provided above to calculate the following relative frequencies.
Question 3.
What proportion of students are male and enrolled in choir?
Answer:
\(\frac{20}{254}\) ≈ 0.08
Question 4.
What proportion of students are enrolled in a musical extracurricular activity (i.e., band or choir)?
Answer:
\(\frac{80+65}{254}\) ≈ 0.57
Question 5.
What proportion of male students are enrolled in sports?
Answer:
\(\frac{58}{132}\) ≈ 0.44
Question 6.
What proportion of students enrolled in sports are male?
Answer:
\(\frac{58}{88}\) ≈ 0.66
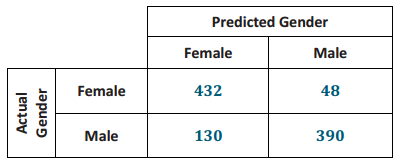
Pregnant women often undergo ultrasound tests to monitor their babies’ health. These tests can also be used to predict the gender of the babies, but these predictions are not always accurate. Data on the gender predicted by ultrasound and the actual gender of the baby for 1,000 babies are summarized in the two-way table below.
Question 7.
Write a sentence explaining the meaning of the frequency 130 in this table.
Answer:
The frequency of 130 represents the number of babies who were predicted to be female but were actually male (i.e., the ultrasound prediction was not correct for these babies).
Use the table provided above to calculate the following relative frequencies.
Question 8.
What is the proportion of babies who were predicted to be male but were actually female?
Answer:
\(\frac{48}{1000}\) = 0.048
Question 9.
What is the proportion of incorrect ultrasound gender predictions?
Answer:
\(\frac{130+48}{1000}\) = 0.178
Question 10.
For babies predicted to be female, what proportion of the predictions were correct?
Answer:
\(\frac{432}{562}\) ≈ 0.769
Question 11.
For babies predicted to be male, what proportion of the predictions were correct?
Answer:
\(\frac{390}{438}\) ≈ 0.890
Eureka Math Grade 8 Module 6 Lesson 13 Exit Ticket Answer Key
Question 1.
Explain what the term bivariate categorical data means.
Answer:
Bivariate categorical data means that the data set comprises data on two variables that are both categorical.
Question 2.
Explain how to calculate relative frequency. What is another word for relative frequency?
Answer:
Relative frequency is calculated by dividing a frequency by the total number of observations. Another word for relative frequency is proportion.
Question 3.
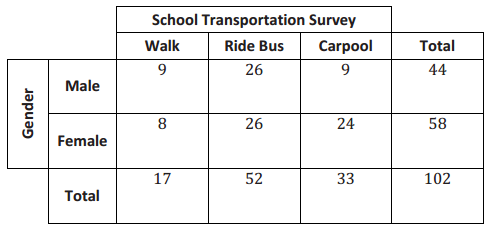
A random group of students are polled about how they get to school. The results are summarized in the table below.
Answer:
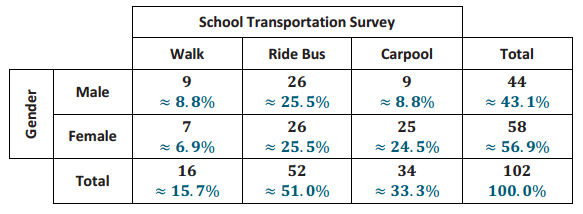
a. Calculate the relative frequencies for the table above. Write them as a percent in each cell of the table. Round to the nearest tenth of a percent.
Answer:
See the completed table above.
b. What is the relative frequency for the Carpool category? Write a sentence interpreting this value in the context of school transportation.
Answer:
The relative frequency is 0.333, or 33.3%. Approximately 33.3% of the students surveyed use a carpool to get to school.
c. What is the proportion of students who are female and walk to school? Write a sentence interpreting this value in the context of school transportation.
Answer:
The proportion is 0.069, or 6.9%. Approximately 6.9% of the students surveyed are female and walk to school.
d. A student is selected at random from this school. What would you predict this student’s mode of school transportation to be? Explain.
Answer:
I would predict the student would ride the bus because more students in the survey chose this mode of transportation.