Engage NY Eureka Math 8th Grade Module 6 Lesson 5 Answer Key
Eureka Math Grade 8 Module 6 Lesson 5 Exercise Answer Key
Exercises 1–2
Exercise 1.
In your own words, describe what is happening as Aleph is running during the following intervals of time.
a. 0 to 15 minutes
Answer:
Aleph runs 2 miles in 15 minutes.
b. 15 to 30 minutes
Answer:
Aleph runs another 2 miles in 15 minutes for a total of 4 miles.
c. 30 to 45 minutes
Answer:
Aleph runs another 2 miles in 15 minutes for a total of 6 miles.
d. 45 to 60 minutes
Answer:
Aleph runs another 2 miles in 15 minutes for a total of 8 miles.
Exercise 2.
In your own words, describe what is happening as Shannon is running during the following intervals of time.
a. 0 to 15 minutes
Answer:
Shannon runs 1.5 miles in 15 minutes.
b. 15 to 30 minutes
Answer:
Shannon runs another 0.6 mile in 15 minutes for a total of 2.1 miles.
c. 30 to 45 minutes
Answer:
Shannon runs another 0.5 mile in 15 minutes for a total of 2.6 miles.
d. 45 to 60 minutes
Answer:
Shannon runs another 0.4 mile in 15 minutes for a total of 3.0 miles.
Exercises 3–5
Exercise 3.
Different breeds of dogs have different growth rates. A large breed dog typically experiences a rapid growth rate from birth to age 6 months. At that point, the growth rate begins to slow down until the dog reaches full growth around 2 years of age.
a. Sketch a graph that represents the weight of a large breed dog from birth to 2 years of age.
Answer:
Answers will vary.
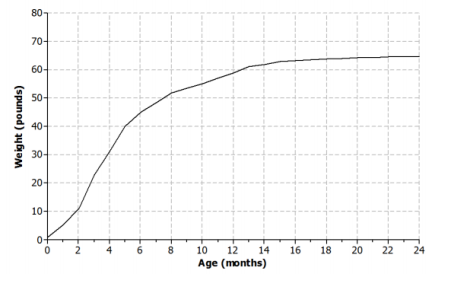
b. Is the function represented by the graph linear or nonlinear? Explain.
Answer:
The function is nonlinear because the growth rate is not constant.
c. Is the function represented by the graph increasing or decreasing? Explain.
Answer:
The function is increasing but at a decreasing rate. There is rapid growth during the first 6 months, and then the growth rate decreases.
Exercise 4.
Nikka took her laptop to school and drained the battery while typing a research paper. When she returned home, Nikka connected her laptop to a power source, and the battery recharged at a constant rate.
a. Sketch a graph that represents the battery charge with respect to time.
Answer:
Answers will vary.
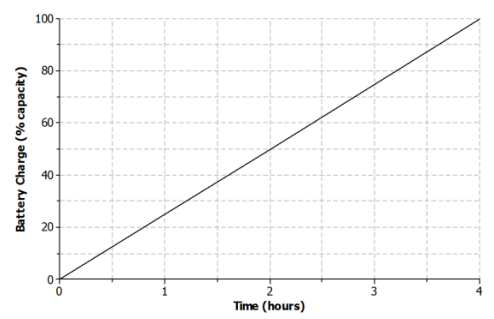
b. Is the function represented by the graph linear or nonlinear? Explain.
Answer:
The function is linear because the battery is recharging at a constant rate.
c. Is the function represented by the graph increasing or decreasing? Explain.
Answer:
The function is increasing because the battery is being recharged.
Exercise 5.
The long jump is a track-and-field event where an athlete attempts to leap as far as possible from a given point. Mike Powell of the United States set the long jump world record of 8.95 meters (29.4 feet) during the 1991 World Championships in Tokyo, Japan.
a. Sketch a graph that represents the path of a high school athlete attempting the long jump.
Answer:
Answers will vary
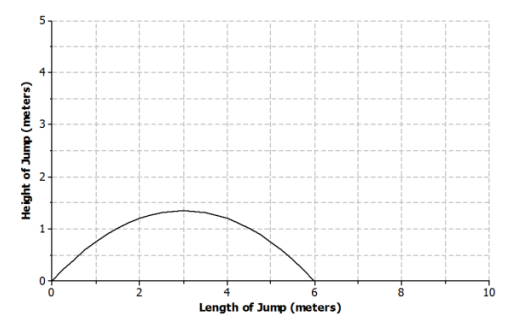
b. Is the function represented by the graph linear or nonlinear? Explain.
Answer:
The function is nonlinear. The rate of change is not constant.
c. Is the function represented by the graph increasing or decreasing? Explain.
Answer:
The function both increases and decreases over different intervals. The function increases as the athlete begins the jump and reaches a maximum height. The function decreases after the athlete reaches maximum height and begins descending back toward the ground.
Exercises 6–9
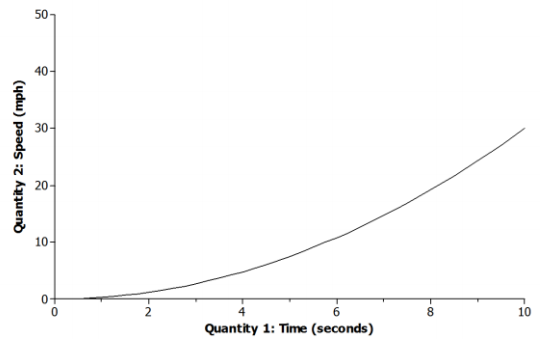
Exercise 6.
Use the graph from Example 3 to answer the following questions.
a. Is the function represented by the graph linear or nonlinear?
Answer:
The function is nonlinear. The rate of change is not constant.
b. Where is the function increasing? What does this mean within the context of the problem?
Answer:
The function is increasing during the following intervals of time: 0 to 4 seconds, 8 to 12 seconds, 16 to 20 seconds, 24 to 28 seconds, and 32 to 36 seconds. It means that Lamar and his sister are rising in the air.
c. Where is the function decreasing? What does this mean within the context of the problem?
Answer:
The function is decreasing during the following intervals of time: 4 to 8 seconds, 12 to 16 seconds, 20 to 24 seconds, 28 to 32 seconds, and 36 to 40 seconds. Lamar and his sister are traveling back down toward the ground.
Exercise 7.
How high above the ground is the platform for passengers to get on the Ferris wheel? Explain your reasoning.
Answer:
The lowest point on the graph, which is at 5 feet, can represent the platform where the riders get on the Ferris wheel.
Exercise 8.
Based on the graph, how many revolutions does the Ferris wheel complete during the 40-second time interval? Explain your reasoning.
Answer:
The Ferris wheel completes 5 revolutions. The lowest points on the graph can represent Lamar and his sister at the beginning of a revolution or at the entrance platform of the Ferris wheel. So, one revolution occurs between 0 and 8 seconds, 8 and 16 seconds, 16 and 24 seconds, 24 and 32 seconds, and 32 and 40 seconds.
Exercise 9.
What is the diameter of the Ferris wheel? Explain your reasoning.
Answer:
The diameter of the Ferris wheel is 40 feet. The lowest point on the graph represents the base of the Ferris wheel, and the highest point on the graph represents the top of the Ferris wheel. The difference between the two values is 40 feet, which is the diameter of the wheel.
Eureka Math Grade 8 Module 6 Lesson 5 Problem Set Answer Key
Question 1.
Read through the following scenarios, and match each to its graph. Explain the reasoning behind your choice.
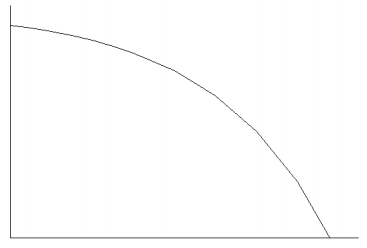
a. This shows the change in a smartphone battery charge as a person uses the phone more frequently.
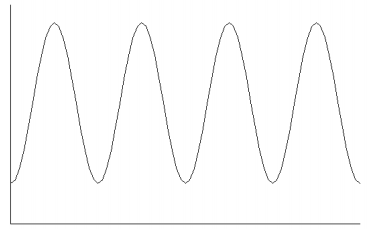
b. A child takes a ride on a swing.
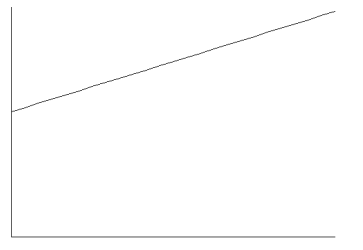
c. A savings account earns simple interest at a constant rate.
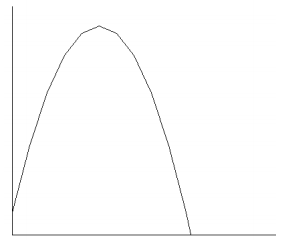
d. A baseball has been hit at a youth baseball game.
Scenario: ____
Answer:
Scenario: c
The savings account is earning interest at a constant rate, which means that the function is linear.
Scenario: ____
Answer:
Scenario: d
The baseball is hit into the air, reaches a maximum height, and falls back to the ground at a variable rate.
Scenario: ____
Answer:
Scenario: b
The distance from the ground increases as the child swings up into the air and then decreases as the child swings back down toward the ground.
Scenario: ____
Answer:
Scenario: a
The battery charge is decreasing as a person uses the phone more frequently.
Question 2.
The graph below shows the volume of water for a given creek bed during a 24-hour period. On this particular day, there was wet weather with a period of heavy rain.
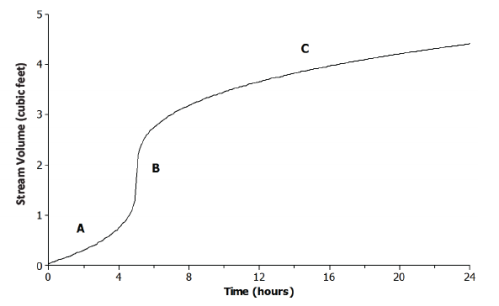
Describe how each part (A, B, and C) of the graph relates to the scenario.
Answer:
A: The rain begins, and the volume of water flowing in the creek bed begins to increase.
B: A period of heavy rain occurs, causing the volume of water to increase.
C: The heavy rain begins to subside, and the volume of water continues to increase.
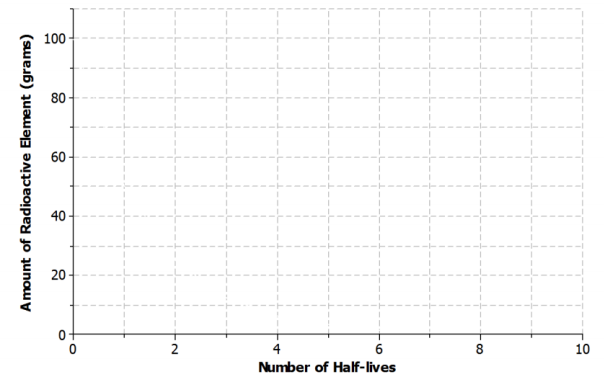
Question 3.
Half-life is the time required for a quantity to fall to half of its value measured at the beginning of the time period. If there are 100 grams of a radioactive element to begin with, there will be 50 grams after the first half-life, 25 grams after the second half-life, and so on.
a. Sketch a graph that represents the amount of the radioactive element left with respect to the number of half-lives that have passed.
Answer:
Answers will vary.
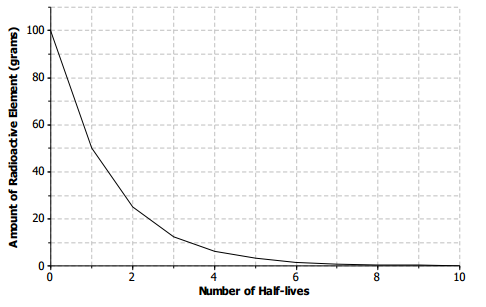
b. Is the function represented by the graph linear or nonlinear? Explain.
Answer:
The function is nonlinear. The rate of change is not constant with respect to time.
c. Is the function represented by the graph increasing or decreasing?
Answer:
The function is decreasing.
Question 4.
Lanae parked her car in a no-parking zone. Consequently, her car was towed to an impound lot. In order to release her car, she needs to pay the impound lot charges. There is an initial charge on the day the car is brought to the lot. However, 10% of the previous day’s charges will be added to the total charge for every day the car remains in the lot.
a. Sketch a graph that represents the total charges with respect to the number of days a car remains in the impound lot.
Answer:
Answers will vary.
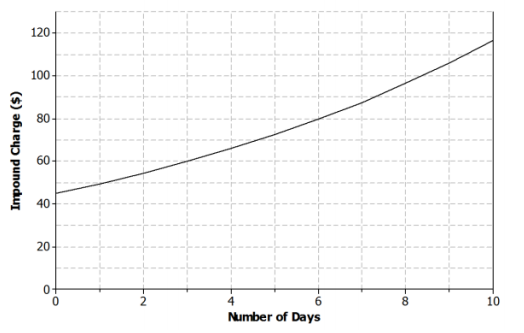
b. Is the function represented by the graph linear or nonlinear? Explain.
Answer:
The function is nonlinear. The function is increasing.
c. Is the function represented by the graph increasing or decreasing? Explain.
Answer:
The function is increasing. The total charge is increasing as the number of days the car is left in the lot increases.
Question 5.
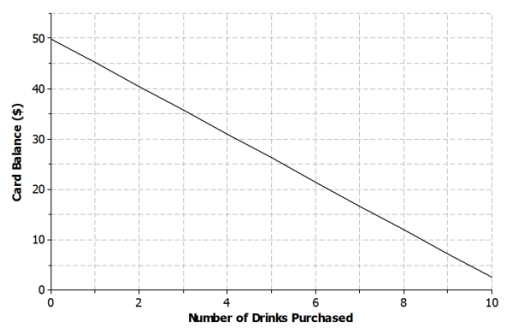
Kern won a $50 gift card to his favorite coffee shop. Every time he visits the shop, he purchases the same coffee drink.
a. Sketch a graph of a function that can be used to represent the amount of money that remains on the gift card with respect to the number of drinks purchased.
Answer:
Answers will vary.
b. Is the function represented by the graph linear or nonlinear? Explain.
Answer:
The function is linear. Since Kern purchases the same drink every visit, the balance is decreasing by the same amount or, in other words, at a constant rate of change.
c. Is the function represented by the graph increasing or decreasing? Explain.
Answer:
The function is decreasing. With each drink purchased, the amount of money on the card decreases.
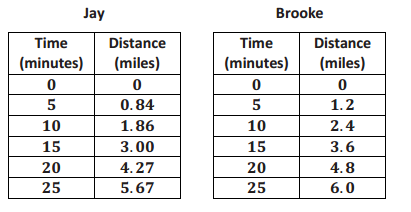
Question 6.
Jay and Brooke are racing on bikes to a park 8 miles away. The tables below display the total distance each person biked with respect to time.
a. Which person’s biking distance could be modeled by a nonlinear function? Explain.
Answer:
The distance that Jay biked could be modeled by a nonlinear function because the rate of change is not constant. The distance that Brooke biked could be modeled by a linear function because the rate of change is constant.
b. Who would you expect to win the race? Explain.
Answer:
Jay will win the race. The distance he bikes during each five-minute interval is increasing, while Brooke’s biking distance remains constant. If the trend remains the same, it is estimated that both Jay and Brooke will travel about 7.2 miles in 30 minutes. So, Jay will overtake Brooke during the last 5 minutes to win the race.
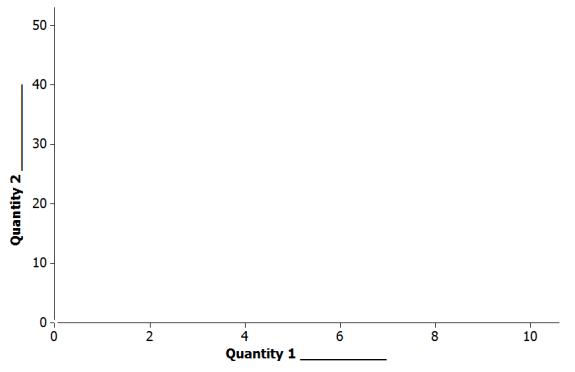
Question 7.
Using the axes in Problem 7(b), create a story about the relationship between two quantities.
a. Write a story about the relationship between two quantities. Any quantities can be used (e.g., distance and time, money and hours, age and growth). Be creative! Include keywords in your story such as increase and decrease to describe the relationship.
Answer:
Answers will vary.
A person in a car is at a red stoplight. The light turns green, and the person presses down on the accelerator with increasing pressure. The car begins to move and accelerate. The rate at which the car accelerates is
not constant.
b. Label each axis with the quantities of your choice, and sketch a graph of the function that models the relationship described in the story.
Answer:
Answers will vary based on the story from part (a).
Eureka Math Grade 8 Module 6 Lesson 5 Exit Ticket Answer Key
Question 1.
Lamar and his sister continue to ride the Ferris wheel. The graph below represents Lamar and his sister’s distance above the ground with respect to time during the next 40 seconds of their ride.
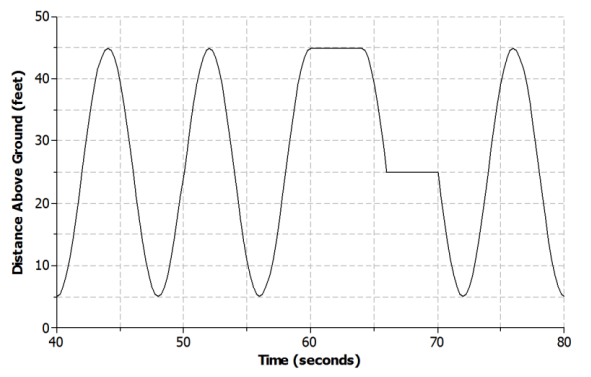
a. Name one interval where the function is increasing.
Answer:
The function is increasing during the following intervals of time: 40 to 44 seconds, 48 to 52 seconds, 56 to 60 seconds, and 72 to 76 seconds.
b. Name one interval where the function is decreasing.
Answer:
The function is decreasing during the following intervals of time: 44 to 48 seconds, 52 to 56 seconds, 64 to 66 seconds, 70 to 72 seconds, and 76 to 80 seconds.
c. Is the function linear or nonlinear? Explain.
Answer:
The function is both linear and nonlinear during different intervals of time. It is linear from 60 to 64 seconds and from 66 to 70 seconds. It is nonlinear from 40 to 60 seconds and from 70 to 80 seconds.
d. What could be happening during the interval of time from 60 to 64 seconds?
Answer:
The Ferris wheel is not moving during that time, so riders may be getting off or getting on.
e. Based on the graph, how many complete revolutions are made during this 40-second interval?
Answer:
Four revolutions are made during this time period.