Engage NY Eureka Math 8th Grade Module 6 Mid Module Assessment Answer Key
Eureka Math Grade 8 Module 6 Mid Module Assessment Task Answer Key
Question 1.
Many computers come with a Solitaire card game. The player moves cards in certain ways to complete specific patterns. The goal is to finish the game in the shortest number of moves possible, and a player’s score is determined by the number of moves. A statistics teacher played the game 16 times and recorded the number of moves and the final score after each game. The line represents the linear function that is used to determine the score from the number of moves.
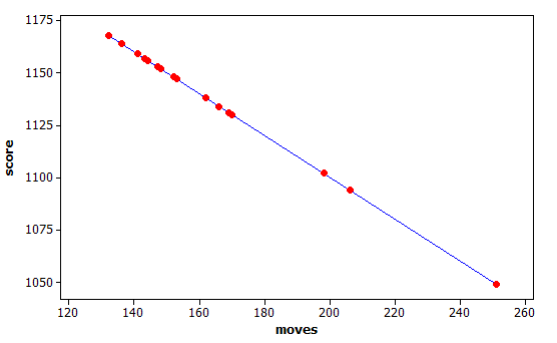
a. Was this person’s average score closer to 1130 or 1110? Explain how you decided.
Answer:
Most of the games had scores between 1125 and 1175. The mean score will be closer to 1130.
b. The first two games she played took 169 moves (1131 points) and 153 moves (1147 points). Based on this information, determine the equation of the linear function used by the computer to calculate the score from the number of moves. Explain your work.
Answer:
The difference in the scores is 1131 – 1147 or – 16.
The difference in the number of moves is 169 – 153 = 16
The slope is –\(\frac{16}{16}\) or – 1. This means that 1131 = intercept – 169, So intercept equals 1300
Score = 1300 – moves
c. Based on the linear function, each time the player makes a move, how many points does she lose?
Answer:
One point last per move.
d. Based on the linear function, how many points does the player start with in this game? Explain your reasoning.
Answer:
1300, or the score when the number of moves equals 0.
Question 2.
To save money, drivers often try to increase their mileage, which is measured in miles per gallon (mpg). One theory is that speed traveled impacts mileage. Suppose the following data are recorded for five different 300-mile tests, with the car traveling at different speeds in miles per hour (mph) for each test.
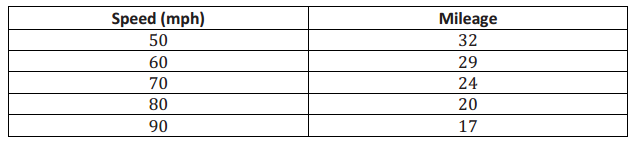
a. For the data in this table, is the association positive or negative? Explain how you decided.
Answer:
As the speed increases in miles per hour, the miles per gallon decrease. This describes a negative association.
b. Construct a scatter plot of these data using the following coordinate grid. The vertical axis represents the mileage, and the horizontal axis represents the speed in miles per hour (mph).
Answer:
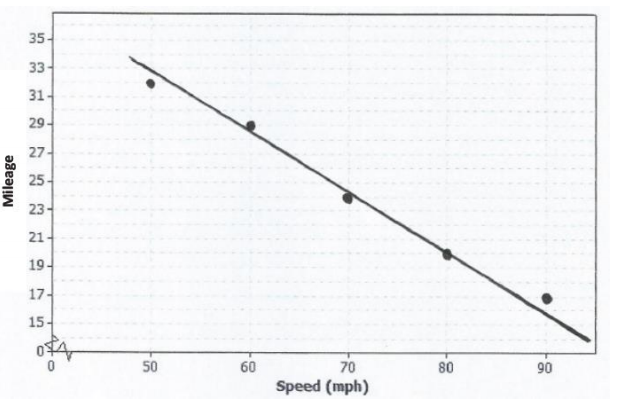
c. Draw a line on your scatter plot that you think is a reasonable model for predicting the mileage from the car speed.
Answer:
d. Estimate and interpret the slope of the line you found in part (c).
Answer:
Two points are approximately (80, 20) and (50, 33).
So, slope ≈ \(\frac{20-33}{80-50}\) ≈ – \(0.43 \overline{3}\)
Each increase of 1 mph in speed predicts a decrease of \(0.43 \overline{3}\) mpg.
Suppose additional data were measured for three more tests. These results have been added to the previous tests, and the combined data are shown in the table below.
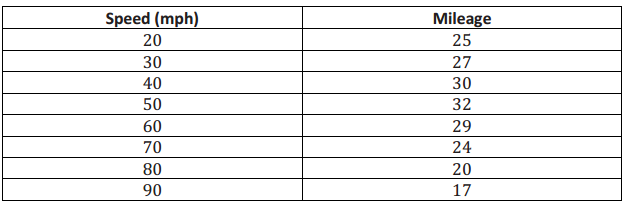
e. Does the association for these data appear to be linear? Why or why not?
Answer:
No, While the speeds increase, the milage value increase and then mostly decrease. There is no fixed rate of increase or decrease for milage based on increased speed.
f. If your only concern was mileage and you had no traffic constraints, what speed would you recommend traveling based on these data? Explain your choice.
Answer:
About 50 mph. It is around 50 mph that the mpg stops increasing and starts to decrease.