Engage NY Eureka Math Precalculus Module 4 Lesson 11 Answer Key
Eureka Math Precalculus Module 4 Lesson 11 Exercise Answer Key
Opening Exercise
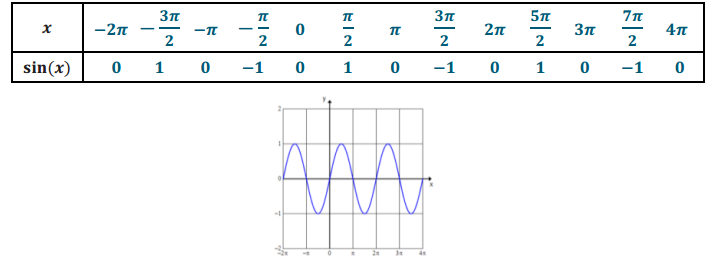
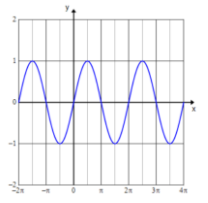
Graph each of the following functions on the interval – 2π ≤ x ≤ 4π by making a table of values. The graph should show all key features (intercepts, asymptotes, relative maxima and minima).
a. f(x) = sin(x)

Answer:
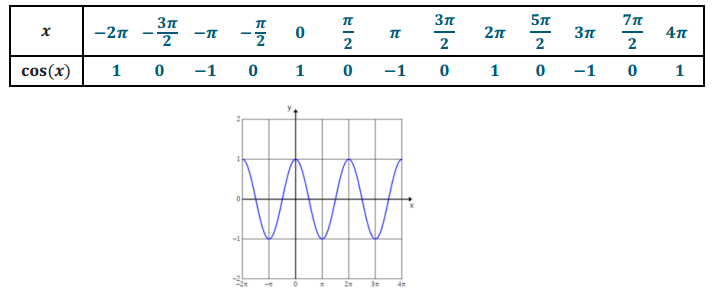
b. f(x) = cos(x)
Answer:

Answer:
Exploratory Challenge/Exercises 1–7
Exercise 1.
Consider the trigonometric function f(x) = tan(x).
a. Rewrite tan(x) as a quotient of trigonometric functions. Then, state the domain of the tangent function.
Answer:
f(x) = tan(x) = \(\frac{\sin (x)}{\cos (x)}\)
D: The set of all real numbers such that x≠\(\frac{\pi}{2}\) + kπ where k is an integer.
b. Why is this the domain of the function?
Answer:
Since (x) = tan(x) = \(\frac{\sin (x)}{\cos (x)}\), the domain cannot include a value of x that would make the cos(x) = 0.
c. Complete the table.
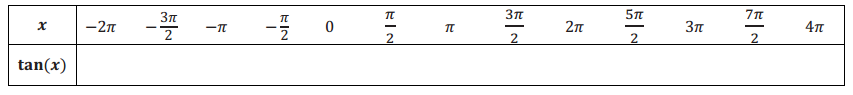
Answer:
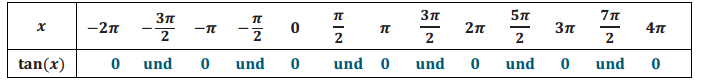
d. What will happen on the graph of f(x) = tan(x) at the values of x for which the tangent function is undefined?
Answer:
The graph will have vertical asymptotes.
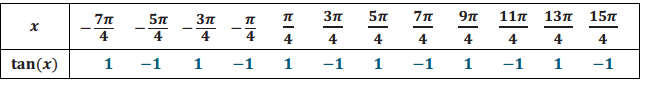
e. Expand the table to include angles that have a reference angle of \(\frac{\pi}{4}\).
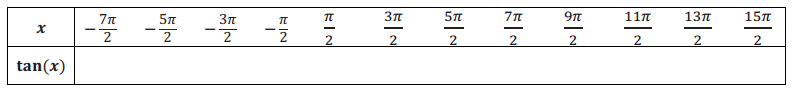
Answer:
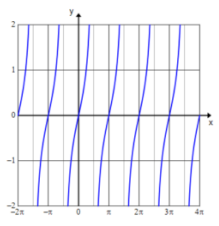
f. Sketch the graph of f(x) = tan(x) on the interval – 2π≤x≤4π. Verify by using a graphing utility.
Answer:
Exercise 2.
Use the graphs of the sine, cosine, and tangent functions to answer each of the following.
a. How do the graphs of the sine and cosine functions support the following identities for all real numbers x?
sin( – x) = – sin(x)
cos( – x) = cos(x)
Answer:
The graph of f(x) = sin(x) is symmetric with respect to the origin, which means that it is an odd function. Therefore, sin( – x) = – sin(x). The graph of f(x) = cos(x) is symmetric with respect to the y – axis, which means that it is an even function. Therefore, cos( – x) = – cos(x).
b. Use the symmetry of the graph of the tangent function to write an identity. Explain your answer.
Answer:
tan( – x) = – tan(x), x≠\(\frac{\pi}{2}\) + kπ where k is an integer
This is because tangent is an odd function, which can be seen by the fact that the graph of f(x) = tan(x) is symmetric with respect to the origin.
c. How do the graphs of the sine and cosine functions support the following identities for all real numbers x?
sin(x + 2π) = sin(x)
cos(x + 2π) = cos(x)
Answer:
Both the sine and cosine functions are periodic and have a period of 2π. Using the definition of a periodic function, which says that f(x + P) = f(x), it follows that sin(x + 2π) = sin(x) and cos(x + 2π) = cos(x) for all real numbers x.
d. Use the periodicity of the tangent function to write an identity. Explain your answer.
Answer:
The tangent function has a period of π. Therefore, tan(x + π) = tan(x) for all x≠\(\frac{\pi}{2}\) + kπ where k is an integer.
Exercise 3.
Consider the function f(x) = cos(x – π/2).
a. Graph y = f(x) by using transformations of functions.
Answer:
b. Based on your graph, write an identity.
Answer:
cos(x – \(\frac{\pi}{2}\)) = sin(x)
c. Verify the identity sin(x + \(\frac{\pi}{2}\)) = cos(x) for all real numbers x by using a graph.
Answer:
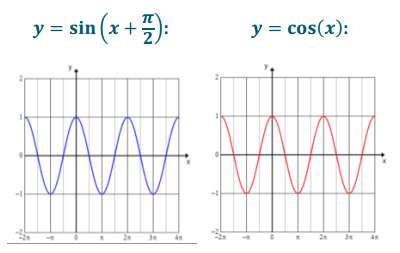
The graphs coincide, which illustrates that sin(x + \(\frac{\pi}{2}\)) = cos(x) for all real numbers x.
Exercise 5.
Use a graphing utility to explore the graphs of the family of functions in the form f(x) = A sin(ω(x – h)) + k. Write a summary of the effect that changing each parameter has on the graph of the sine function.
a. A
Answer:
The parameter A is a vertical scaling of the graph and affects the amplitude of the wave. The amplitude of the wave is equal to |A|. When A is negative, the graph is reflected across the x – axis.
b. ω
Answer:
The parameter ω is a horizontal scaling of the graph and affects the period of the wave. For positive values of ω, as ω increases, the period decreases, which causes the wave to repeat more often. The graph is compressed horizontally. For positive values of ω, as ω decreases, the period increases, which causes the wave to repeat less often. The graph is stretched horizontally. The period is equal to \(\frac{2 \pi}{\omega}\).
c. h
Answer:
The parameter h is the horizontal shift of the wave, also called the phase shift. For h > 0, the graph will shift right h units. For h<0, the graph will shift left h units. d. k Answer: The parameter k is the vertical shift of the wave. For k > 0, the graph will shift up k units. For k < 0, the graph will shift down k units. The midline of the wave is given by the equation y = k.
Exercise 3.
Graph at least one full period of the function f(x) = 3 sin(1\(\frac{1}{3}\) (x–π)) + 2. Label the amplitude, period, and midline on the graph.
Answer:
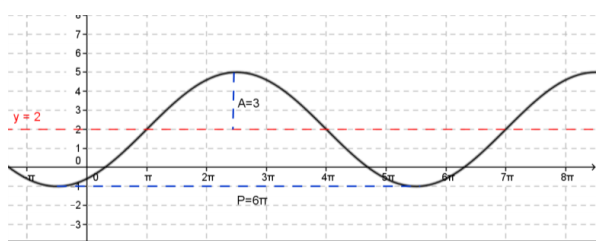
Amplitude = 3
Period = 6π
Midline: y = 2
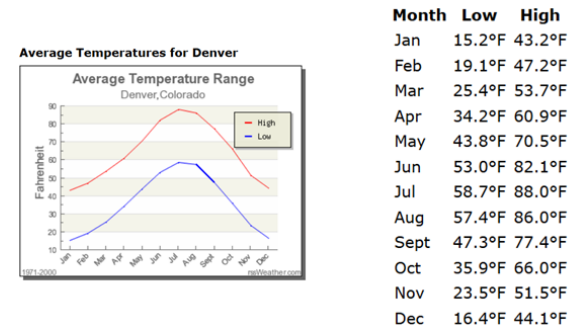
Exercise 7.
The graph and table below show the average monthly high and low temperature for Denver, Colorado.
(source: http://www.rssweather.com/climate/Colorado/Denver/)
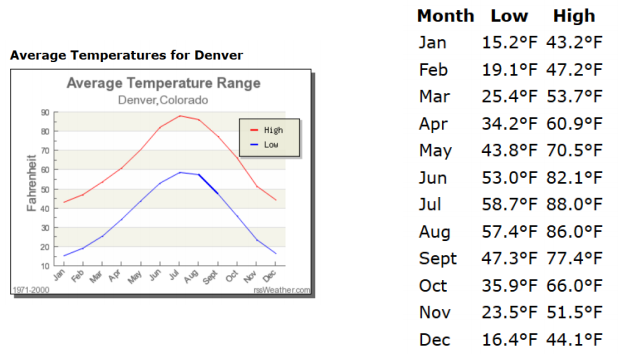
a. Why would a sinusoidal function be appropriate to model this data?
Answer:
The data is periodic, repeating every twelve months.
b. Write a function to model the average monthly high temperature as a function of the month.
Answer:
T(t) = 22.4 sin(\(\frac{\pi}{6}\) (t – 4)) + 65.6 where T(t) represents the average monthly high temperature and t represents the month (e.g., January would be represented by t = 1).
c. What does the midline represent within the context of the problem?
Answer:
The midline represents the mean average high temperature in Denver throughout the year.
d. What does the amplitude represent within the context of the problem?
Answer:
The amplitude represents how far from the mean the average highest and lowest temperatures vary throughout the year.
e. Name a city whose temperature graphs would have a smaller amplitude. Explain your reasoning.
Answer:
San Diego, CA would have a temperature graph with a smaller amplitude because the temperature does not vary much from the median throughout the year. The temperature from month to month stays relatively constant.
f. Name a city whose temperature graphs would have a larger vertical shift. Explain your reasoning.
Answer:
Miami, FL would have a temperature graph with a larger vertical shift because the average monthly high and low temperatures would be larger than in Denver. The median temperature would be greater, resulting in a larger vertical shift.
Eureka Math Precalculus Module 4 Lesson 11 Problem Set Answer Key
Question 1.
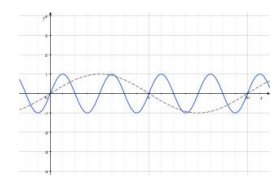
Sketch the graph of y = sin(x) on the same set of axes as the function f(x) = sin〖(4x)〗. Explain the similarities and differences between the two graphs.
Answer:
The solid curve shown is the graph of f(x) = sin(4x), and the dashed curve is the graph of y = sin(x). The graph of f is a horizontal scaling of the graph of the sine function by a factor of \(\frac{1}{4}\). The graph of f(x) = sin(4x) has a different period and frequency than the sine function, which changes the x – intercepts, the maximum and minimum points, and the increasing and decreasing intervals for the function. The amplitudes of the two graphs are the same, with |A| = 1.
Question 2.
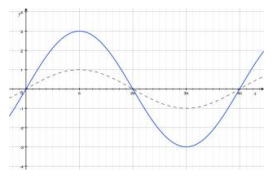
Sketch the graph of y = sin(\(\frac{x}{2}\)) on the same set of axes as the function g(x) = 3sin(\(\frac{x}{2}\)). Explain the similarities and differences between the two graphs.
Answer:
The dashed curve is the graph of y = sin(\(\frac{x}{2}\)), and the curve shown in blue is the graph of g(x) = 3sin(\(\frac{x}{2}\)). The graphs have different amplitudes. The graph of g is a vertical scaling of the graph of the sine function by a factor of 3. The y – coordinates of the maximum and minimum points are different for these two graphs. The two graphs have the same x – intercepts because the period of each function is 4π.
Question 3.
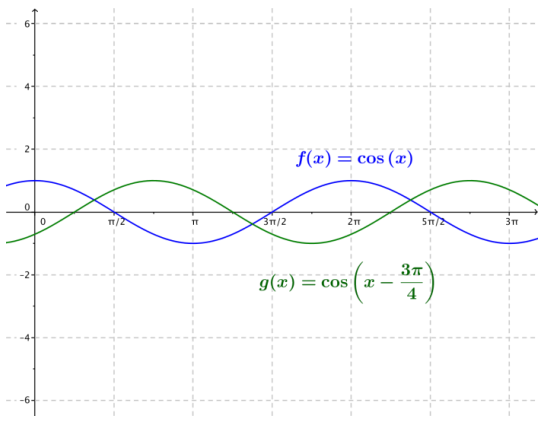
Indicate the amplitude, frequency, period, phase shift, horizontal and vertical translations, and equation of the midline. Graph the function on the same axes as the graph of the cosine function f(x) = cos(x). Graph at least one full period of each function.
g(x) = cos(x – \(\frac{3\pi}{4}\))
Answer:
The amplitude is 1, the frequency is \(\frac{1}{2 \pi}\), the period is 2π, and the phase shift is \(\frac{3\pi}{4}\). The horizontal translation is \(\frac{\pi}{3}\) units to the right, there is no vertical translation, and the equation of the midline is y = 0.
Question 4.
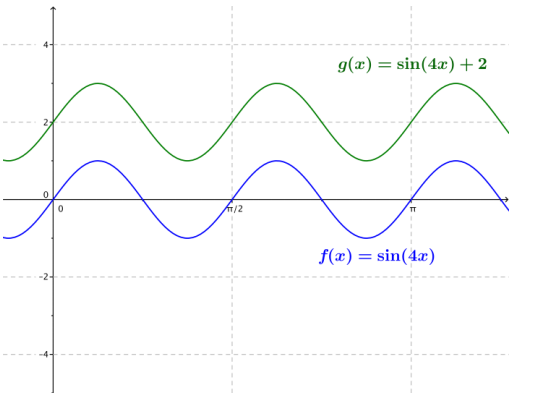
Sketch the graph of the pairs of functions on the same set of axes: f(x) = sin(4x), g(x) = sin(4x) + 2.
Answer:
Question 5.
The graph and table below show the average monthly high and low temperature for Denver, Colorado.
(source: http://www.rssweather.com/climate/Colorado/Denver/)
Write a function to model the average monthly low temperature as a function of the month.
Answer:
T(t) = 21.75 sin(\(\frac{\pi}{6}\) (t – 4.5)) + 36.95
Extension:
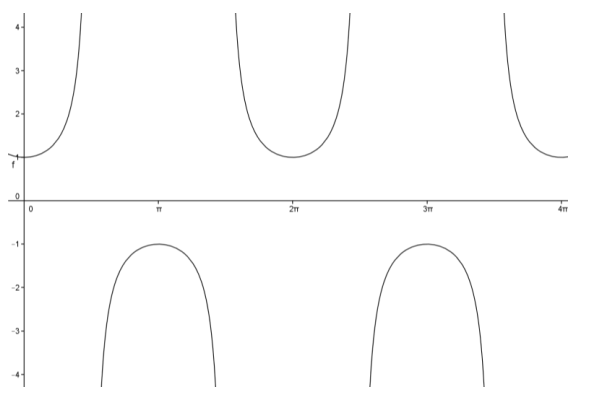
Question 6.
Consider the cosecant function.
a. Use technology to help you sketch y = csc(x)for 0 ≤ x ≤ 4π, – 4 ≤ y ≤ 4.
Answer:
b. What do you notice about the graph of the function? Compare this to your knowledge of the graph of y = sin(x).
Answer:
The graph of the function touches the graph of the sine function whenever y = sin(x) has a minimum or maximum point. There appear to be infinitely many asymptotes where y = sin(x) = 0. The range is all real numbers y such that |y|≥1, which makes sense as the reciprocal function of sine.
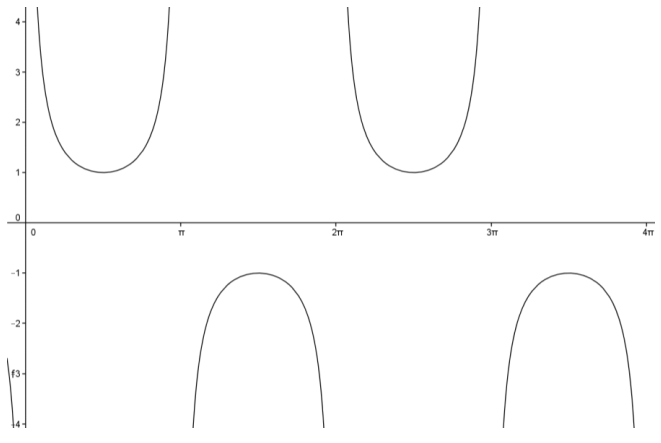
Question 7.
Consider the secant function.
a. Use technology to help you sketch y = sec(x) for 0 ≤ x ≤ 4π, – 4 ≤ y ≤ 4.
Answer:
b. What do you notice about the graph of the function? Compare this to your knowledge of the graph of y = cos(x).
Answer:
The graph of the function touches the graph of the cosine function whenever y = cos(x) has a minimum or maximum point. There appear to be infinitely many asymptotes where y = cos(x) = 0. The range is all real numbers y such that |y| ≥ 1, which makes sense as the reciprocal function of cosine.
Question 8.
Consider the cotangent function.
a. Use technology to help you sketch y = cot(x) for 0 ≤ x ≤ 2π, – 4 ≤ y ≤ 4.
Answer:
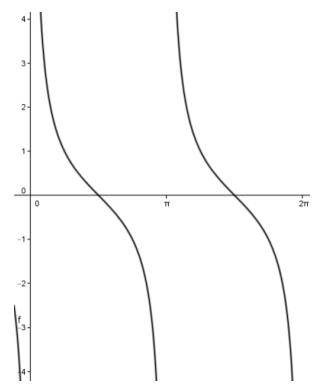
b. What do you notice about the graph of the function? Compare this to your knowledge of the graph of y = tan(x).
Answer:
There appear to be infinitely many asymptotes where y = sin(x) = 0 while the tangent function had asymptotes where cos(x) = 0. The range is all real numbers, which makes sense as the reciprocal function of tangent.
Eureka Math Precalculus Module 4 Lesson 11 Exit Ticket Answer Key
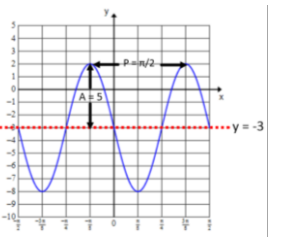
Question 1.
Consider a sinusoidal function whose graph has an amplitude of 5, a period of \(\frac{\pi}{2}\), a phase shift of \(\frac{\pi}{4}\) units to the left, and a midline of y = – 3. Write the function in the form f(x) = A sin(ω(x – h)) + k for positive A, ω, h, k. Then, graph at least one full period of the function. Label the midline, amplitude, and period on the graph.
Answer:
f(x) = 5 sin(4(x + \(\frac{\pi}{4}\))) – 3