Engage NY Eureka Math Precalculus Module 5 Lesson 10 Answer Key
Eureka Math Precalculus Module 5 Lesson 10 Exercise Answer Key
Exercise
Recall this example from Lesson 9:
A chance experiment consists of flipping a penny and a nickel at the same time. Consider the random variable of the number of heads observed.
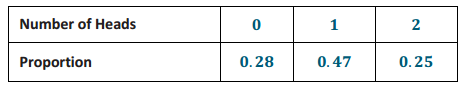
The probability distribution for the number of heads observed is as follows:
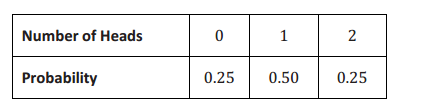
Exercise 1.
What is the probability of observing exactly 1 head when flipping a penny and a nickel?
Answer:
The probability of observing exactly 1 head when flipping a penny and a nickel is 0.50.
Exercises 2–7
Exercise 2.
Suppose you will flip two pennies instead of flipping a penny and a nickel. How will the probability distribution for the number of heads observed change?
Answer:
The probability distribution for the number of heads observed when flipping two pennies would be the same as the probability distribution for the number of heads observed when flipping a penny and a nickel. This is because both the penny and the nickel have a 50% chance of landing on heads.
Exercise 3.
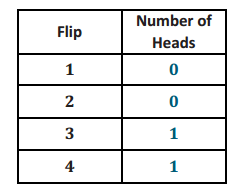
Flip two pennies, and record the number of heads observed. Repeat this chance experiment three more times for a total of four flips.
Answer:
Student answers will vary. One example is shown below.
Exercise 4.
What proportion of the four flips resulted in exactly 1 head?
Answer:
Student answers will vary. Based on the sample answer in Exercise 3, the proportion of the four flips in which I observed exactly 1 head is 0.50.
Exercise 5.
Is the proportion of the time you observed exactly 1 head in Exercise 4 the same as the probability of observing exactly 1 head when two coins are flipped (given in Exercise 1)?
Answer:
Student answers will vary. Based on the sample answer in Exercise 3, the proportion in Exercise 4 is the same as the probability in Exercise 1. However, this will not be the case for all students.
Exercise 6.
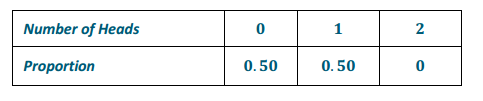
Is the distribution of the number of heads observed in Exercise 3 the same as the actual probability distribution of the number of heads observed when two coins are flipped?
Answer:
Student answers will vary. Based on the sample answer in Exercise 3, my distribution for the number of heads observed will not be the same. One answer is given below.
Exercise 7.
In Exercise 6, some students may have answered, “Yes, they are the same.” But many may have said, “No, they are different.” Why might the distributions be different?
Answer:
Since the chance experiment of flipping two pennies is only repeated four times, the proportions for the number of heads observed will probably not be the same as the actual probabilities for the number of heads observed.
Exercises 8–9
Exercise 8.
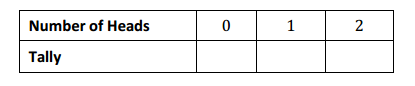
Combine your four observations from Exercise 3 with those of the rest of the class on the chart on the board. Complete the table below.
Answer:
Class answers will vary. One example is given.
Exercise 9.
How well does the distribution in Exercise 8 estimate the actual probability distribution for the random variable number of heads observed when flipping two coins?
Answer:
The proportions for the number of heads observed are approximately equal to the actual probabilities for the number of heads observed.
The probability of a possible value is the long-run proportion of the time that value will occur. In the above scenario, after flipping two coins many times, the proportion of the time each possible number of heads is observed will be close to the probabilities in the probability distribution. This is an application of the law of large numbers, one of the fundamental concepts of statistics. The law says that the more times an event occurs, the closer the experimental outcomes naturally get to the theoretical outcomes.
Exercises 10–12
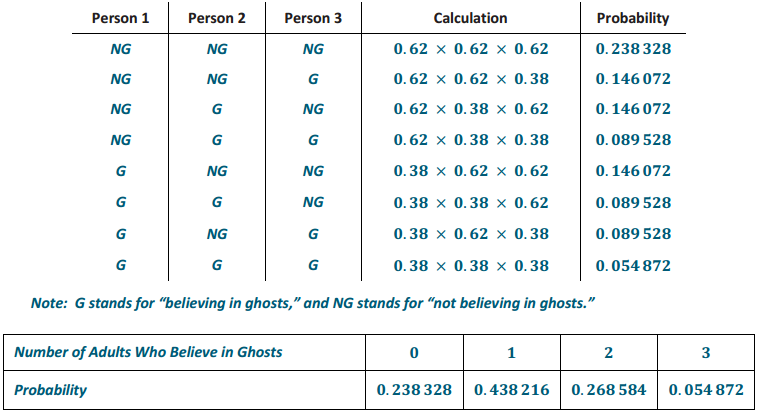
A May 2000 Gallup poll found that 38% of the people in a random sample of 1,012 adult Americans said that they believe in ghosts. Suppose that three adults will be randomly selected with replacement from the group that responded to this poll, and the number of adults (out of the three) who believe in ghosts will be observed.
Exercise 10.
Develop a discrete probability distribution for the number of adults in the sample who believe in ghosts.
Answer:
Exercise 11.
Calculate the probability that at least one adult, but at most two adults, in the sample believes in ghosts. Interpret this probability in context.
Answer:
The probability that at least one adult, but at most two adults, believes in ghosts is 0.438 216 + 0.268 584 = 0.7068.
If three adults were randomly selected and the number of them believing in ghosts was recorded many times, the proportion that at least one, but at most two, adults believe in ghosts would be 0.7068.
Exercise 12.
Out of the three randomly selected adults, how many would you expect to believe in ghosts? Interpret this expected value in context.
Answer:
Out of three randomly selected adults, the expected number who believe in ghosts is as follows:
0∙0.238 328 + 1∙0.438 216 + 2∙0.268 584 + 3∙0.054 872 = 1.14
The long-run average number of adults in a sample of three who believe in ghosts is 1.14 adults.
Eureka Math Precalculus Module 5 Lesson 10 Problem Set Answer Key
Question 1.
A high school basketball player makes 70% of the free throws she attempts. Suppose she attempts seven free throws during a game. The probability distribution for the number of free throws made out of seven attempts is displayed below.
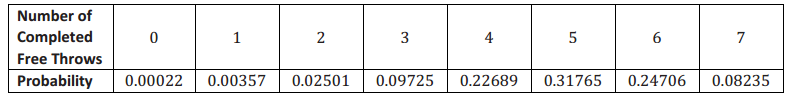
a. What is the probability that she completes at least three free throws? Interpret this probability in context.
Answer:
The probability that she completes at least three free throws is as follows:
0.09725 + 0.22689 + 0.31765 + 0.24706 + 0.08235 = 0.9712.
If this basketball player attempts seven free throws many times, the long-run proportion of the time that she will complete at least three free throws is 0.972.
b. What is the probability that she completes more than two but less than six free throws? Interpret this probability in context.
Answer:
The probability that she completes more than two but less than six free throws is as follows:
0.09725 + 0.22689 + 0.31765 = 0.64179.
If this basketball player attempts seven free throws during a game for many games, the long-run proportion of the time that she will complete more than two but less than six free throws is 0.64179.
c. How many free throws will she complete on average? Interpret this expected value in context.
Answer:
The average number of free throws that this basketball player will complete out of seven attempts is as follows:
0(0.00022) + 1(0.00357) + 2(0.02501) + 3(0.09725) + 4(0.22689) + 5(0.31765) + 6(0.24706) + 7(0.08235) = 4.89996≈4.90.
If this basketball player attempts seven free throws many times, the long-run average number of free throws completed is 4.90.
Question 2.
In a certain county, 30% of the voters are Republicans. Suppose that four voters are randomly selected.
a. Develop the probability distribution for the random variable number of Republicans out of the four randomly selected voters.
Answer:
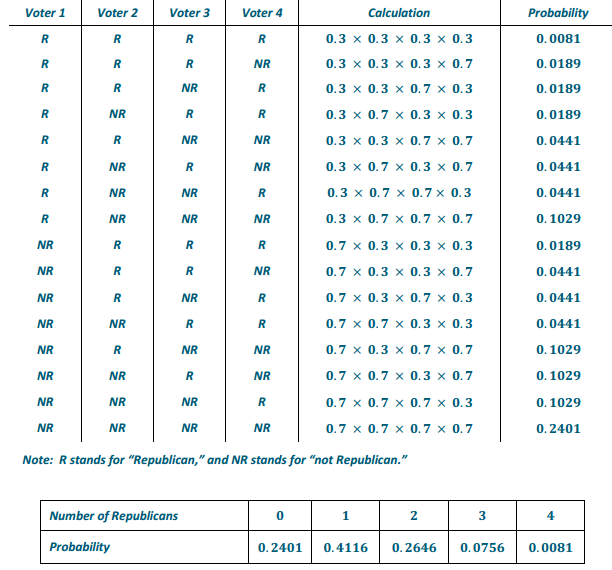
b. What is the probability that no more than two voters out of the four randomly selected voters will be Republicans? Interpret this probability in context.
Answer:
The probability that no more than two out of four randomly selected voters are Republicans is as follows:
0.2401 + 0.4116 + 0.2646 = 0.9163.
If four voters are randomly selected and the number of Republicans is recorded many, many times, the long-run proportion of the time that no more than two voters will be Republicans is 0.9163.
Question 3.
An archery target of diameter 122 cm has a bull’s-eye with diameter 12.2 cm.

a. What is the probability that an arrow hitting the target hits the bull’s-eye?
Answer:
Area of the bull’s-eye: π(6.1 cm)2 = 37.21π cm2.
Area of the target: π(61 cm)2 = 3721π cm2.
\(\frac{37.21 \pi \mathrm{cm}^{2}}{3721 \pi \mathrm{cm}^{2}}\) = 0.01
The probability of the arrow landing in the bull’s-eye is 0.01.
b. Develop the probability distribution for the random variable number of bull’s-eyes out of three arrows shot.
Answer:
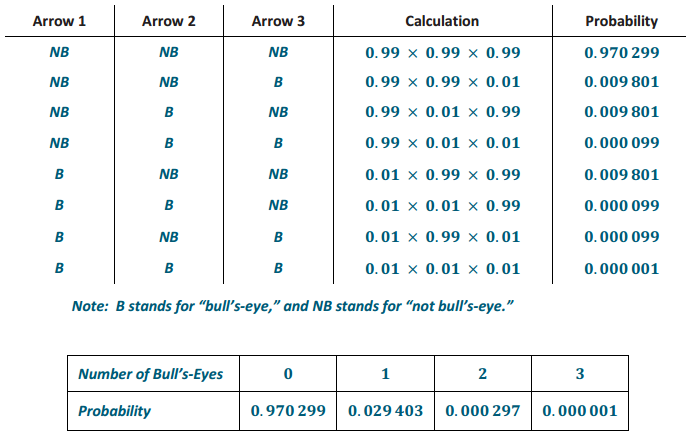
c. What is the probability of an archer getting at least one bull’s-eye? Interpret this probability in context.
Answer:
0.029 403 + 0.000 297 + 0.000 001 = 0.029 701
After shooting many arrows, the long-run proportion of an archer getting at least one bull’s-eye out of three is 0.029 701.
d. On average, how many bull’s-eyes should an archer expect out of three arrows? Interpret this expected value in context.
Answer:
0(0.970 299) + 1(0.029 403) + 2(0.000 297) + 3(0.000 001) = 0.03
After shooting many arrows, the long-run average should be close to 0.03 bull’s-eyes for every three arrows shot.
Question 4.
The probability that two people have the same birthday in a room of 20 people is about 41.1%. It turns out that your math, science, and English classes all have 20 people in them.
a. Develop the probability distribution for the random variable number of pairs of people who share birthdays out of three classes.
Answer:
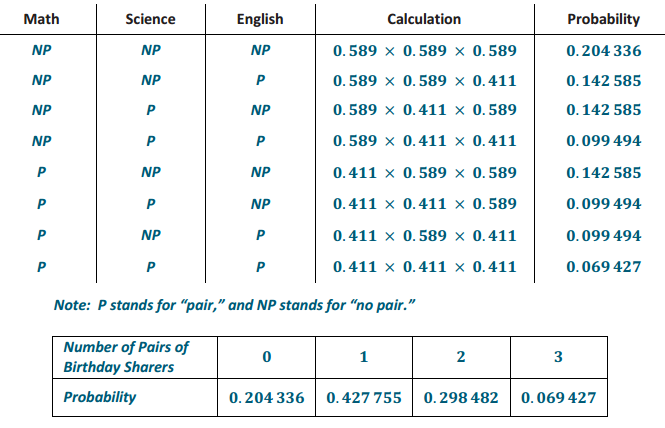
b. What is the probability that one or more pairs of people share a birthday in your three classes? Interpret the probability in context.
Answer:
0.427 755 + 0.298 482 + 0.069 427 = 0.795 664
If you went to many classes or other events containing 20 people, the long-run proportion of groups in which at least one pair of people share the same birthday is 0.795 664.
Question 5.
You go to the warehouse of the computer company you work for because you need to send eight motherboards to a customer. You realize that someone has accidentally reshelved a pile of motherboards you had set aside as defective. Thirteen motherboards were set aside, and 172 are known to be good. You are in a hurry, so you pick eight at random. The probability distribution for the number of defective motherboards is below.
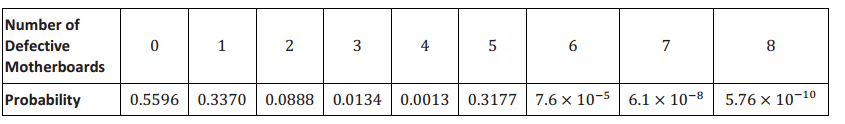
a. If more than one motherboard is defective, your company may lose the customer’s business. What is the probability of that happening?
Answer:
1-(0.5596 + 0.3370) = 0.1034
b. You are in a hurry and get nervous, so you pick eight motherboards and then second-guess yourself and put them back on the shelf. You then pick eight more. You do this a few times and then decide it is time to make a decision and send eight motherboards to the customer. On average, how many defective motherboards are you choosing each time? Is it worth the risk of blindly picking motherboards?
Answer:
0(0.5596) + 1(0.3370) + 2(0.0888) + 3(0.0134) + 4(0.0013) + 5(0.3177) + 6(7.6 × 10⁻⁵) + 7(6.1 × 10⁻⁸) + 8(5.76 × 10⁻¹⁰) = 2.15
On average, 2.15 motherboards are defective, which would suggest that you run the risk of losing the customer’s business.
Eureka Math Precalculus Module 5 Lesson 10 Exit Ticket Answer Key
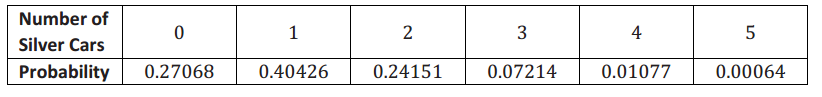
23% of the cars a certain automaker manufactures are silver. Below is the probability distribution for the number of silver cars sold by a car dealer in the next five car sales.
Question 1.
What is the probability of selling at most three silver cars? Interpret this probability in context.
Answer:
The probability that the dealer sells at most three silver cars is as follows:
0.27068 + 0.40426 + 0.24151 + 0.07214 = 0.98859.
After many car sales, the long-run proportion of the time that at most three silver cars are sold out of every five is 0.98859.
Question 2.
What is the probability of selling between and including one and four silver cars? Interpret this probability in context.
Answer:
The probability that the dealer sells between one and four silver cars is as follows:
0.40426 + 0.24151 + 0.07214 + 0.01077 = 0.72868.
After many car sales, the long-run proportion of the time that between one and four silver cars are sold out of every five is 0.72868.
Question 3.
How many silver cars is the dealer expected to sell, on average, out of five cars? Interpret this expected value in context.
Answer:
The average number of silver cars the dealer is expected to sell out of five cars is as follows:
0(0.27068) + 1(0.40426) + 2(0.24151) + 3(0.07214) + 4(0.01077) + 5(0.00064) = 1.15.
After many car sales, the dealer is expected to sell a long-run average of 1.15 silver cars out of every five cars.