Engage NY Eureka Math Precalculus Module 5 Lesson 13 Answer Key
Eureka Math Precalculus Module 5 Lesson 13 Exercise Answer Key
Exercises 1–4
Exercise 1.
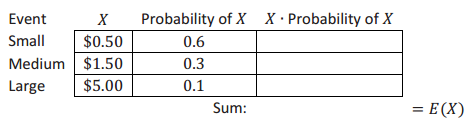
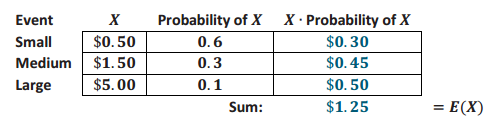
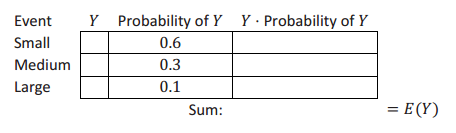
Let X represent the monetary value of the prize that you win playing this game 1 time in dollars. Complete the table below, and calculate E(X).
Answer:
Exercise 2.
Regarding the E(X) value you computed above, can you win exactly that amount on any 1 play of the game?
Answer:
No, you cannot win exactly $1.25 on any 1 play. On average, you are expected to win $1.25 per play if you were to play many times.
Exercise 3.
What is the least you could win in 4 attempts? What is the most you could win in 4 attempts?
Answer:
The least amount that could be won in 4 attempts is $2.00 (4∙$0.50), and the most is $20.00 (4∙$5.00).
Exercise 4.
How would you explain the E(X) value in context to someone who had never heard of this measurement? What would you expect for the total monetary value of your prizes from 4 attempts at this game? (To answer this question, check the introduction to this lesson; do not do anything complicated like developing a tree diagram for all of the outcomes from 4 attempts at the game.)
Answer:
On average, a person is expected to win $5.00 (4∙E(X)) for every 4 attempts. The winnings could be as little as $2.00 (4 small) or as large as $20.00 (4 larges). If 4 attempts were made many times, the winnings would average out to be about $5.00.
Exercises 5–8
Exercise 5.
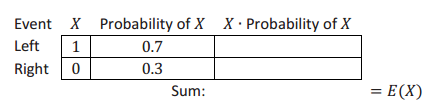
Examining the outcomes for just 1 mouse, define the random variable, and complete the following table:
Answer:
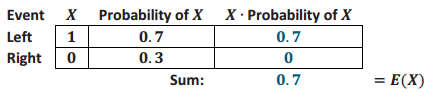
Let X represent the number of left turns made by 1 mouse.
Exercise 6.
Using this value and the rule mentioned above, determine the expected number of left turns for 3 mice. (Remember, the value you compute may not be an exact, attainable value for 1 set of 3 mice. Rather, it is the average number of left turns by 3 mice based on many sets of 3 mice.)
Answer:
The expected value is 2.1 left turns. As stated in the student exercise, the value may not be an exact, attainable value for 1 set of 3 mice. Rather, it is the average number of left turns by 3 mice based on numerous attempts.
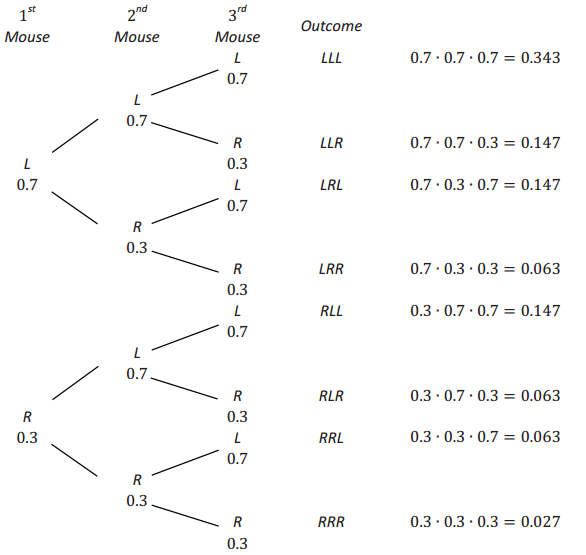
The tree diagram below demonstrates the 8 possible outcomes for 3 mice where the first stage of the tree represents the decision made by the 1st mouse and the second stage represents the decision made by the 2nd mouse, and so on.
Exercise 7.
Use the tree diagram to answer the following questions:
a. Complete the following table, and compute E(Y), the expected number of left turns for 3 mice.
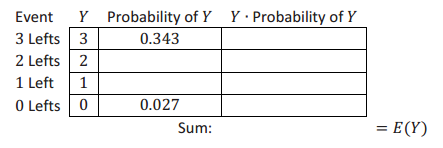
Answer:
Let Y represent the number of left turns made by 1 mouse.
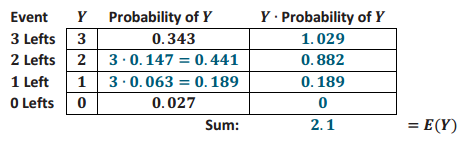
b. Verify that the expected number of left turns for 3 mice, E(Y), is the same as 3 times the expected number of left turns for 1 mouse, 3∙E(X).
Answer:
Yes. E(Y) = 2.1 = 3∙E(X) = 3∙0.7
Exercise 8.
Imagine that 200 mice are sent through the maze one at a time. The researchers believed that the probability of a mouse turning left due to the food is 0.7. How many left turns would they expect from 200 mice?
Answer:
200∙0.7 = 140
They would expect 140 left turns.
Exercises 9–13
Exercise 9.
Compute a player’s net earnings for each of the 3 outcomes: small, medium, and large.
Answer:
Small: $0.50 – $2.00 = – $1.50
Medium: $1.50 – $2.00 = – $0.50
Large: $5.00 – $2.00 = + $3.00
Exercise 10.
For two of the outcomes, the net earnings result is negative. What does a negative value of net earnings mean in context as far as the player is concerned?
Answer:
A negative expected value from the player’s perspective means a loss.
Exercise 11.
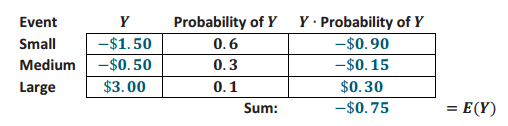
Let Y represent the net amount that you win (or lose) playing the duck game 1 time. Complete the table below, and calculate E(Y).
Answer:
Exercise 12.
How would you explain the E(Y) value in context to someone who had never heard of this measurement? Write a sentence explaining this value from the perspective of a player; then, write a sentence explaining this value from the perspective of the charity running the game.
Answer:
To a player: The game is designed such that if you play it over and over again, the people running the game expect that you will lose $0.75 to them on average per attempt.
To the people running the game: The game is designed such that if people play this game over and over again, you can expect to make about $0.75 on average per attempt.
Exercise 13.
How much money should the charity expect to earn from the game being played 100 times?
Answer:
100∙$0.75 = $75.00
In 100 attempts, the charity should expect to earn $75.00.
Eureka Math Precalculus Module 5 Lesson 13 Problem Set Answer Key
Question 1.
The Maryland Lottery Pick 3 game described in the Exit Ticket has a variety of ways in which a player can bet. Instead of the Front Pair bet of $0.50 described above with a payout of $25.00, a player could make a Front Pair bet of $1.00 on a single ticket for a payout of $50.00.
Let Y represent a player’s net gain or loss from playing 1 game in this manner.
a. Compute E(Y).
Answer:
E(Y) = 0.99∙ – $1.00 + 0.01∙$49.00 = – $0.99 + $0.49 = – $0.50
b. On average, how much does the Maryland Lottery make on each such bet?
Answer:
The Maryland Lottery makes on average $0.50 for each such bet.
c. Assume that for a given time period, 100,000 bets like the one described above were placed. How much money should the Maryland Lottery expect to earn on average from 100,000 bets?
Answer:
100 000∙$0.50 = $50000.00
d. Compare your answers to the three questions above with your Exit Ticket answers. How are the answers to these questions and the answers to the Exit Ticket questions related?
Answer:
Each of these answers is double the corresponding answers above.
Question 2.
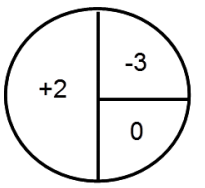
Another type of carnival or arcade game is a spinning wheel game. Imagine that someone playing a spinning wheel game earns points (payoff) as follows for each spin:
- You gain 2 points 50% of the time.
- You lose 3 points 25% of the time.
- You neither gain nor lose any points 25% of the time.
The results of each spin are added to one another, and the object is for a player to accumulate 5 or more points. Negative total point values are possible.
a. Develop a model of a spinning wheel that would reflect the probabilities and point values.
Answer:
b. Compute E(X) where X represents the number of points earned in a given spin.
Answer:
E(X) = 2∙0.50 + ( – 3)∙0.25 + 0∙0.25 = 0.25
0.25 points will typically be earned in a given spin.
c. Based on your computation, how many spins on average do you think it might take to reach 5 points?
Answer:
\(\frac{5}{0.25}\) = 20. It would take on average 20 spins.
d. Use the spinning wheel you developed in part (a) (or some other randomization device) to take a few spins. See how many spins it takes to reach 5 or more points. Comment on whether this was fewer spins, more spins, or the same number of spins you expected in part (c).
Answer:
Answers will vary. In most cases, a player can reach 5 or more points with very few spins, often far fewer than the average of 20.
e. Let Y represent the number of spins needed to reach 5 or more points (like the number of spins it took you to reach 5 points in part (d)), and repeat the simulation process from part (d) many times. Record on a dot plot the various values of Y you obtain. After several simulations, comment on the distribution of Y.
Answer:
Answers will vary with students’ work.
For parts (d) and (e), 1 simulation distribution (computer generated) of Y represents the number of spins needed to reach 5 or more points was as follows:
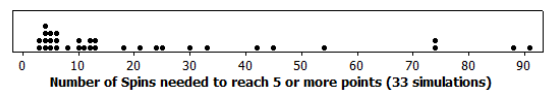
The distribution is very skewed right, and sometimes it takes many spins to get to 5 or more points.
The average number of spins needed based on these 33 simulations was 23.12 spins, close to the
E(Y) = 20. In most cases, a player can reach 5 or more points with very few spins, often far fewer than the average of 20. (Note: This may be a good chance to remind students that it is important to see the center, shape, and spread of a distribution before drawing conclusions about a variable.)
Eureka Math Precalculus Module 5 Lesson 13 Exit Ticket Answer Key
Question 1.
As posted on the Maryland Lottery’s website for its Pick 3 game, the chance of winning with a Front Pair bet is 0.01. (http://mdlottery.com/games/pick – 3/payouts/ accessed on November 17, 2013)
A Front Pair bet is successful if the front pair of numbers you select match the Pick 3 number’s first 2 digits. For example, a bet of 12X would be a winner if the Pick 3 number is 120,121,122, and so on. In other words, 10 of the 1,000 possible Pick 3 numbers (1%) would be winners, and thus, the probability of winning is 0.01 or 1%.
A successful bet of $0.50 pays out $25.00 for a net gain to the player of $24.50.
a. Define the random variable X, and compute E(X).
Answer:
Let X represent a player’s NET gain or loss from playing 1 game in this manner.
E(X) = 0.99∙ – $0.50 + 0.01∙$24.50 = -$0.495 + $0.245 = -$0.25
b. On average, how much does the Maryland Lottery make on each such bet?
Answer:
The Maryland Lottery makes on average $0.25 for each such bet.
c. Assume that for a given time period, 100,000 bets like the one described above were placed. How much money should the Maryland Lottery expect to earn on average from 100,000 bets?
Answer:
100 000∙$0.25 = $25000.00
Note: According to the Maryland Lottery Gaming and Control Agency’s Annual Report for Fiscal Year 2012, the
Pick 3 game accounted for $254.60 million in net sales. (http://mlgca.com/annual – report/ accessed November 17, 2013)