Engage NY Eureka Math Precalculus Module 5 Lesson 18 Answer Key
Eureka Math Precalculus Module 5 Lesson 18 Example Answer Key
Example 1.
You are playing a game that uses a deck of cards consisting of 10 green, 10 blue, 10 purple, and 10 red cards. You will select four cards at random, and you want all four cards to be the same color. You are given two alternatives. You can randomly select the four cards one at a time, with each card being returned to the deck and the deck being shuffled before you pick the next card. Alternatively, you can randomly select four cards without the cards being returned to the deck. Which should you choose? Explain your answer.
Answer:
With replacement:
P(same color) = P(GGGG) + P(BBBB) + P(PPPP) + P(RRRR) = (\(\frac{1}{4}\))4 + (\(\frac{1}{4}\))4 + (\(\frac{1}{4}\))4 + (\(\frac{1}{4}\))4 = 0.015 625
Without replacement:
P(same color) = P(GGGG) + P(BBBB) + P(PPPP) + P(RRRR) = (\(\frac{10}{40}\))(\(\frac{9}{39}\))(\(\frac{8}{38}\))(\(\frac{7}{37}\))∙4 ≈ 0.009
Since 0.015 625 is greater than 0.009, it is better to select the cards with replacement.
It is also possible to give an intuitive answer to this question. Think about the probability of selecting all green cards when you are selecting without replacement. The probability that the first card is green is \(\frac{1}{4}\). However, having selected a green card first, the following cards are less likely to be green as there are only nine green cards remaining while there are 10 of each of the other three colors. Whereas, if you select the cards with replacement, then the probability of picking a green card remains at \(\frac{1}{4}\) for all four selections. Thus, it is preferable to select the cards with replacement.
Eureka Math Precalculus Module 5 Lesson 18 Exercise Answer Key
Exercise 1.
Suppose that someone is offering to sell you raffle tickets. There are blue, green, yellow, and red tickets available. Each ticket costs the same to purchase regardless of color. The person selling the tickets tells you that 369 blue tickets, 488 green tickets, 523 yellow tickets, and 331 red tickets have been sold. At the drawing, one ticket of each color will be drawn, and four identical prizes will be awarded. Which color ticket would you buy? Explain your answer.
Answer:
Suppose, for the sake of argument, that at the time of the drawing 500 blue tickets and 600 green tickets have been sold. If you hold one blue ticket, the probability that you will win is \(\frac{1}{500}\). If you hold one green ticket, the probability that you will win is \(\frac{1}{600}\). Since \(\frac{1}{500}\) is greater than \(\frac{1}{600}\), it would be to your advantage to have a blue ticket rather than a green one. Therefore, it is sensible to buy the color of ticket that has sold the fewest, which at the time of buying is red. You should buy a red ticket.
Exercise 2.
Suppose that you are taking part in a TV game show. The presenter has a set of 60 cards, 10 of which are red and the rest are blue. The presenter randomly splits the cards into two piles and places one on your left and one on your right. The presenter tells you that there are 32 blue cards in the pile on your right. You look at the pile of cards on your left and estimate that it contains 24 cards. You will be given a chance to pick a card at random, and you know that if you pick a red card, you will win $5, 000. If you pick a blue card, you will get nothing. The presenter gives you the choice of picking a card at random from the pile on the left, from the pile on the right, or from the entire set of cards. Which should you choose? Explain your answer.
Answer:
Assuming that your estimate that there are 24 cards in the pile on the left is true, there are 60–24 = 36 cards in the pile on the right. The number of blue cards on the right is 32, so the number of red cards on the right is
36 – 32 = 4. There are 10 red cards altogether, so the number of red cards on the left is 10 – – = 6. Therefore, if you pick a card at random from the pile on the left, the probability that you pick a red card is \(\frac{6}{24}\) = 0.25. If you pick from the pile on the right, the probability that you get a red card is \(\frac{4}{36}\) ≈ 0.111. If you pick from the entire deck, the probability that you get a red card is \(\frac{10}{60}\) = 0.167. Therefore, you should pick your card from the pile on the left.
Exercise 3
Medical professionals often use enzyme – linked immunosorbent assays (ELISA tests) to quantify a person’s antibodies to Lyme disease as a diagnostic method. The American Lyme Disease Foundation states that the ELISA test will be positive for virtually all patients who have the disease but that the test is also positive for around 6% of those who do not have the disease. (http://aldf.com/lyme – disease/) For the purposes of this question, assume that the ELISA test is positive for all patients who have the disease and for 6% of those who do not have the disease. Suppose the test is performed on a randomly selected resident of Connecticut where, according to the Centers for Disease Control and Prevention, 46 out of every 100, 000 people have Lyme disease. (http://www.cdc.gov/lyme/stats/chartstables/reportedcases_statelocality.html)
a. Complete the hypothetical 100, 000 – person two – way frequency table below for 100, 000 Connecticut residents.
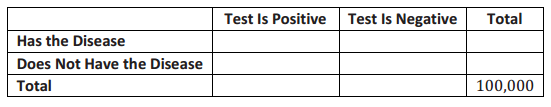
Answer:
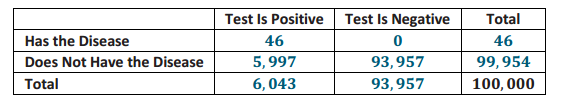
b. If a randomly selected person from Connecticut is tested for the disease using the ELISA test and the test is positive, what is the probability that the person has the disease? (Round your answer to the nearest thousandth.)
Answer:
P(disease│positive) = \(\frac{46}{6043}\) ≈ 0.008
c. Comment on your answer to part (b). What should the medical response be if a person is tested using the ELISA test and the test is positive?
Answer:
If a patient gets a positive test, the probability that the patient actually has the disease is very small (only around 8 in every 1, 000 people with positive tests actually have the disease). So, if a person has a positive test, then it is necessary to follow up with more accurate testing.
Exercise 4.
You are at a stall at a fair where you have to throw a ball at a target. There are two versions of the game. In the first version, you are given three attempts, and you estimate that your probability of success on any given throw is 0.1. In the second version, you are given five attempts, but the target is smaller, and you estimate that your probability of success on any given throw is 0.05. The prizes for the two versions of the game are the same, and you are willing to assume that the outcomes of your throws are independent. Which version of the game should you choose? (Hint: In the first version of the game, the probability that you do not get the prize is the probability that you fail on all three attempts.)
Answer:
First version of the game:
The probability that you do not get the prize is P(fail, fail, fail ) = (0.9)3 = 0.729.
So, the probability that you do get the prize is 1 – 0.729 = 0.271.
Second version of the game:
The probability that you do not get the prize is P(fail, fail, fail, fail, fail ) = (0.95)5 ≈ 0.774.
So, the probability that you do get the prize is 1 – 0.774 = 0.226.
Since 0.271 is greater than 0.226, you should choose the first version of the game.
Eureka Math Precalculus Module 5 Lesson 18 Problem Set Answer Key
Question 1.
Jonathan is getting dressed in the dark. He has three drawers of socks. The top drawer contains 5 blue and 5 red socks, the middle drawer contains 6 blue and 4 red socks, and the bottom drawer contains 3 blue and 2 red socks. Jonathan will open one drawer and will select two socks at random.
a. Which drawer should he choose in order to make it most likely that he will select 2 red socks?
Answer:
The middle and bottom drawers both contain a minority of red socks. This is not the case for the top drawer. So, Jonathan should choose the top drawer.
b. Which drawer should he choose in order to make it most likely that he will select 2 blue socks?
Answer:
Blue socks are in the majority in the middle and bottom drawers but not in the top drawer.
Middle drawer: P(BB) = (\(\frac{6}{10}\))(\(\frac{5}{9}\)) ≈ 0.333
Bottom drawer: P(BB) = (\(\frac{3}{5}\))(\(\frac{2}{4}\)) = 0.3
Since 0.333 is greater than 0.3, he should choose the middle drawer.
c. Which drawer should he choose in order to make it most likely that he will select a matching pair?
Answer:
Top drawer: P(matching pair) = P(BB) + P(RR) = (\(\frac{5}{10}\))(\(\frac{4}{9}\))•2 ≈ 0.444
Middle drawer: P(matching pair) = P(BB) + P(RR) = (\(\frac{6}{10}\))(\(\frac{5}{9}\)) + (\(\frac{4}{10}\))(\(\frac{3}{9}\)) ≈ 0.467
Bottom drawer: P(matching pair) = P(BB) + P(RR) = (\(\frac{3}{5}\))(\(\frac{2}{4}\)) + (\(\frac{2}{5}\))(\(\frac{1}{4}\)) = 0.4
Since the probability of a matching pair is greatest for the middle drawer, Jonathan should choose the middle drawer.
Question 2.
Commuters in London have the problem that buses are often already full and, therefore, cannot take any further passengers. Sarah is heading home from work. She has the choice of going to Bus Stop A, where there are three buses per hour and 30% of the buses are full, or Bus Stop B, where there are four buses per hour and 40% of the buses are full. Which stop should she choose in order to maximize the probability that she will be able to get on a bus within the next hour? (Hint: Calculate the probability, for each bus stop, that she will fail to get on a bus within the next hour. You may assume that the buses are full, or not, independently of each other.)
Answer:
Bus Stop A: P(fails to get bus) = P(all three buses are full) = (0.3)3 = 0.027
So, P(gets bus) = 1 – 0.027 = 0.973.
Bus Stop B: P(fails to get bus) = P(all four buses are full) = (0.4)4 = 0.0256
So, P(gets bus) = 1 – 0.0256 = 0.9744.
Sarah is slightly more likely to get a bus if she chooses Bus Stop B.
Question 3.
An insurance salesman has been told by his company that about 20% of the people in a city are likely to buy life insurance. Of those who buy life insurance, around 30% own their homes, and of those who do not buy life insurance, around 10% own their homes. In the questions that follow, assume that these estimates are correct:
a. If a homeowner is selected at random, what is the probability that the person will buy life insurance? (Hint: Use a hypothetical 1, 000 – person two – way frequency table.)
Answer:
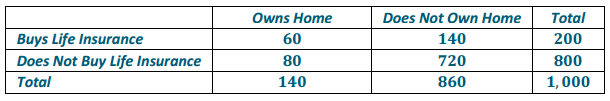
P(buys life insurance│homeowner) = \(\frac{60}{140}\) ≈ 0.429
b. If a person is selected at random from those who do not own their homes, what is the probability that the person will buy life insurance?
Answer:
P(buys life insurance│does not own home) = \(\frac{140{860}\) ≈ 0.163
c. Is the insurance salesman better off trying to sell life insurance to homeowners or to people who do not own their homes?
Answer:
Since 0.429 is greater than 0.163, the salesman is better off trying to sell to homeowners.
Question 4.
You are playing a game. You are given the choice of rolling a fair six – sided number cube (with faces labeled 1–6) three times or selecting three cards at random from a deck that consists of
- 4 cards labeled 1
- 4 cards labeled 2
- 4 cards labeled 3
- 4 cards labeled 4
- 4 cards labeled 5
- 4 cards labeled 6
If you decide to select from the deck of cards, then you will not replace the cards in the deck between your selections. You will win the game if you get a triple (that is, rolling the same number three times or selecting three cards with the same number). Which of the two alternatives, the number cube or the cards, will make it more likely that you will get a triple? Explain your answer.
Answer:
With number cube:
P(triple) = P(1, 1, 1) + P(2, 2, 2) + P(3, 3, 3) + P(4, 4, 4) + P(5, 5, 5) + P(6, 6, 6) = (\(\frac{1}{6}\))3•6 ≈ 0.028
With cards:
P(triple) = P(1, 1, 1) + P(2, 2, 2) + P(3, 3, 3) + P(4, 4, 4) + P(5, 5, 5) + P(6, 6, 6) = (\(\frac{4}{24}\))(\(\frac{3}{23}\))(\(\frac{2}{22}\))•6 ≈ 0.012
Since 0.028 is greater than 0.012, a triple is more likely with the number cube.
Question 5.
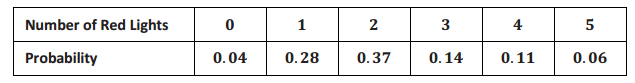
There are two routes Jasmine can take to work. Route A has five stoplights. The probability distribution of how many lights at which she will need to stop is below. The average amount of time spent at each stoplight on Route A is 30 seconds.
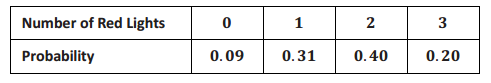
Route B has three stoplights. The probability distribution of Route B is below. The average wait time for these lights is 45 seconds.
a. In terms of stopping at the least number of stoplights, which route may be the best for Jasmine to take?
Answer:
(0∙0.04) + (1∙0.28) + (2∙0.37) + (3∙0.14) + (4∙0.11) + (5∙0.06) = 2.18
If she takes Route A, the expected number of stoplights that she will have to stop for is 2.18 stoplights.
(0∙0.09) + (1∙0.31) + (2∙0.40) + (3∙0.20) = 1.71
If she takes Route B, the expected number of stoplights that she will have to stop for is 1.71 stoplights.
She might be stopped by fewer stoplights if she takes Route B.
b. In terms of least time spent at stoplights, which route may be the best for Jasmine to take?
Answer:
The expected wait time on Route A is 1.09 minutes. 2.18∙0.5 = 1.09
The expected wait time on Route B is 1.28 minutes. 1.71∙0.75 = 1.28
Even though Jasmine is expected to hit fewer lights on Route B, her expected wait time is longer than that of Route A.
Question 6.
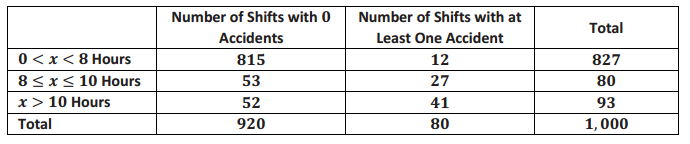
A manufacturing plant has been shorthanded lately, and one of its plant managers recently gathered some data about shift length and frequency of work – related accidents in the past month (accidents can range from forgetting safety equipment to breaking a nail to other, more serious injuries). Below is the table displaying his findings.
a. What is the probability that a person had an accident?
Answer:
The probability is \(\frac{80}{1000}\) = 0.08.
b. What happens to the accident likelihood as the number of hours increases?
Answer:
For an 8 – hour shift, the probability is \(\frac{12}{80}\) = 0.15. For an 8 – to 10 – hour shift, the probability is \(\frac{27}{80}\) ≈ 0.34. For a 10 + hour shift, the probability is \(\frac{41}{80}\) ≈ 0.51. In general, as the length of the shift increases, so does the probability of having an accident.
c. What are some options the plant could pursue in order to try to cut down or eliminate accidents?
Answer:
Answers will vary. Assuming fatigue is a major factor for accident occurrence, the plant could hire more people. It could mandate shorter shifts. It could reduce its operating hours.
Eureka Math Precalculus Module 5 Lesson 18 Exit Ticket Answer Key
Question 1.
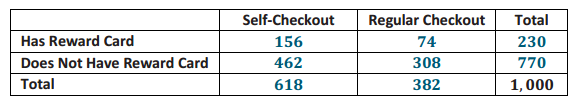
In a Home Décor store, 23% of the customers have reward cards. Of the customers who have reward cards, 68% use the self – checkout, and the remainder use the regular checkout. Of the customers who do not have reward cards, 60% use the self – checkout, and the remainder use the regular checkout.
a. Construct a hypothetical 1, 000 – customer two – way frequency table with columns corresponding to whether or not a customer uses the self – checkout and rows corresponding to whether or not a customer has a reward card.
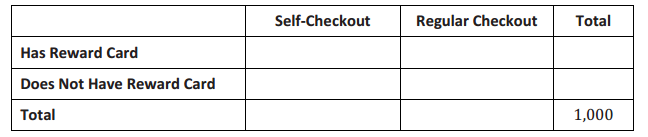
Answer:
b. What proportion of customers who use the self – checkout do not have reward cards?
Answer:
\(\frac{462}{618}\) ≈ 0.748
c. What proportion of customers who use the regular checkout do not have reward cards?
Answer:
\(\frac{308}{382}\) ≈ 0.806
d. If a researcher wishes to maximize the proportion of nonreward cardholders in a study, would she be better off selecting customers from those who use the self – checkout or the regular checkout? Explain your reasoning.
Answer:
Since 0.806 is greater than 0.748, the researcher should select customers from those who use the regular checkout. The probability of customers not having reward cards in the regular checkout would be slightly higher than in the self – checkout, maximizing the researcher’s chances of getting a higher proportion of non – cardholders for the study.
Question 2.
At the end of a math contest, each team must select two students to take part in the countdown round. As a math team coach, you decide to randomly select two students from your team. You would prefer that the two students selected consist of one girl and one boy. Would you prefer to select your two students from a team of 6 girls and 6 boys or a team of 5 girls and 5 boys? Show your calculations, and explain how you reached your conclusion.
Answer:
6 girls, 6 boys: P(1 girl, 1 boy) = P(GB) + P(BG) = (\(\frac{6}{12}\))(\(\frac{6}{11}\)) + (\(\frac{6}{12}\))(\(\frac{6}{11}\)) ≈ 0.545
5 girls, 5 boys: P(1 girl, 1 boy) = P(GB) + P(BG) = (\(\frac{5}{10}\))(\(\frac{5}{9}\)) + (\(\frac{5}{10}\))(\(\frac{5}{9}\)) ≈ 0.555
The probabilities are nearly equal, but because 0.555 is greater than 0.545, it is preferable to select from 5 girls and 5 boys.