Engage NY Eureka Math Precalculus Module 5 Lesson 8 Answer Key
Eureka Math Precalculus Module 5 Lesson 8 Exploratory Challenge /Exercise Answer Key
Exploratory Challenge 1/Exercise 1
Recall the following problem from the Problem Set in Lesson 7:
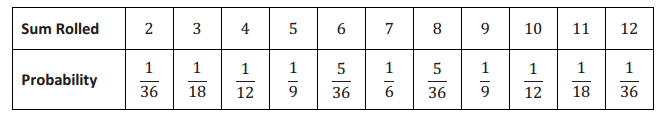
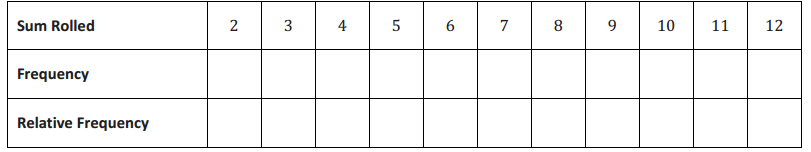
Suppose two dice are rolled. The sum of the two numbers showing is a discrete random variable. The following table displays the probability distribution of this random variable:
Exercise 1.
If you rolled two dice and added the numbers showing a large number of times, what would you expect the average sum to be? Explain why.
Answer:
The expected sum of the two rolled dice is as follows:
2(\(\frac{1}{36}\)) + 3(\(\frac{1}{18}\)) + 4(\(\frac{1}{12}\)) + 5(\(\frac{1}{9}\)) + 6(\(\frac{5}{36}\)) + 7(\(\frac{1}{6}\)) + 8(\(\frac{5}{36}\)) + 9(\(\frac{1}{9}\)) + 10(\(\frac{1}{12}\)) + 11(\(\frac{1}{18}\)) + 12(\(\frac{1}{36}\)) = 7
The expected average sum would be 7 because, after a large number of rolls, the distribution of sums would resemble the probability distribution above.
Exploratory Challenge 1/Exercises 2–4
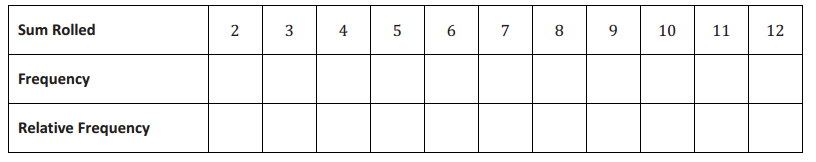
Exercise 2.
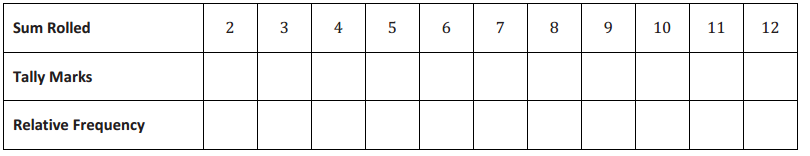
Roll two dice. Record the sum of the numbers on the two dice in the table below. Repeat this nine more times for a total of 10 rolls.
Answer:
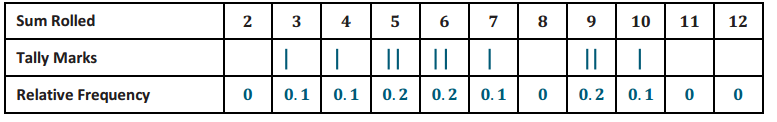
Student responses will vary. Here is one example.
Exercise 3.
What is the average sum of these 10 rolls?
Answer:
Answers will vary. For the example above, the average of the sum for these 10 rolls is as follows:
3(0.1) + 4(0.1) + 5(0.2) + 6(0.2) + 7(0.1) + 9(0.2) + 10(0.1) = 6.4
Exercise 4.
How does this average compare to the expected value in Exercise 1? Are you surprised? Why or why not?
Answer:
Answers will vary, but for most students, the average will not be the same as the expected sum of 7 in Exercise 1. Students may say they are not surprised as there were only 10 rolls of the dice.
Exploratory Challenge 1/Exercises 5–7
Exercise 5.
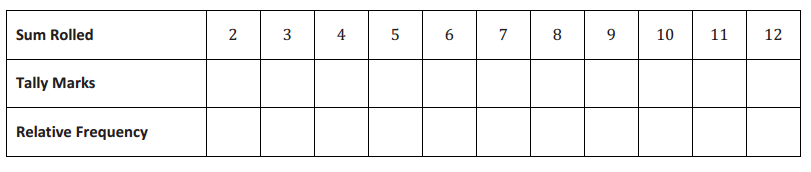
Roll the two dice 10 more times, recording the sums. Combine the sums of these 10 rolls with the sums of the previous 10 rolls for a total of 20 sums.
Answer:
Student responses will vary. Here is one example.
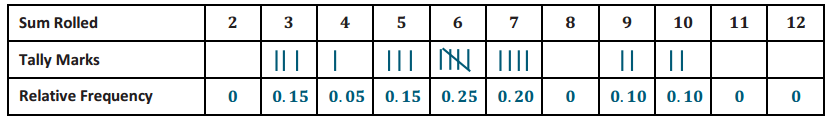
Exercise 6.
What is the average sum for these 20 rolls?
Answer:
Answers will vary. For the example above, the average sum for these 20 rolls is as follows:
3(0.15) + 4(0.05) + 5(0.15) + 6(0.25) + 7(0.20) + 9(0.10) + 10(0.10) = 6.2
Exercise 7.
How does the average sum for these 20 rolls compare to the expected value in Exercise 1?
Answer:
Answers will vary, but for most students, the average will still not be the same as the expected sum of 7 in Exercise 1.
Exploratory Challenge 1/Exercise 8
Exercise 8.
Combine the sums of your 20 rolls with those of your partner. Find the average of the sum for these 40 rolls.
Answer:
Student responses will vary. Here is one example.
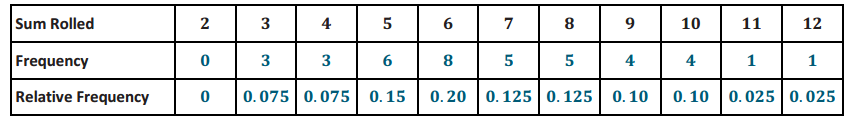
The average sum for these 40 rolls is as follows:
3(0.075) + 4(0.075) + 5(0.15) + 6(0.2) + 7(0.125) + 8(1.25) + 9(0.10) + 10(0.10) + 11(0.025) + 12(0.025)
= 6.825
Exploratory Challenge 2/Exercise 9
Exercise 9.
Combine the sums of your 40 rolls above with those of another pair for a total of 80 rolls. Find the average value of the sum for these 80 rolls.
Answer:
Student responses will vary. Here is one example.
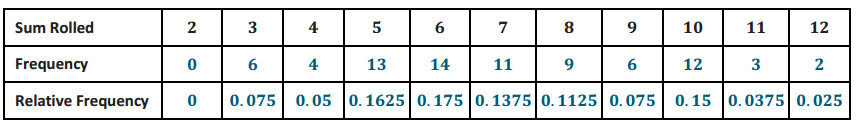
The average sum for these 80 rolls is as follows:
3(0.075) + 4(0.05) + 5(0.1625) + 6(0.175) + 7(0.1375) + 8(0.1125) + 9(0.075) + 10(0.15) + 11(0.0375) + 12(0.025) = 7.0375
Exploratory Challenge 2/Exercises 10–11
Exercise 10.
Combine the sums of your 80 rolls with those of the rest of the class. Find the average sum for all the rolls.
Answer:
Student responses will vary. Here is one example for a class of 20 students.
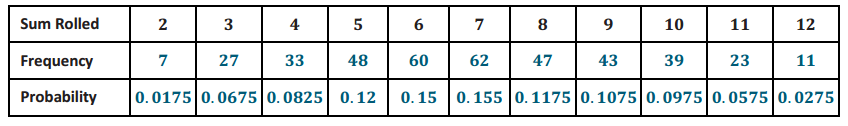
The average sum of these 400 rolls is as follows:
2(0.0175) + 3(0.0675) + 4(0.0825) + 5(0.12) + 6(0.15) + 7(0.155) + 8(0.1175) + 9(0.1075) + 10(0.0975) + 11(0.0575) + 12(0.0275) = 6.9975
Exercise 11.
Think about your answer to Exercise 1. What do you notice about the averages you have calculated as the number of rolls increases? Explain why this happens.
Answer:
As the number of rolls increases, the average value approaches the expected value. This happens because as the number of observed values of the random variable increases, the relative frequencies become closer to the actual probabilities in the probability distribution. The expected value of a discrete random variable is a long-run average value for the variable.
Exploratory Challenge 2/Exercise 12
The expected value of a discrete random variable is the long-run mean value of the discrete random variable. Refer back to Exercise 1 where two dice were rolled, and the sum of the two dice was recorded. The interpretation of the expected value of a sum of 7 would be
When two dice are rolled over and over for a long time, the mean sum of the two dice is 7.
Notice that the interpretation includes the context of the problem, which is the random variable sum of two dice, and also includes the concept of long-run average.
Exercise 12.
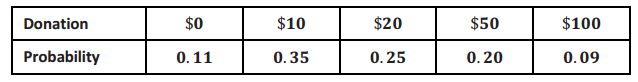
Suppose a cancer charity in a large city wanted to obtain donations to send children with cancer to a circus appearing in the city. Volunteers were asked to call residents from the city’s telephone book and to request a donation. Volunteers would try each phone number twice (at different times of the day). If there was no answer, then a donation of $0 was recorded. Residents who declined to donate were also recorded as $0. The table below displays the results of the donation drive.
Find the expected value for the amount donated, and write an interpretation of the expected value in context.
Answer:
The expected amount donated is as follows:
0(0.11) + 10(0.35) + 20(0.25) + 50(0.20) + 100(0.09) = 27.50
When a large number of residents are contacted, the mean amount donated is $27.50.
Eureka Math Precalculus Module 5 Lesson 8 Problem Set Answer Key
Question 1.
Suppose that a discrete random variable is the number of broken eggs in a randomly selected carton of one dozen eggs. The expected value for the number of broken eggs is 0.48 eggs. Which of the following statements is a correct interpretation of this expected value? Explain why the others are wrong.
a. The probability that an egg will break in one-dozen cartons is 0.48, on average.
b. When a large number of one-dozen cartons of eggs are examined, the average number of broken eggs in a one-dozen carton is 0.48 eggs.
c. The mean number of broken eggs in one-dozen cartons is 0.48 eggs.
Answer:
The correct answer is b.
Answer choice a relates the expected value to a probability, which is incorrect. The expected value is the long-run mean of a random variable.
Answer choice c does not refer to the long-run aspect of the expected value.
Question 2.
Due to state funding, attendance is mandatory for students registered at a large community college. Students cannot miss more than eight days of class before being withdrawn from a course. The number of days a student is absent is a discrete random variable. The expected value of this random variable for students at this college is 3.5 days. Write an interpretation of this expected value.
Answer:
If many students at this college are asked how many days they have been absent, the average number would be 3.5 days.
Question 3.
The students at a large high school were asked to respond anonymously to the question:
How many speeding tickets have you received?
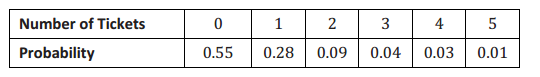
The table below displays the distribution of the number of speeding tickets received by students at this high school.
Compute the expected number of speeding tickets received. Interpret this mean in context.
Answer:
The expected number of speeding tickets received by students at this high school is as follows:
0(0.55) + 1(0.28) + 2(0.09) + 3(0.04) + 4(0.03) + 5(0.01) = 0.75
In the long run, students at this high school have received an average of 0.75 speeding tickets.
Question 4.
Employees at a large company were asked to respond to the question:
How many times do you bring your lunch to work each week?
The table below displays the distribution of the number of times lunch was brought to work each week by employees at this company.
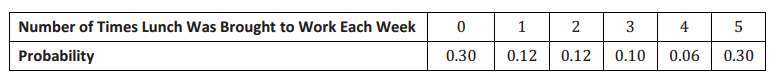
Compute the expected number of times lunch was brought to work each week. Interpret this mean in context.
Answer:
0(0.30) + 1(0.12) + 2(0.12) + 3(0.10) + 4(0.06) + 5(0.30) = 2.4
In the long run, employees at this company brought lunch, on average, 2.4 times each week.
Question 5.
Graduates from a large high school were asked the following:
How many total AP courses did you take from Grade 9 through Grade 12?
The table below displays the distribution of the total number of AP courses taken by graduates while attending this high school.
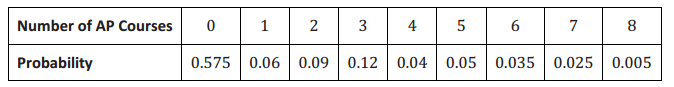
Compute the expected number of total AP courses taken per graduate. Interpret this mean in context.
Answer:
The expected number of AP courses taken is as follows:
0(0.575) + 1(0.06) + 2(0.09) + 3(0.12) + 4(0.04) + 5(0.05) + 6(0.035) + 7(0.025) + 8(0.005) = 1.435
If many high school graduates are asked how many AP courses were taken between Grades 9 and 12, the average number would be 1.435 AP courses.
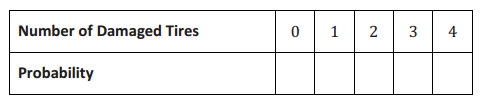
Question 6.
At an inspection center in a large city, the tires on the vehicles are checked for damage. The number of damaged tires is a discrete random variable. Create two different distributions for this random variable that have the same expected number of damaged tires. What is the expected number of damaged tires for the two distributions? Interpret the expected value.
Answer:
Answers will vary. Here is one example.
Distribution 1:
Answer:
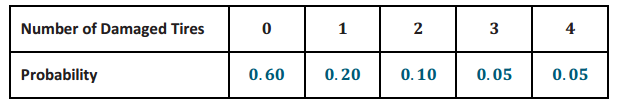
The expected number of damaged tires is as follows:
0(0.60) + 1(0.20) + 2(0.10) + 3(0.05) + 4(0.05) = 0.75
The expected number of damaged tires is 0.75.
Distribution 2:
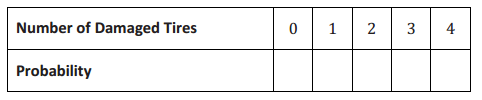
Answer:
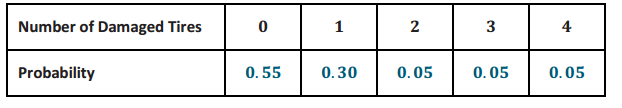
The expected number of damaged tires is as follows:
0(0.55) + 1(0.30) + 2(0.05) + 3(0.05) + 4(0.05) = 0.75
Because this inspection center examines the tires on the vehicles of a large number of customers, the inspectors find an average of 0.75 damaged tires per vehicle.
Eureka Math Precalculus Module 5 Lesson 8 Exit Ticket Answer Key
Question 1.
At a large university, students are allowed to register for no more than 7 classes. The number of classes for which a student is registered is a discrete random variable. The expected value of this random variable for students at this university is 4.15.
Write an interpretation of this expected value.
Answer:
If many students at this university are asked how many classes they are registered for, the average number would be 4.15 classes.