Are you searching for Go Math 8th Grade Answer Key Chapter 4 Nonproportional Relationships? If yes, then download Go Math Grade 8 Answer Key pdf from here in this article. It helps the students to score good marks in the exams. All the solutions are prepared by the math experts according to the latest edition. Get free access for all topics on Go Math Grade 8 Chapter 4 Nonproportional Relationships from here.
Go Math Grade 8 Answer Key Chapter 4 Nonproportional Relationships
Check the list of the exercises contained in Go Math Grade 8 Answer Key Chapter 4 Nonproportional Relationships. With the help of this Go Math Grade 8 Chapter 4 Nonproportional Relationships Solution Key students can improve their performance in the tests or assignments. Refer to HMH Go Math Grade 8 Chapter 4 Answer Key to complete your homework in time.
Lesson 1: Representing Linear Nonproportional Relationships
- Representing Linear Nonproportional Relationships – Page No. 98
- Representing Linear Nonproportional Relationships – Page No. 99
- Representing Linear Nonproportional Relationships – Page No. 100
Lesson 2: Determining Slope and y-intercept
- Determining Slope and y-intercept – Page No. 104
- Determining Slope and y-intercept – Page No. 105
- Determining Slope and y-intercept – Page No. 106
Lesson 3: Graphing Linear Nonproportional Relationships Using Slope and y-intercept
- Graphing Linear Nonproportional Relationships Using Slope and y-intercept – Page No. 110
- Graphing Linear Nonproportional Relationships Using Slope and y-intercept – Page No. 111
- Graphing Linear Nonproportional Relationships Using Slope and y-intercept – Page No. 112
Lesson 4: Proportional and Nonproportional Situations
- Proportional and Nonproportional Situations – Page No. 117
- Proportional and Nonproportional Situations – Page No. 118
- Proportional and Nonproportional Situations – Page No. 119
- Proportional and Nonproportional Situations – Page No. 120
Lesson 5: Representing Linear Nonproportional Relationships – Model Quiz
Mixed Review
Guided Practice – Representing Linear Nonproportional Relationships – Page No. 98
Make a table of values for each equation.
Question 1.
y = 2x + 5
Type below:
____________
Answer:
![]()
Explanation:
y = 2x + 5
Choose several values for x and substitute in the equation to find y.
x = 2(-2) + 5 = 1
x = 2(-1) + 5 = 3
x = 2(0) + 5 = 5
x = 2(1) + 5 = 7
x = 2(2) + 5 = 9
Explain why each relationship is not proportional.
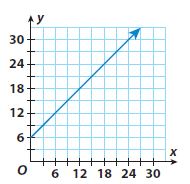
Question 4.
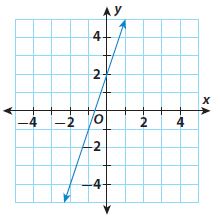
__________________
Answer:
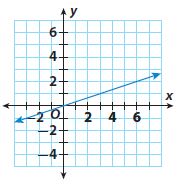
The graph is a straight line but does not pass through the origin. So, the relationship is not proportional.
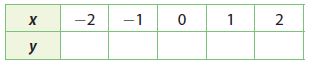
Complete the table for the equation. Then use the table to graph the equation.
Question 5.
y = x − 1
Type below:
____________
Answer:
![]()
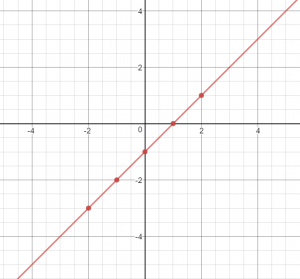
Explanation:
y = x – 1
Choose several values of x and substitute in the equation to find y to draw a table.
x = -2; y = -2 – 1 = -2
x = -1; y = -1 -1 = -2
x = 0; y = 0 -1 = -1
x = 1; y = 1 – 1 = 0
x = 2; y = 2 -1 = 1
Also, Plot the ordered pairs from the table. Then draw a line connecting the points to represent all the possible solutions
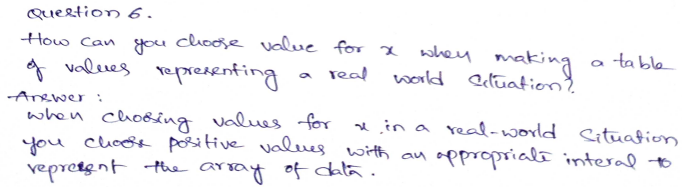
Essential Question Check-In
Independent Practice – Representing Linear Nonproportional Relationships – Page No. 99
State whether the graph of each linear relationship is a solid line or a set of unconnected points. Explain your reasoning.
Question 7.
The relationship between the number of $4 lunches you buy with a $100 school lunch card and the money remaining on the card
____________
Answer:
Set of unconnected points.
Explanation:
You cannot buy a fractional part of a lunch.
Set of unconnected points.
Question 8.
The relationship between time and the distance remaining on a 3-mile walk for someone walking at a steady rate of 2 miles per hour.
____________
Answer:
A solid line
Explanation:
The relationship between time and the distance remaining on a 3-mile walk for someone walking at a steady rate of 2 miles per hour. The distance remaining can be a fraction. The time can be in a fraction as well.
A solid line
Question 9.
Analyze Relationships
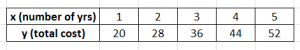
Simone paid $12 for an initial year’s subscription to a magazine. The renewal rate is $8 per year. This situation can be represented by the equation y = 8x + 12, where x represents the number of years the subscription is renewed and y represents the total cost.
a. Make a table of values for this situation.

Type below:
____________
Answer:
Explanation:
y = 8x + 12
Choose several values for x and substitute in the equation to find y.
Question 9.
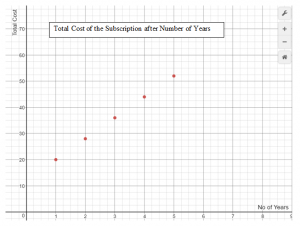
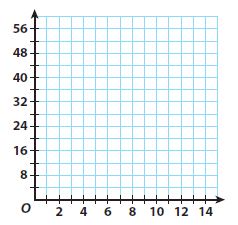
b. Draw a graph to represent the situation. Include a title and axis labels.
Type below:
____________
Answer:
Explanation:
Plot the ordered pairs from the table. Then draw a line connecting the points to represent all the possible solutions
Question 9.
c. Explain why this relationship is not proportional.
Type below:
____________
Answer:
It is not proportional as the graph does not pass through the origin
Explanation:
When a relationship is proportional, the graph of the equation passes through the origin.
It is not proportional as the graph does not pass through the origin
Question 9.
d. Does it make sense to connect the points on the graph with a solid line? Explain.
Type below:
____________
Answer:
No
Explanation:
No; The subscription is rewened for the entire year and cannot be done for a fraction of the year. The number of years must be a whole numb, so the total cost goes up in $8 increments.
Representing Linear Nonproportional Relationships – Page No. 100
Question 10.
Analyze Relationships
A proportional relationship is a linear relationship because the rate of change is constant (and equal to the constant of proportionality). What is required of a proportional relationship that is not required of a general linear relationship?
Type below:
____________
Answer:
The ratio between one quantity to the other quantity should be constant for a proportional linear relationship. The graph should be a straight line that passes through the origin.
Question 11.
Communicate Mathematical Ideas
Explain how you can identify a linear non-proportional relationship from a table, a graph, and an equation.
Type below:
____________
Answer:
In a table, the ratios y/x will not be equal. A graph will not pass through the origin. An equation will be in the form y = mx + b where b is not equal to 0.
Focus on Higher Order Thinking
Question 13.
Make a Conjecture
Two parallel lines are graphed on a coordinate plane. How many of the lines could represent proportional relationships? Explain.
Type below:
____________
Answer:
Maximum one
Explanation:
When there are two parallel lines, only one can pass through the origin and a line representing a proportional relationship must pass through the origin.
Maximum one
Guided Practice – Determining Slope and y-intercept – Page No. 104
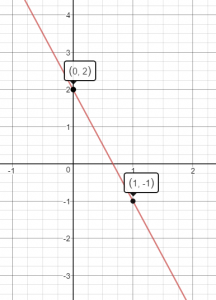
Find the slope and y-intercept of the line in each graph.
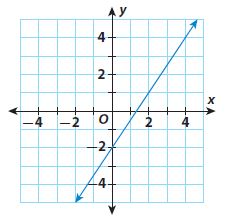
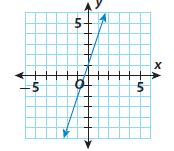
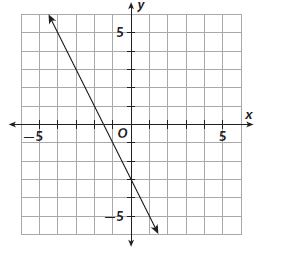
Question 1.
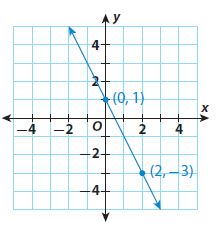
slope m = _____ y-intercept b = _____
m = ____________
b = ____________
Answer:
slope m = -2 y-intercept b = 1
m = -2
b = 1
Explanation:
Find the slope using two points from the grapgh by
Slope m = (y2 -y1)/(x2 – x1) where (x1, y1) = (0, 1) and (x2, y2) = (2, -3)
Slope m = (y2 -y1)/(x2 – x1) = (-3 – 1)/(2 – 0) = -4/2 = -2
From the graph when x = 0
y-intercept (b) = 1
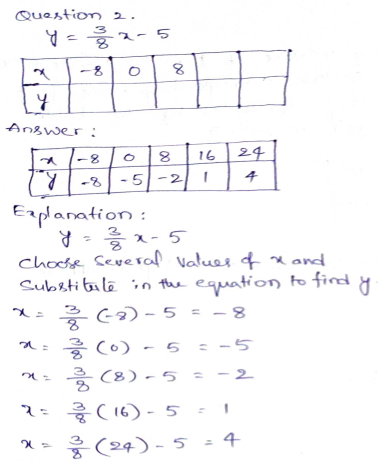
Question 2.
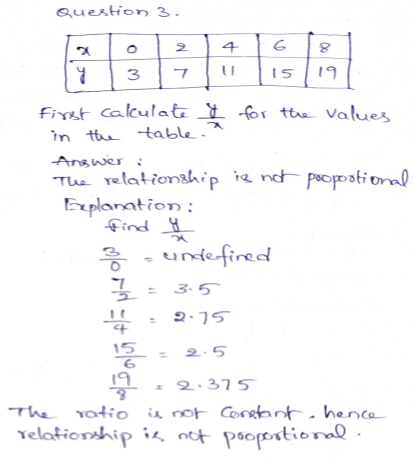
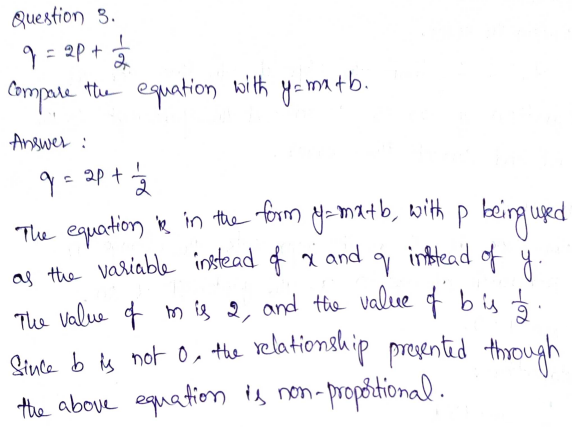
Question 3.
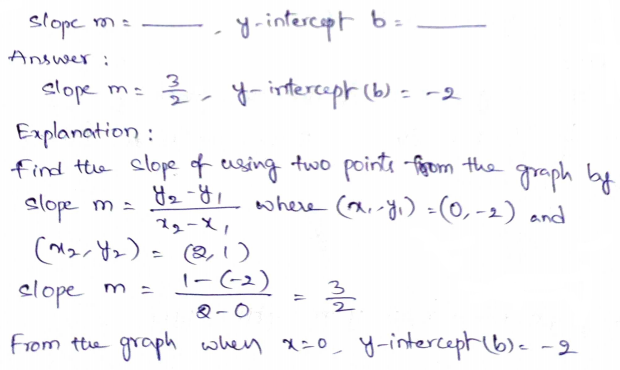
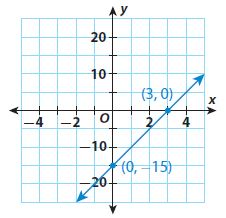
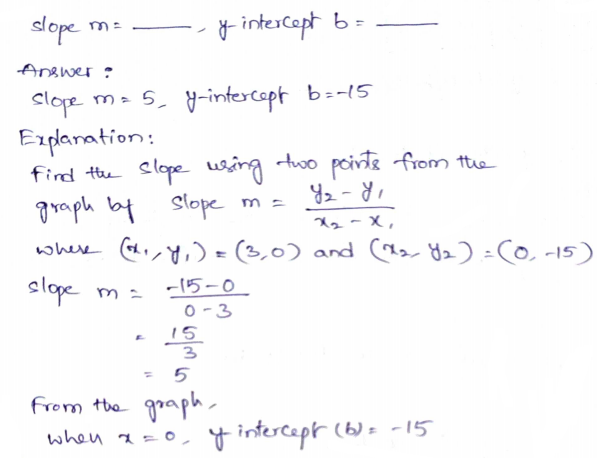
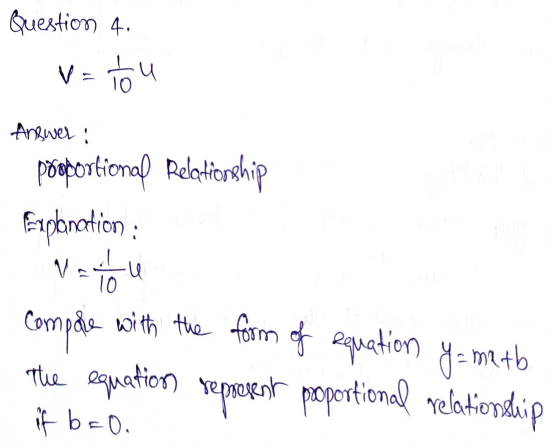
Question 4.
slope m = _____ y-intercept b = _____
m = ____________
b = ____________
Answer:
slope m = -3 y-intercept b = 9
m = -3
b = 9
Explanation:
Find the slope using two points from the grapgh by
Slope m = (y2 -y1)/(x2 – x1) where (x1, y1) = (3, 0) and (x2, y2) = (0, 9)
Slope m = (y2 -y1)/(x2 – x1) = (9 – 0))/(0 – 3) = -9/3 = -3
From the graph when x = 0
y-intercept (b) = 9
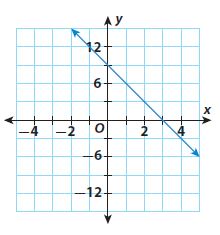
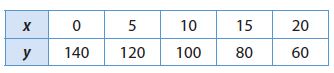
Find the slope and y-intercept of the line represented by each table.
Question 5.
Question 6.
Essential Question Check-In
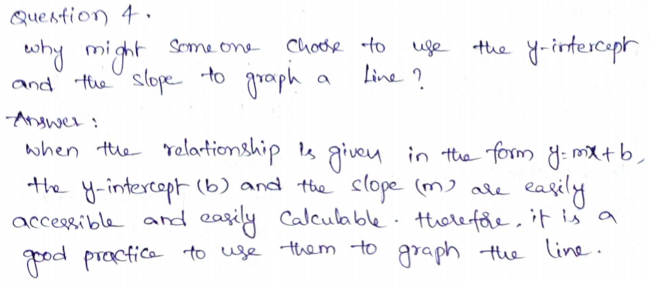
Question 7.
How can you determine the slope and the y-intercept of a line from a graph?
Type below:
____________
Answer:
Choose any two points on the line from the graph and use it to find the slope. Determine the point where the line crosses the y-axis to find the y-intercept.
Independent Pratice – Determining Slope and y-intercept – Page No. 105
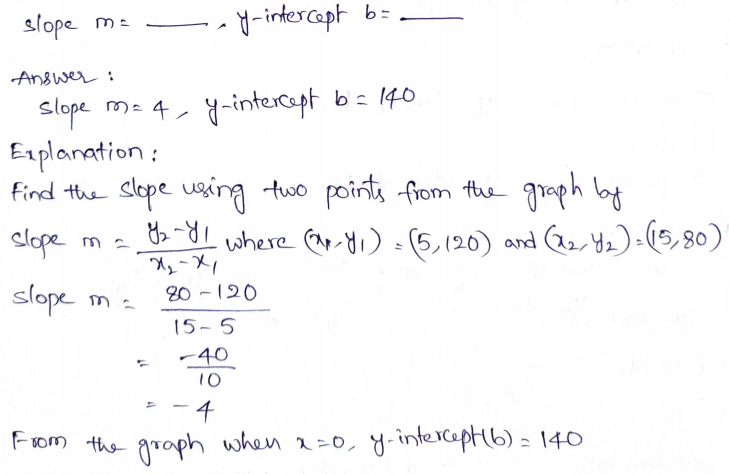
Question 8.
Some carpet cleaning costs are shown in the table. The relationship is linear. Find and interpret the rate of change and the initial value for this situation.
Type below:
_____________
Answer:
Find the slope using two points
Slope m = (y2 -y1)/(x2 – x1) where (x1, y1) = (1, 125) and (x2, y2) = (3, 225)
Slope m = (y2 -y1)/(x2 – x1) = (225 – 125)/(3 – 1) = 100/2 = 50
Find the initial value when the value of x is 0
Work backward from x = 1 to x = 0
(175 – 125)/(2 – 1) = 50/1 = 50
Subtract the difference of x and y from the first point.
x = 1 – 1 = 0
y = 125 – 50 = 75
y-intercept (b) = 75
The slope/rate of change represents the increase in the cost of cleaning the rooms for a unit increase in the number of rooms. The y-intercept shows the initial cost of carpet cleaning.
Question 9.
Make Predictions
The total cost to pay for parking at a state park for the day and rent a paddleboat are shown.

a. Find the cost to park for a day and the hourly rate to rent a paddleboat.
Type below:
_____________
Answer:
$5
Explanation:
Find the slope using two points
Slope m = (y2 -y1)/(x2 – x1) where (x1, y1) = (1, 17) and (x2, y2) = (2, 29)
Slope m = (y2 -y1)/(x2 – x1) = (29 – 17)/(2 – 1) = 12/1 = 12
Find the initial value when the value of x is 0
Work backward from x = 1 to x = 0
(29 – 17)/(2 – 1) = 12/1 = 12
Subtract the difference of x and y from the first point.
x = 1 – 1 = 0
y = 17 – 12 = 5
The cost to park for a day is $5.
Question 9.
b. What will Lin pay if she rents a paddleboat for 3.5 hours and splits the total cost with a friend? Explain.
$ _____________
Answer:
$23.5
Explanation:
When Lin paddles for 3.5hr
Total Cost = 3.5(12) + 5 = 47
Lin’s cost = 47/2 = 23.5
Question 10.
Multi-Step
Raymond’s parents will pay for him to take sailboard lessons during the summer. He can take half-hour group lessons or half-hour private lessons. The relationship between cost and the number of lessons is linear.
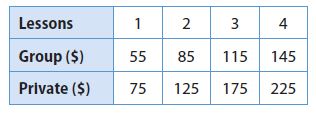
a. Find the rate of change and the initial value for the group lessons.
Type below:
____________
Answer:
$25
Explanation:
Find the slope using two points
Slope m = (y2 -y1)/(x2 – x1) where (x1, y1) = (1, 55) and (x2, y2) = (2, 85)
Slope m = (y2 -y1)/(x2 – x1) = (85 – 55)/(2 – 1) = 30/1 = 30
Rate of change is $30 per lesson
Find the initial value when the value of x is 0
Work backward from x = 1 to x = 0
(85 – 55)/(2 – 1) = 30/1 = 30
Subtract the difference of x and y from the first point.
x = 1 – 1 = 0
y = 55 – 30 = 25
The initial value of the group lesson is $25.
Question 10.
b. Find the rate of change and the initial value for the private lessons.
Type below:
_____________
Answer:
$25
Explanation:
Find the slope using two points
Slope m = (y2 -y1)/(x2 – x1) where (x1, y1) = (1, 75) and (x2, y2) = (2, 125)
Slope m = (y2 -y1)/(x2 – x1) = (125 – 75)/(2 – 1) = 50/1 = 50
Rate of change is $50 per lesson
Find the initial value when the value of x is 0
Work backward from x = 1 to x = 0
(125 – 75)/(2 – 1) = 50/1 = 50
Subtract the difference of x and y from the first point.
x = 1 – 1 = 0
y = 75 – 50 = 25
The initial value of the private lesson is $25.
Question 10.
c. Compare and contrast the rates of change and the initial values.
Type below:
_____________
Answer:
The initial value for both types of lessons is the same. The rate of change is higher for private lessons than group lesson
Explanation:
Compare the results of a and b
The initial value for both types of lessons is the same. The rate of change is higher for private lessons than group lesson
Vocabulary – Determining Slope and y-intercept – Page No. 106
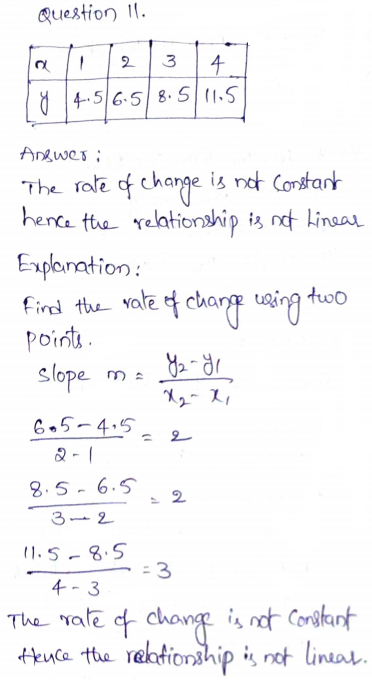
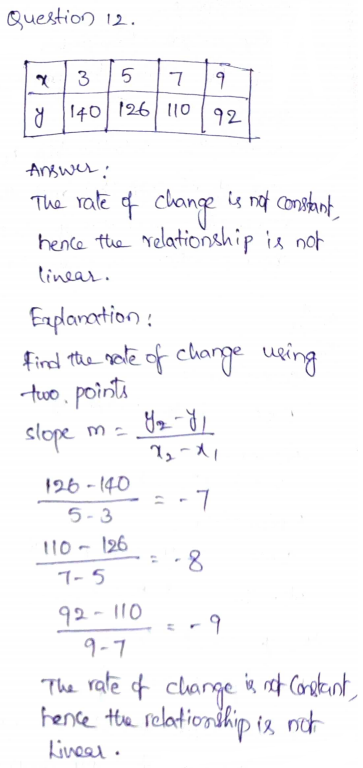
Explain why each relationship is not linear.
H.O.T.
Focus on Higher Order Thinking
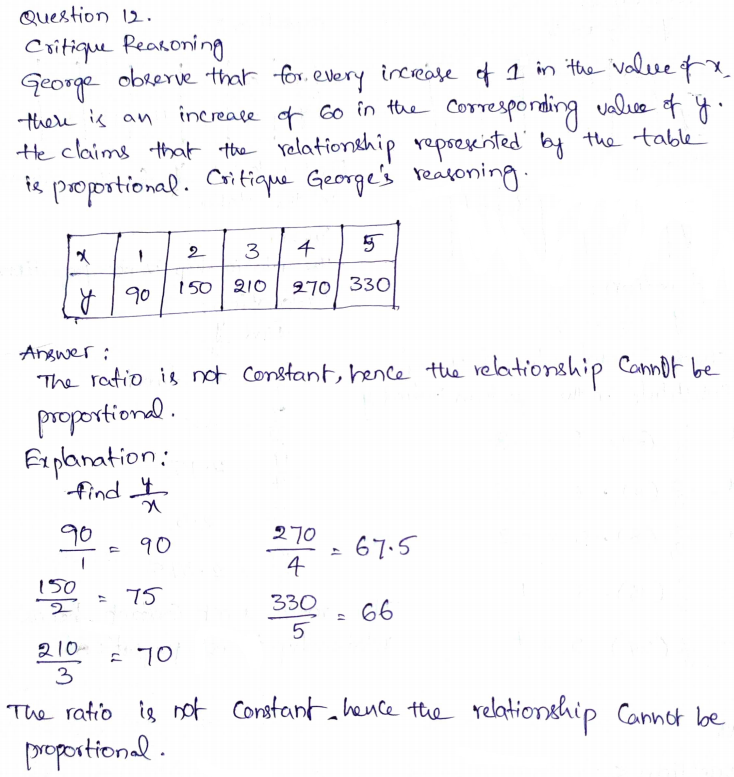
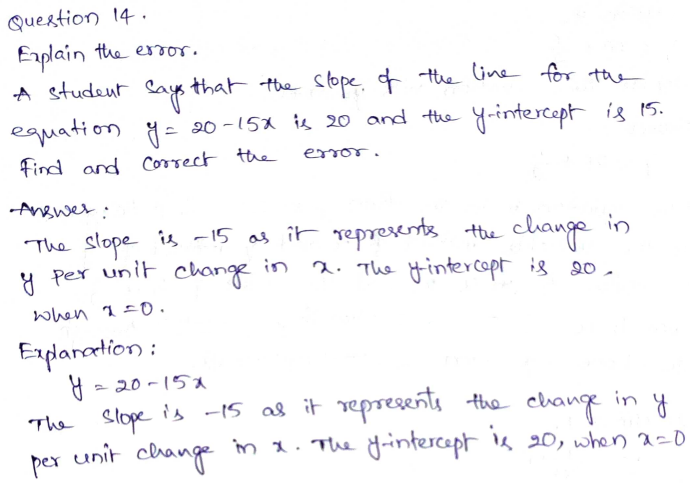
Question 14.
Critique Reasoning
Your teacher asked your class to describe a real-world situation in which a y-intercept is 100 and the slope is 5. Your partner gave the following description: My younger brother originally had 100 small building blocks, but he has lost 5 of them every month since.
a. What mistake did your partner make?
Type below:
_____________
Answer:
If the brother loses 5 blocks every month, the slope would be -5 and not 5.
Explanation:
When the initial value is decreasing, the slope is negative.
If the brother loses 5 blocks every month, the slope would be -5 and not 5.
Question 14.
b. Describe a real-world situation that does match the situation.
Type below:
_____________
Answer:
I bought a 100 card pack and buy 5 additional cards every month.
Explanation:
Real world situation
I bought a 100 card pack and buy 5 additional cards every month.
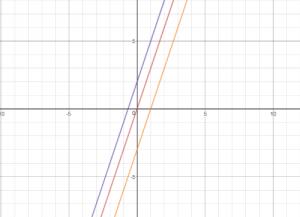
Question 15.
Justify Reasoning
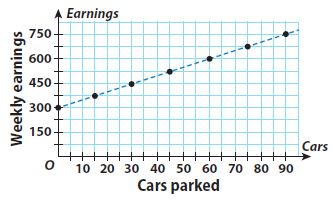
John has a job parking cars. He earns a fixed weekly salary of $300 plus a fee of $5 for each car he parks. His potential earnings for a week are shown in the graph. At what point does John begin to earn more from fees than his fixed salary? Justify your answer.
Type below:
_____________
Answer:
After parking 60 cars, John’s earning become $600 double of his initial base salary of $300.
Hence, after parking 61 cars, his earning from the fee becomes more than his fixed salary.
Explanation:
He earns the same in fees as his fixed salary for perking 300/5 = 60
After parking 60 cars, John’s earning become $600 double of his initial base salary of $300.
Hence, after parking 61 cars, his earning from the fee becomes more than his fixed salary.
Guided Practice – Graphing Linear Nonproportional Relationships Using Slope and y-intercept – Page No. 110
Graph each equation using the slope and the y-intercept.
Question 1.
y = \(\frac{1}{2}\)x − 3
slope = _____ y-intercept = _____
Type below:
_____________
Answer:
slope = 1/2 y-intercept = -3
Explanation:
y = 1/2 x – 3
The y-intercept is b = -3. Plot the point that contains the y-intercept (0, -3)
The slope m = 1/2. Use the slope to find a second point. From (0, -3) count 1 unit up and 2 unit right. The new point is (2, -2)
Draw a line through the points
Question 2.
y = −3x + 2
slope = _____ y-intercept = _____
Type below:
_____________
Answer:
slope = -3 y-intercept = 2
Explanation:
y = -3x + 2
The y-intercept is b = 2. Plot the point that contains the y-intercept (0, 2)
The slope m = -3/1. Use the slope to find a second point. From (0, 2) count 3 unit down and 1 unit right. The new point is (1, -1)
Draw a line through the points
Question 3.
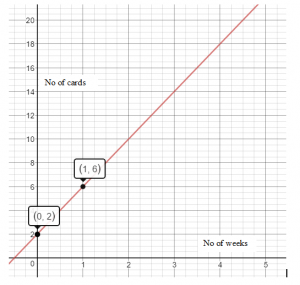
A friend gives you two baseball cards for your birthday. Afterward, you begin collecting them. You buy the same number of cards once each week. The equation y = 4x + 2 describes the number of cards, y, you have after x weeks.
a. Find and interpret the slope and the y-intercept of the line that represents this situation. Graph y = 4x + 2. Include axis labels.
Type below:
_____________
Answer:
Explanation:
y = 4x + 2
The y-intercept is b = 2. Plot the point that contains the y-intercept (0, 2)
The slope m = 4. Use the slope to find a second point. From (0, 2) count 4 unit up and 1 unit right. The new point is (1, 6)
Draw a line through the points
Question 3.
b. Discuss which points on the line do not make sense in this situation. Then plot three more points on the line that do make sense.
Type below:
_____________
Answer:
Explanation:
The points with a negative value of x or y do not make sense as the number of cards or weeks cannot be negative.
Essential Question Check-In
Independent Practice – Graphing Linear Nonproportional Relationships Using Slope and y-intercept – Page No. 111
Question 5.
Science
A spring stretches in relation to the weight hanging from it according to the equation y = 0.75x + 0.25 where x is the weight in pounds and y is the length of the spring in inches.
a. Graph the equation. Include axis labels.
Type below:
_____________
Answer:
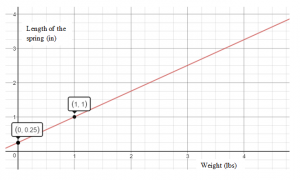
Explanation:
y = 0.75x + 0.25
Slope m = 0.75 and y-intercept = 0.25
Plot the point that contains the y-intercept (0, 0.25)
The slope is m = 0.75/1. Use the slope to find a second point. From (0,0.25) count 0.75 unit up and 1 unit right. The new point is (1, 1)
Question 5.
b. Interpret the slope and the y-intercept of the line.
Type below:
_____________
Answer:
The slope represents the increase in the length of spring in inches for each increase of pound of weight. y-intercept represents the unstretched length of the spring When there is no weight attached.
Question 5.
c. How long will the spring be if a 2-pound weight is hung on it? Will the length double if you double the weight? Explain
Type below:
_____________
Answer:
When there is a 2-pound weight hung, the length of the spring would be 1.75 inches. No, When there is a 4-pound weight hung, the length of the spring would be 3.25 inches and not 3.5 inches.
Look for a Pattern
Identify the coordinates of four points on the line with each given slope and y-intercept.
Question 6.
slope = 5, y-intercept = -1
Type below:
_____________
Answer:
(2, 9)
(3, 14)
Explanation:
slope = 5, y-intercept = -1
Plot the point that contains the y-intercept (0, -1)
The slope is m = 5/1. Use the slope to find a second point. From (0, -1) count 5 unit up and 1 unit right. The new point is (1, 4)
Follow the same procedure to find the remaining three points.
(2, 9)
(3, 14)
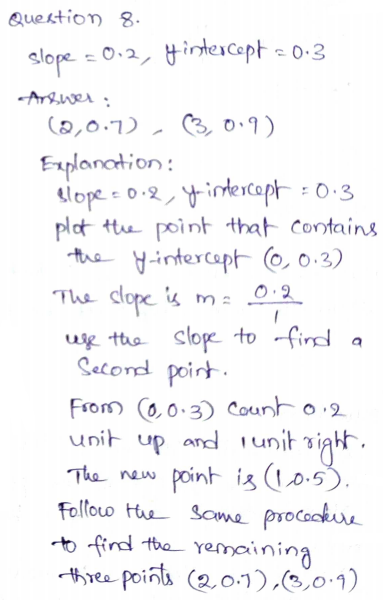
Question 9.
slope = 1.5, y-intercept = -3
Type below:
_____________
Answer:
(2, 0)
(3, 1.5)
Explanation:
slope = 1.5, y-intercept = -3
Plot the point that contains the y-intercept (0, -3)
The slope is m = 1.5/1. Use the slope to find a second point. From (0, -3) count 1.5 unit up and 1 unit right. The new point is (1, -1.5)
Follow the same procedure to find the remaining three points.
(2, 0)
(3, 1.5)
Question 10.
slope = −\(\frac{1}{2}\), y-intercept = 4
Type below:
_____________
Answer:
(4, 2)
(6, 1)
Explanation:
slope = −\(\frac{1}{2}\), y-intercept = 4
Plot the point that contains the y-intercept (0, 4)
The slope is m = −\(\frac{1}{2}\)/1. Use the slope to find a second point. From (0, 4) count 1 unit down and 2 unit right. The new point is (2, 3)
Follow the same procedure to find the remaining three points.
(4, 2)
(6, 1)
Question 11.
slope = \(\frac{2}{3}\), y-intercept = -5
Type below:
_____________
Answer:
(6, -1)
(9, 1)
Explanation:
slope = \(\frac{2}{3}\), y-intercept = -5
Plot the point that contains the y-intercept (0, -5)
The slope is m = \(\frac{2}{3}\). Use the slope to find a second point. From (0, -5) count 2 unit up and 3 unit right. The new point is (3, -3)
Follow the same procedure to find the remaining three points.
(6, -1)
(9, 1)
Question 12.
A music school charges a registration fee in addition to a fee per lesson. Music lessons last 0.5 hour. The equation y = 40x + 30 represents the total cost y of x lessons. Find and interpret the slope and y-intercept of the line that represents this situation. Then find four points on the line.
Type below:
_____________
Answer:
y = 40x + 30
Slope = 40
y-intercept = 30
The slope represents the fee of the classes per lesson and y-intercept represents the registration fee.
Plot the point that contains the y-intercept (0, 30)
The slope is m = 40/1. Use the slope to find a second point. From (0, 30) count 40 unit up and 1 unit right. The new point is (1, 70)
Follow the same procedure to find the remaining three points.
(2, 110)
(3, 150)
Graphing Linear Nonproportional Relationships Using Slope and y-intercept – Page No. 112
Question 13.
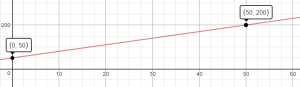
A public pool charges a membership fee and a fee for each visit. The equation y = 3x + 50 represents the cost y for x visits.
a. After locating the y-intercept on the coordinate plane shown, can you move up three gridlines and right one gridline to find a second point? Explain.
Type below:
_____________
Answer:
Yes
Explanation:
Yes; Since the horizontal and vertical gridlines each represents 25 units, hence moving up 3 gridlines and right 1 gridline represent a slope a 75/25 or 3
Question 13.
b. Graph the equation y = 3x + 50. Include axis labels. Then interpret the slope and y-intercept.
Type below:
_____________
Answer:
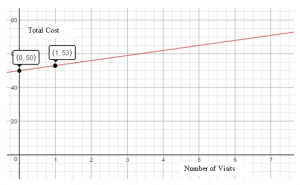
The slope represents the fee per visit and the y-intercept represents the membership fee.
Explanation:
Slope = 3
y-intercept = 50
The slope represents the fee of the classes per lesson and the y-intercept represents the registration fee.
Plot the point that contains the y-intercept (0, 50)
The slope is m = 3/1. Use the slope to find a second point. From (0, 50) count 3 unit up and 1 unit right. The new point is (1, 53)
Question 13.
c. How many visits to the pool can a member get for $200?
______ visits
Answer:
50 visits
Explanation:
You would get 50 visits for $200
H.O.T.
Focus on Higher Order Thinking
Question 16.
Make a Conjecture
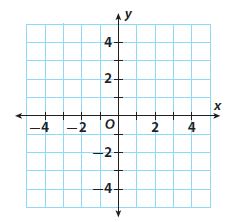
Graph the lines y = 3x, y = 3x − 3, and y = 3x + 3. What do you notice about the lines? Make a conjecture based on your observation.
Type below:
_____________
Answer:
Explanation:
let’s tale the example
y = 3x
y = 3x – 3
y = 3x + 3
We notice that the lines are parallel to each other: the slopes of the lines are equal but the y-intersection point differs.
Guided Practice – Proportional and Nonproportional Situations – Page No. 117
Determine if each relationship is a proportional or nonproportional situation. Explain your reasoning.
Question 1.
Look at the origin.
_____________
Answer:
Proportional relationship
Explanation:
Proportional relationship
The graph passes through the origin. Graph of a proportional relationship must pass through the origin
Question 2.
_____________
Answer:
Non-proportional relationship
Explanation:
The graph does not pass through the origin. The graph of a proportional relationship must pass through the origin
Non-proportional relationship
Proportional and Nonproportional Situations – Page No. 118
The tables represent linear relationships. Determine if each relationship is a proportional or nonproportional situation.
Question 5.
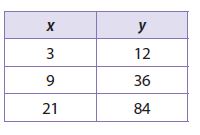
Find the quotient of y and x.
_____________
Answer:
proportional relationship
Explanation:
Find the ratio y/x
12/3 = 4
36/9 = 4
84/21 = 4
Since the ratio is constant, the relationship is proportional.
Question 6.
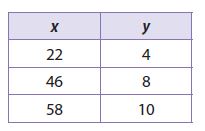
_____________
Answer:
non-proportional
Explanation:
Find the ratio y/x
4/22 = 2/11
8/46 = 4/23
10/58 = 5/29
Since the ratio is not constant, the relationship is non-proportional.
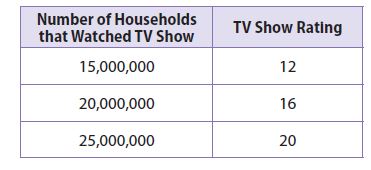
Question 7.
The values in the table represent the numbers of households that watched three TV shows and the ratings of the shows. The relationship is linear. Describe the relationship in other ways.
Type below:
_____________
Answer:
proportional relationship
Explanation:
Find the ratio y/x
12/15,000,000 = 0.0000008
16/20,000,000 = 0.0000008
20/25,000,000 = 0.0000008
Since the ratio is constant, the relationship is proportional.
Essential Question Check-In
Question 8.
How are using graphs, equations, and tables similar when distinguishing between proportional and nonproportional linear relationships?
Type below:
_____________
Answer:
The ratio between y to x is constant when the relationship is proportional. Graphs, tables, and equations all can be used to find the ratio. The ratio is not constant when the relationship is non-proportional.
Independent Practice – Proportional and Nonproportional Situations – Page No. 119
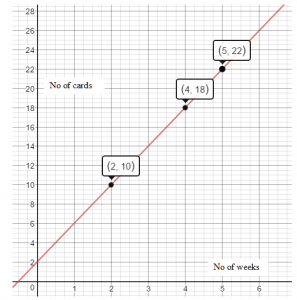
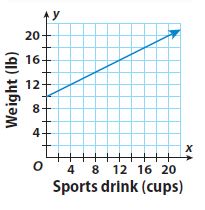
Question 9.
The graph shows the weight of a cross-country team’s beverage cooler based on how much sports drink it contains.
a. Is the relationship proportional or nonproportional? Explain.
_____________
Answer:
Non-proportional
Explanation:
The graph does not pass through the origin. The graph of a proportional relationship must pass through the origin
Non-proportional
Question 9.
b. Identify and interpret the slope and the y-intercept.
Type below:
_____________
Answer:
Slope m = (y2 -y1)/(x2 – x1) = (12 – 10)/(4 – 0) = 0.5
the y-intercept is the weight of the empty cooler, which is 10 lbs.
Explanation:
Find the slope using two points from the graph by
Slope m = (y2 -y1)/(x2 – x1) where (x1, y1) = (0, 10) and (x2, y2) = (4, 12)
Slope m = (y2 -y1)/(x2 – x1) = (12 – 10)/(4 – 0) = 0.5
From the graph when x = 0
y-intercept (b) = 10
the y-intercept is the weight of the empty cooler, which is 10 lbs.
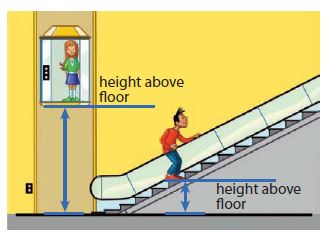
In 10–11, tell if the relationship between a rider’s height above the first floor and the time since the rider stepped on the elevator or escalator is proportional or nonproportional. Explain your reasoning.
Question 10.
The elevator paused for 10 seconds after you stepped on before beginning to rise at a constant rate of 8 feet per second.
_____________
Answer:
Non-proportional
Explanation:
As there is a pause of 10 seconds, it would be the y-intercept of the graph (when x = 0)
Non-proportional
Question 11.
Your height, h, in feet above the first floor on the escalator is given by h = 0.75t, where t is the time in seconds.
_____________
Answer:
Proportional
Explanation:
Comparing with y = mx + b, where b = 0
Proportional
Analyze Relationships
Compare and contrast the two graphs.
Question 12.
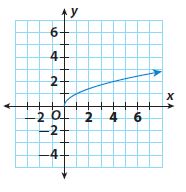
Graph A Graph B
y = \(\frac{1}{3}\) x y = \(\sqrt { x } \)
Type below:
_____________
Answer:
Graph A represents a linear relationship while Graph B represents an exponential relationship. They both pass through the origin and the value of y increases with an increase in x.
Proportional and Nonproportional Situations – Page No. 120
Question 13.
Represent Real-World Problems
Describe a real-world situation where the relationship is linear and nonproportional.
Type below:
_____________
Answer:
The entrance fee to the amusement park is $8 and there is a fee of $2 per ride.
H.O.T.
Focus on Higher Order Thinking
Question 14.
Mathematical Reasoning
Suppose you know the slope of a linear relationship and one of the points that its graph passes through. How can you determine if the relationship is proportional or nonproportional?
Type below:
_____________
Answer:
Use the graph and the given point to determine the second point. Connect the two points by a straight line. If the graph passes through the origin, the relationship is proportional and if the graph does not pass through the origin, the relationship is non-proportional.
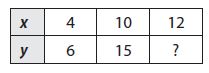
Question 15.
Multiple Representations
An entrant at a science fair has included information about temperature conversion in various forms, as shown. The variables F, C, and K represent temperatures in degrees Fahrenheit, degrees Celsius, and kelvin, respectively.
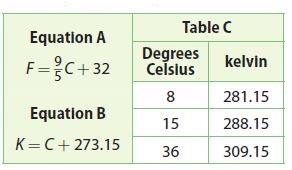
a. Is the relationship between kelvins and degrees Celsius proportional? Justify your answer in two different ways.
_____________
Answer:
No, the relationship is not proportional.
Explanation:
Compare equation B to the form: y = mx + b. Since b is not equal to 0, the relationship is non-proportional.
Find the ratio between the Kelvin and Degrees Celsius. Since the ratio is not constant, the relationship is non-proportional.
281.15/8 = 35.14
288.15/15 = 19.21
309.15/36 = 8.59
No, the relationship is not proportional.
Question 15.
b. Is the relationship between degrees Celsius and degrees Fahrenheit proportional? Why or why not?
_____________
Answer:
No, the relationship is not proportional.
Explanation:
Compare equation A to the form: y = mx + b. Since b is not equal to 0, the relationship is non-proportional.
No, the relationship is not proportional.
4.1 Representing Linear Nonproportional Relationships – Model Quiz – Page No. 121
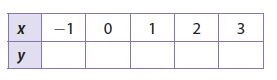
Question 1.
Complete the table using the equation y = 3x + 2.
Type below:
_____________
Answer:
![]()
Explanation:
Given y = 3x + 2
![]()
x = -1; y = 3(-1) + 2 = -3 + 2 = -1
x = 0; y = 3(0) +2 = 2
x = 1; y = 3(1) + 2 = 3 + 2 = 5
x = 2; y = 3(2) + 2 = 6 + 2 = 8
x = 3: y = 3(3) + 2 = 9 + 2 = 11
4.2 Determining Slope and y-intercept
Question 2.
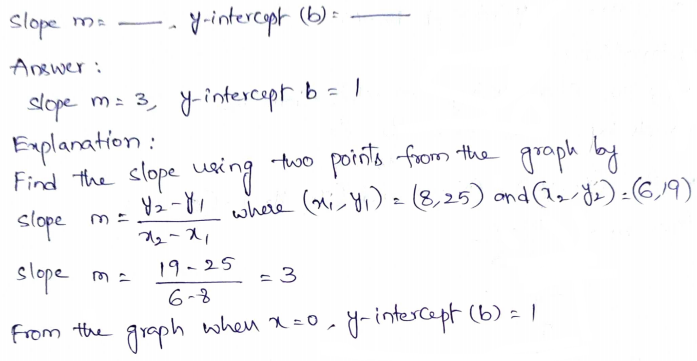
Find the slope and y-intercept of the line in the graph.
Type below:
_____________
Answer:
Slope = 3
y-intercept (b) = 1
Explanation:
Find the slope using two points from the graph by
Slope m = (y2 -y1)/(x2 – x1) where (x1, y1) = (0, 1) and (x2, y2) = (1, 4)
Slope m = (y2 -y1)/(x2 – x1) = (4 – 1)/(1 – 0) = 3/1
From the graph when x = 0
y-intercept (b) = 1
4.3 Graphing Linear Nonproportional Relationships
Question 3.
Graph the equation y = 2x − 3 using slope and y-intercept.
Type below:
_____________
Answer:
Explanation:
Slope = 2
y-intercept = -3
Plot the point that contains the y-intercept (0, -3)
The slope is m = 2/1. Use the slope to find a second point. From (0, -3) count 2 units up and 1 unit right. The new issue is (1, -1)
Draw a line through the points
4.4 Proportional and Nonproportional Situations
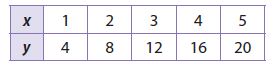
Question 4.
Does the table represent a proportional or a nonproportional linear relationship?
_____________
Answer:
Since the ratio is constant, the table represents a proportional linear relationship.
Explanation:
Find the ratio y/x
4/1 = 4
8/2 = 4
12/3 = 4
16/4 = 4
20/5 = 4
Since the ratio is constant, the table represents a proportional linear relationship.
Question 5.
Does the graph in Exercise 2 represent a proportional or a nonproportional linear relationship?
_____________
Answer:
It represents a non-proportional linear relationship
Explanation:
The line of the graph does not pass through the origin. The graph of a proportional relationship must pass through the origin.
It represents a non-proportional linear relationship
Question 6.
Does the graph in Exercise 3 represent a proportional or a nonproportional relationship?
_____________
Answer:
It represents a non-proportional linear relationship
Explanation:
The line of the graph does not pass through the origin. The graph of a proportional relationship must pass through the origin
It represents a non-proportional linear relationship
Essential Question
Question 7.
How can you identify a linear nonproportional relationship from a table, a graph, and an equation?
Type below:
_____________
Answer:
In a table, the ratio of y/x is not constant for a non-proportional relationship.
In a graph, the line of the graph does not pass through the origin for a non-proportional relationship.
In an equation, the b is not equal to y = mx +b for a non-proportional relationship.
Selected Response – Mixed Review – Page No. 122
Question 1.
The table below represents which equation?
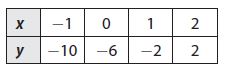
Options:
a. y = −x − 10
b. y = −6x
c. y = −4x − 6
d. y = −4x + 2
Answer:
c. y = −4x − 6
Explanation:
From the table, you can see that the y-intercept (when x = 0) is b = -6. Comparable to y = mx + b
The table is represented by Option C y = -4x – 6
Question 2.
The graph of which equation is shown below?
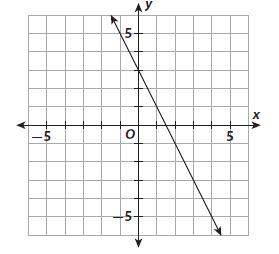
Options:
a. y = −2x + 3
b. y = −2x + 1.5
c. y = 2x + 3
d. y = 2x + 1.5
Answer:
a. y = −2x + 3
Explanation:
From the table, you can see that the y-intercept (when x = 0) is b = 3. Comparable to y = mx + b
Options B and D are rejected.
Since the graph is slanting downwards, the slope is negative.
Option C is rejected
The graph represents y = -2x + 3
Question 5.
The table shows a proportional relationship. What is the missing y-value?
Options:
a. 16
b. 20
c. 18
d. 24
Answer:
c. 18
Explanation:
Find the ratio y/x
6/4 = 3/2
Since the relationship is proportional, the ratio is constant.
Using the ratio to find missing y
3/2 = y/12
y = 3/2 × 12 = 18
Question 6.
What is 0.00000598 written in scientific notation?
Options:
a. 5.98 × 10⁻⁶
b. 5.98 × 10⁻⁵
c. 59.8 × 10⁻⁶
d. 59.8 × 10⁻⁷
Answer:
c. 59.8 × 10⁻⁶
Explanation:
0.00000598
Move the decimal 6 points
59.8 × 10⁻⁶
Mini-Task
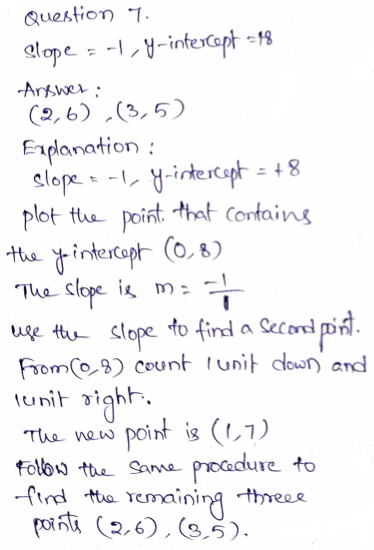
Question 7.
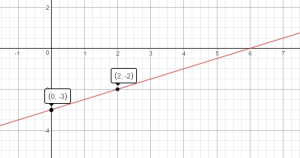
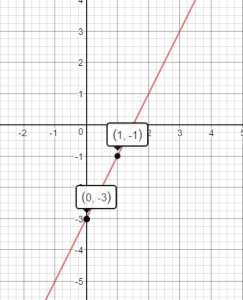
The graph shows a linear relationship.
a. Is the relationship proportional or nonproportional?
____________
Answer:
It represents a non-proportional linear relationship
Explanation:
The line of the graph does not pass through the origin. The graph of a proportional relationship must pass through the origin.
It represents a non-proportional linear relationship
Question 7.
b. What is the slope of the line?
_______
Answer:
Slope m = -2
Explanation:
Find the slope using two points from the graph by
Slope m = (y2 -y1)/(x2 – x1) where (x1, y1) = (0, -2) and (x2, y2) = (2, 1)
Slope m = (y2 -y1)/(x2 – x1) = (-3 -1)/(0 + 2) = -4/2 = -2
Question 7.
c. What is the y-intercept of the line?
_______
Answer:
y-intercept (b) = -3
Explanation:
From the graph when x = 0
y-intercept (b) = -3
Question 7.
d. What is the equation of the line?
Type below:
____________
Answer:
y = -2x – 3
Explanation:
Substitute m and b in the form: y = mx + b
y = -2x – 3
Conclusion:
I believe that our Go Math Grade 8 Answer Key Chapter 4 Nonproportional Relationships pdf brought a smile to your face. All beginners can easily start their practice with our step-by-step explanations. Bookmark our ccssanswers.com to get the latest information about the solutions.