In this article, we can learn how to calculate the Mode in statistics, its definition, Types of Modes, Advantages, and Example Problems. The purpose of statistics is to make us learn to utilize a restricted sample to make accurate determinations. Statistics deals with the presentation of data, collection of data, and analysis of data or information for a particular purpose.
In statistics to represent the data, we use bar graphs, piecharts, tables, graphs, pictorial representation, and so on. The frequency in statistics tends to represent a set of data by a representative value which would define the entire collection of data. This representative value is known as the measure of central tendency. One such measure of central tendency is the mode of data.
Also, Check Related Articles:
Mode – Definition
A Mode is defined as the value that appears most frequently in a data set. It is the value that appears the most number of times. A set of data or values may have one mode, more than one mode, or no mode at all. The central tendency includes the mean, or the average of a set, and the median, the middle value in a set.
Consider an example of mode on statistics is,
Example: Find the mode of a given set of data 4, 3, 3, 6, 7.
Solution: Given the data set is 4, 3, 3, 6, 7.
The mode of the data is 3 because it has a higher frequency it means it will be repeated more time. In this example, the mode value will be repeated two times.
The mode’s main advantage is, it can be applied to any type of data set, and the remaining two central tendencies mean and median can not be applied to nominal data and it is also not affected by outliers. The disadvantage of mode is, it cannot be used for more detailed analysis.
Types of Mode
Based on modes in a data set, Modes are of three types namely:
- Unimodal
- Bimodal
- Trimodal
- Multimodal
Unimodal: When the given data gas one mode is called Unimodal.
Bimodal: When the given data set has two modes, it is called Bimodal. Consider the example of bimodal is as shown below,
Example: Find the mode of set X = { 1, 2, 3, 3, 4, 4, 4, 5, 6, 6, 6}
Solution: Given the data set is 1, 2, 3, 3, 4, 4, 4, 5, 6, 6, 6
Mode = {4, 6}
The mode of X is 4 and 5 because both 4 and 5 are repeated in the given set those are two modes called bimodal.
Trimodal: When the given data set has three modes, it is called Trimodal. Consider the example of trimodal is as shown below,
Example: Find the mode of the set A = {1, 2, 2, 2, 3, 3, 4, 4, 5, 5, 5, 6, 6, 6}
Solution: Given the data set is 1, 2, 2, 2, 3, 3, 4, 4, 5, 5, 5, 6, 6, 6
Therefore, the Mode is = {2, 5, 6}
The mode of A is 2, 5, 6 because these values repeated, these three modes called Trimodal.
Multimodal: When the given data set has four or more modes is called Multimodal. Consider an example of Multimodal is as shown below,
Example: Find the mean of data set is 2, 3, 4, 5, 5, 5, 7, 6, 9, 9, 9, 12, 12, 12, 10, 1, 1, 1
Solution: Given the data set is 2, 3, 4, 5, 5, 5, 7, 6, 9, 9, 9, 12, 12, 12, 10, 1, 1, 1
Therefore, the Mode is = {5, 9, 12, 1}
The mode of given data is 5, 9, 12, 1 because these values are repeated three times in the data. So, it has more than three modes (or) four modes it is called Multimodal.
Data Series of Mode
Mode is the value that occurs maximum time in the data set or data series. The series are 3 types:
- Individual Series – The mode of an individual series is defined as simply finding the value or data that occurs a maximum number of times.
- Discrete Series – In this mode, the value has higher frequencies.
- Continuous Series or Frequency distribution Series – In this mode, first we need to find the modal class. Modal class is one of the highest frequency classes.
Mode Formula for grouped Frequency Distribution
In a grouped frequency distribution, the mode calculation is not possible for the frequency. To determine the mode of data in such cases we can calculate the modal class. Mode lies inside the modal class. The grouped frequency distribution mode formula is given as,
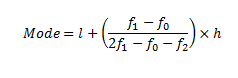
The mode of grouped frequency distribution formula is shown as above. In the formula,
where,
f0 = frequency of the category preceding the modal class
f1 = frequency of the modal class
f2 = frequency of the category succeeding the modal class
l = lower limit of the modal class
h = size of the class interval
Ungrouped Frequency Distribution Mode
In Ungrouped data, the observations that occur the most will be the mode of the observation. Observations could also be bimodal or multimodal. With frequency distribution, the observations with the highest frequency will be the modal observation.
Example Problems on Mode
Example 1:
Find the mode of 3, 5, 7, 9, 2, 1?
Solution:
Given the values are 3, 5, 7, 9, 2, 1
Now we are finding the mode of given data.
Mode means high-frequency value. But in this example, no value in the data set is repeated more than one time.
Hence, the set of a given data has no mode value.
Example 2:
Find the mode of the data set {2, 3, 3, 3, 4, 5, 5, 5, 7, 8, 8, 8}
Solution:
Given the data set is 2, 3, 3, 3, 4, 5, 5, 5, 7, 8, 8, 8
Now we find the mode of the given data set.
Mode = {3, 5, 8}
In this, the mode sets are 3, 5, 8, because the values are 3, 5, 8 are repeated. So it has three mode sets. Three mode sets are called Trimodal.
Hence, the mode of given data is 3, 5, 8.
Example 3:
Marks obtained by 30 students of a class are tabulated below. The highest mark is 25. Find the mode?
| Marks Obtained | Number of Students |
|---|---|
| 0 – 5 | 1 |
| 5 – 10 | 4 |
| 10 – 15 | 7 |
| 15 – 20 | 14 |
| 20 – 25 | 4 |
Solution:
Given the data in the form of tabular format
The total number of students is 30.
The maximum class frequency is 14 and the class interval corresponding frequency is 15 – 20. So, the modal class is 15 – 20.
The maximum class frequency is 12 and the class interval corresponding to this frequency is 20 – 30. Thus, the modal class is 20 – 30.
The modal class of lower limit (l) = 15
Size of the class interval (h) = 5
Frequency of the modal class (f1) = 14
Frequency of the category preceding the modal class (f0) = 1
Frequency of the category succeeding the modal class (f2)= 7
We know the formula of grouped frequency Mode.
Substituting the given values within the formula we get;
Mean = 15 + ((14 – 1) / (2 x 14 – 1 – 7)) = 15 + ((13) / (6)) = 15 + 2. 166 = 17. 166
Therefore, the mode of a given data set is 17. 166.
Example 4: Find the mode of 5, 5, 5, 6, 7, 15, 15, 15, 28, 49 data set.
Solution: Given the data set is 5, 5, 5, 6, 7, 15, 15, 15, 28, 49
Now, we find the mode of the given data set.
As we know, the data set or values have more than one mode it is the mode. If more than one value occurs which is equal to frequency and number of time compares with other values in the data set.
So, Mode = {5, 15}
Therefore, the mode of the given data set is 5, 15.
Frequently Asked Questions on Mode
1. Define the difference between Mean, Mode, and Median?
The difference between the mean, mode, and median is, the mean of a data set is adding all numbers in the data set and then dividing by the total number of values in the set. The median is the middle value when a data set is ordered from least to greatest, and the mode is the number that occurs most often in a data set.
2. How do you find the mode or modal?
To find the modal, or mode, the best way is to put the numbers in order. After that count how many of each number. If the number appears most often that is the mode.
3. List the types of Modes?
Modes are of four types namely:
- Unimodal
- Bimodal
- Trimodal
- Multimodal
4. What happens when you have two mode sets?
If we have two numbers are appear most often, then the data or value has two modes. This is called Bimodal. If more than two modes then the data will be called multimodal.
5. What are the properties of mode in statistics?
In statistics, the mode is the value that repeatedly occurs in a given set of data. It can also say that the value or number in a data set, which has a high frequency or frequently occurs is called mode or modal value. Mode is one of the three measures of central tendency.
6. What are the merits of Mode?
The mode has many merits, some of them are listed below:
- Mode is easy to calculate and simple to understand.
- It is not affected by extremely larger values or smaller values.
- It can be computed in an open-end frequency table.