Pictographs are used for a visual representation of the data. Symbols or pictures are used to represent a pictograph. The information can be clearly understood with the help of pictographs. This article clearly explains how to make a pictograph to represent the collected data, Examples of Pictographs representing collected data, etc.
How to Make a Pictograph to Represent the Collected Data?
Pictographs are the best way to interpret data. It may be a bar graph, pie chart, etc., that represents the given data. Follow the below process to prepare a pictograph.
1. Pick a Source: After you pick a source of the data just note it down and start your pictograph preparation.
2. Make a List of All the Data: Analyze and organize your data into a clear table with every category given in the data.
3. Review your numbers: Analyze either you have collected the complete information to make a pictograph.
4. Assign a Key: Assign a key to the data with symbols or images and assign numerical values to it.
5. Draw a pictograph: After you have all the information, prepare a pictograph with the best visual representation.
How to Draw a Pictograph?
Creating a Pictograph using the table as follows:
1. The pictograph table consists of the title of the graph.
2. Every column of the table represents a title.
3. Names for every category must be a vote or pick by people.
4. Select a picture and place it to represent the number of votes or data collected.
5. The key will show how much each picture represents.
Check out our comprehensive collection of 4th Grade Math Topics that aid in your preparation and learn the concepts quite efficiently by looking no further.
Draw a Pictograph to Represent the Data Examples
Example 1.
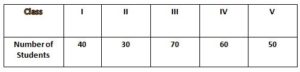
The given information represents about a school with the number of students class wise are as given below.
Solution:
Make a pictograph to represent the above data.
1. Given that five grades student details with the number of students present in every grade.
2. Take a table with two columns and two titles named as a class and the number of students with a symbol.
3. Pick a symbol or image to represent the number of students in a class.
4. Consider every symbol is equal to 10 students.
5. Now, place the number of symbols in the exact row according to the number of students.
6. Finally, draw a pictograph to represent the Collected Data.
| Class | Number of Students with Images |
|---|---|
| Class I | |
| Class II | |
| Class III | |
| Class IV | |
| Class V |
Here every doll is equal to 10 students. ![]() = 10 students.
= 10 students.
Class I = 40 students = 4 dolls.
Class II = 30 students = 3 dolls.
Class III = 70 students = 7 dolls.
Class IV = 60 students = 6 dolls.
Class V = 50 students = 5 dolls.
Example 2.
A bookseller sold 50 books on Monday, on Tuesday 60 books, on Wednesday 40 books, on Thursday 80 books, on Friday 70 books, and on Saturday 40 books. Draw a pictograph for the books sold during the week.
Solution:
Make a pictograph to represent the above data.
1. Given that a bookseller sold a number of books every day.
2. Take a table with two columns and two titles named as a Days and the number of books sold with a symbol.
3. Pick a symbol or image to represent the number of books on a day.
4. Consider every symbol is equal to 10 books.
5. Now, place the number of symbols in the exact row according to the number of books.
6. Finally, draw a pictograph to represent the Collected Data.
| Days | Books Sold |
|---|---|
| Monday | |
| Tuesday | |
| Wednesday | |
| Thursday | |
| Friday | |
| Saturday |
Here every book is equal to 10 books.![]() = 10 books.
= 10 books.
Monday = 50 books = 5 books.
Tuesday = 60 books = 6 books.
Wednesday = 40 books = 4 books.
Thursday = 80 books = 8 books.
Friday = 70 books = 7 books.
Saturday = 40 books = 4 books.
Example 3.
In the following table, there is given the number of women who use cosmetics in a city in different years. Represent the given data by pictograph?
| Year | 2004 | 2005 | 2006 | 2007 |
|---|---|---|---|---|
| Number of Women | 28 | 35 | 21 | 14 |
Solution:
Make a pictograph to represent the above data.
1. Given that there is given the number of women who use cosmetics in a city in different years.
2. Take a table with two columns and two titles named as a Year and the number of women with a symbol.
3. Pick a symbol or image to represent the number of women who use cosmetics in a city.
4. Consider every symbol is equal to 7 women.
5. Now, place the number of symbols in the exact row according to the number of women.
6. Finally, draw a pictograph to represent the Collected Data.
| Year | Number of Women |
|---|---|
| 2004 | |
| 2005 | |
| 2006 | |
| 2007 |
Here one women’s image is equal to 7 women.![]() = 7 women.
= 7 women.
2004 = 28 women = 4 women images.
2005 = 35 women = 5 women images.
2006 = 21 women = 3 women images.
2007 = 14 women = 4 women images.
Example 4.
A fruit seller sold the following number of different fruits as given below. Form a pictograph with the help of the given data?
| Fruits | Bananas | Apples | Pineapples | Guavas |
|---|---|---|---|---|
| Number of Fruits Sold | 42 | 16 | 24 | 40 |
Solution:
Make a pictograph to represent the above data.
1. Given that a fruit seller sold a different number of fruits.
2. Take a table with two columns and two titles named as a Fruits and the Number of Fruits Sold with a symbol.
3. Pick a symbol or image to represent the Number of Fruits Sold.
4. Consider every symbol is equal to 8 Number of Fruits Sold.
5. Now, place the number of symbols in the exact row according to the number of women.
6. Finally, draw a pictograph to represent the Collected Data.
| Fruits | Number of Fruits Sold |
|---|---|
| Bananas | |
| Apples | |
| Pineapples | |
| Guavas |
Here one fruit image is equal to 8 fruits. 1 fruit symbol = 8 fruits.
Bananas = 42 bananas = 6 bananas images.
Apples = 16 Apples = 2 Apples images.
Pineapples = 24 Pineapples = 3 Pineapple images.
Guavas = 40 Guavas = 4 Guava images.
FAQs on Pictograph
1. What is the scale of a pictograph?
There is no scale to draw a pictograph. It uses pictures or symbols to represent numbers.
2. What are the main benefits of pictographs?
The visual representation of pictographs helps to remember the information in an easy way. Also, it is really easy to represent the huge data into small information.
3. What is a pictograph?
Pictograph is the image representation of the data.
4. What is the key to a pictograph?
In a pictograph, the key represents the value of an image.