
Problems on frequency polygon are here. Check the practice material and solution of frequency polygons. Get the various steps to solve these problems in an easy manner. Follow the step-by-step procedure to solve frequency polygon problems. Know the various polygon concepts and examples. Check the below sections to know the polygon concepts, step-by-step procedure, example problems, etc.
Also, Read:
Polygon – Definition
Any closed 2-D shaped figure bounded by three or more sides is a polygon. If all the sides of the polygon are equal, then it is called the regular polygon. Before going to solve frequency polygon problems, check the formulae here.
Properties of Polygon
- Sum of all the interior angles of a regular polygon: (n-2)180°
- Each interior angle of a regular polygon: (n-2)180°/n
- Number of Diagonals: n(n-3)/2
- Sum of all exterior angles of a regular polygon: 360°
Problem 1:
The runs scored by two teams A and B on the first 60 balls in a cricket match are given below.
| S. No | Number of Balls | Team A | Team B |
|---|---|---|---|
| 1 | 1-6 | 2 | 5 |
| 2 | 7-12 | 1 | 6 |
| 3 | 13-18 | 8 | 2 |
| 4 | 19-24 | 9 | 10 |
| 5 | 25-30 | 4 | 5 |
| 6 | 31-36 | 5 | 6 |
| 7 | 37-42 | 6 | 3 |
| 8 | 43-48 | 10 | 4 |
| 9 | 49-54 | 6 | 8 |
| 10 | 55-60 | 2 | 10 |
Represent the data of both the teams on the same graphs by frequency polygons. [Hint: First make the class intervals continuous]
Solution:
As given in the question,
To make the class intervals continuous, subtract 0.5 from the lowest value and add 0.5 to the highest value
Therefore, the new intervals are
| S. No | Number of Balls | Team A | Team B |
|---|---|---|---|
| 1 | 0.5-6.5 | 2 | 5 |
| 2 | 6.5-12.5 | 1 | 6 |
| 3 | 12.5-18.5 | 8 | 2 |
| 4 | 19-24.5 | 9 | 10 |
| 5 | 24.5-30.5 | 4 | 5 |
| 6 | 30.5-36.5 | 5 | 6 |
| 7 | 36.5-42.5 | 6 | 3 |
| 8 | 42.5-48.5 | 10 | 4 |
| 9 | 48.5-54.5 | 6 | 8 |
| 10 | 54.5-60.5 | 2 | 10 |
To represent the data on the graph, we require the mean value of the interval i.e.,
1st interval mean value is 0.5 + 6.5 / 2 = 3.5
2nd interval mean value is 6.5+12.5 / 2 = 9.5
3rd interval mean value is 12.5+18.5 / 2 = 15.5
4th interval mean value is 19+24.5 / 2 = 21.75
5th interval mean value is 24.5+30.5 / 2 = 27.5
6th interval mean value is 30.5+36.5 / 2 = 33.5
7th interval mean value is 36.5+42.5 / 2 = 39.5
8th interval mean value is 42.5+48.5 / 2 = 45.5
9th interval mean value is 48.5+54.5 / 2 = 51.5
10th interval mean value is 54.5+60.5 / 2 = 57.5
The final graph is
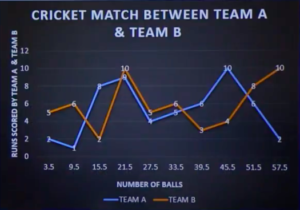
Hence, the frequency polygons graph data is represented here.
Problem 2:
Represent the data on the same graphs by frequency polygons.
| Class Interval (price of pen) | 10-20 | 20-30 | 30-40 | 40-50 | 50-60 |
|---|---|---|---|---|---|
| Frequency (Number of pens sold) | 15 | 20 | 30 | 25 | 5 |
Solution:
As given in the above table,
The frequency has gradually increased and then decreased. Hence the graph is as follows.
Hence, the frequency polygons graph data is represented here.
Problem 3:
Draw a histogram, a frequency polygon and frequency curve of the following data:
| Marks | 0-10 | 10-20 | 20-30 | 30-40 | 40-50 | 50-60 |
|---|---|---|---|---|---|---|
| Number of Students | 5 | 12 | 15 | 22 | 14 | 4 |
Solution:
By considering the above-given data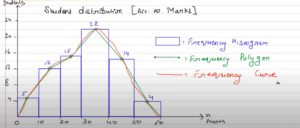
Hence, the histogram, frequency polygons graph, and curve are represented here.
Problem 4:
Each interior angle of a regular polygon is three times its exterior angle, then the number of sides of the regular polygon is?
Solution:
As given in the question,
Each interior angle of a regular polygon is three times its exterior angle
Suppose the exterior angle = 1
Then the interior angle = 3
The sum of interior and exterior angle = 4
Each side of a regular polygon = 180°
Therefore, the angle of one side = 180/4 = 45°
The complete angle of a polygon = 360°
No of sides of a polygon = 360º/N
= 360/45
= 8
Therefore, the regular polygon has 8 sides
Problem 5:
With the help of the frequency distribution for the calculus table, draw the frequency polygon graph?
| Lower Bound | Upper Bound | Frequency | Cumulative Frequency |
|---|---|---|---|
| 49.5 | 59.5 | 5 | 5 |
| 59.5 | 69.5 | 10 | 15 |
| 69.5 | 79.5 | 30 | 45 |
| 79.5 | 89.5 | 40 | 85 |
| 89.5 | 99.5 | 15 | 100 |
Solution:
As given in the question,
We consider the scores and test scores of frequency distribution for the calculus
The frequency polygon distribution graph is
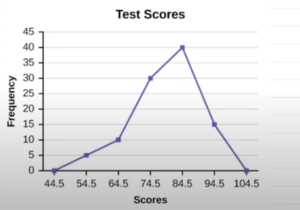
Hence, the frequency polygons graph data is represented here.
Problem 6:
With the help of the frequency distribution, draw the frequency polygon graph?
| Age (in years) | 0-5 | 5-10 | 10-20 | 20-40 | 40-50 | 50-80 |
|---|---|---|---|---|---|---|
| Number of Persons | 7 | 9 | 14 | 12 | 8 | 15 |
Solution:
As we know,
Adjusted frequency of a class = Minimum class size / Class size * Frequency
The frequency polygon distribution graph is as follows
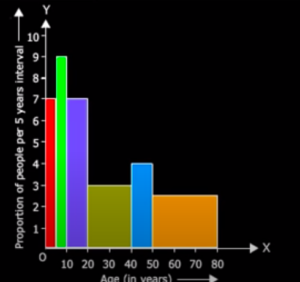
Hence, the frequency polygons graph data is represented here.
Problem 7:
With the help of the frequency distribution, draw the frequency polygon graph?
| CB | Frequency |
|---|---|
| 0.5 – 10.5 | 2 |
| 10.5 – 20.5 | 3 |
| 20.5 – 30.5 | 6 |
| 30.5 – 40.5 | 9 |
| 40.5 – 50.5 | 4 |
Solution:
As we know,
The frequency polygon distribution graph is as follows
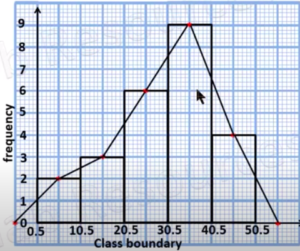
Hence, the frequency polygons graph data is represented here.
Problem 8:
With the help of the frequency distribution, draw the frequency polygon graph?
| Upper Bound | Lower Bound | Midpoint | Frequency |
|---|---|---|---|
| 10 | 19 | 14.5 | 4 |
| 20 | 29 | 24.5 | 5 |
| 30 | 39 | 34.5 | 7 |
| 40 | 49 | 44.5 | 5 |
| 50 | 59 | 54.5 | 5 |
| 60 | 69 | 64.5 | 4 |
Solution:
As we know,
The frequency polygon distribution graph is as follows
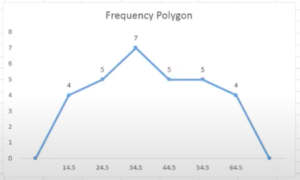
Hence, the frequency polygons graph data is represented here.
Problem 9:
The following is the distribution of workers of a factory. On the basis of this information, construct a histogram and convert it into a frequency polygon.
| Age (In Years) | 20-30 | 30-40 | 40-50 | 50-60 | 60-70 |
|---|---|---|---|---|---|
| No of workers | 15 | 25 | 7 | 5 | 2 |
Solution:
As we know,
The frequency polygon distribution graph is as follows
Hence, the frequency polygons graph data is represented here.
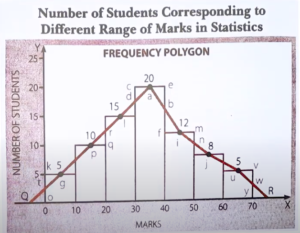
Problem 10:
The following is the distribution of workers of a factory. On the basis of this information, construct a histogram and convert it into a frequency polygon.
| Marks | Mid Value | Number of Students |
|---|---|---|
| 10-20 | 15 | 10 |
| 20-30 | 25 | 15 |
| 30-40 | 35 | 20 |
| 40-50 | 45 | 22 |
| 50-60 | 55 | 15 |
| 60-70 | 65 | 10 |
Solution:
As we know,
The frequency polygon distribution graph is as follows
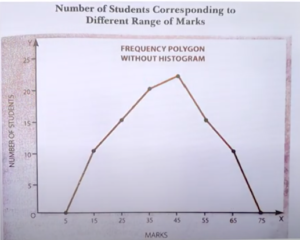
Hence, the frequency polygons graph data is represented here.