Problems on Plotting Points in the x-y Plane in Coordinate Geometry with answers are available here. Let us learn how to plot the points in the x-y Plane with examples from this page. So, have a look at this article to know plotting points in the x-y plane on the graph. The right part of the origin in the horizontal line is the positive x-axis and the left part of the origin in the horizontal line is the negative x-axis. Topside of the origin is the positive y-axis and the bottom part from the origin is the negative y-axis.
Also, Read:
Plotting Points in x-y Plane Problems with Solutions
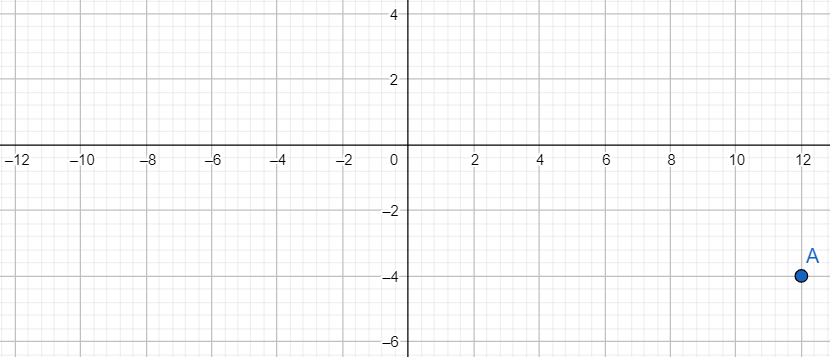
Example 1.
Plot the Points (12, -4) on the Coordinate Graph in the x-y plane.
Solution:
First Taking the scale 1 cm = 4 on the graph
Let the point P = (12, -4).
Here the x-coordinate = 12 and y-coordinate = -4.
So, move 12 units from origin to towards the positive direction of the x-axis.
From that place to move 4 units towards the negative direction of the y-axis.
Now the position of the point is reached as the coordinates (12, -4)
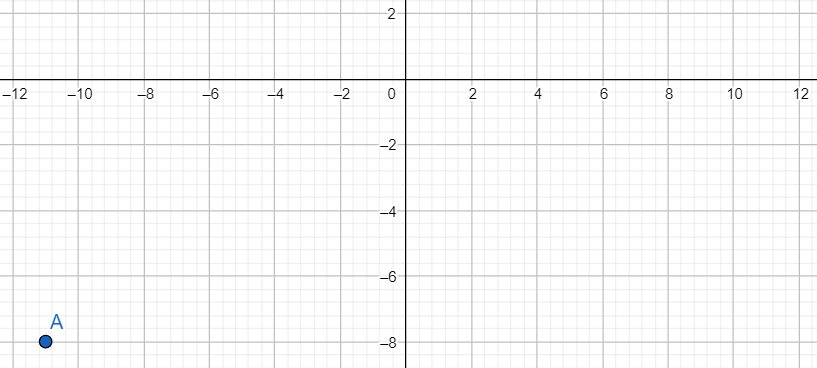
Example 2.
Plot the points (-11, -8) on the Coordinate Graph in the x-y plane.
Solution:
First taking the scale as your wish
Here I am taking 1 cm = 4 units on the graph.
Let the point Q = (-11, -8).
Here, the x-coordinate = -11 and the y-coordinate = -8.
So, move 11 units from the origin towards the negative direction of the x-axis.
From that place to move 8 units towards the negative direction of the y-axis.
Now the position of the point reached as the coordinates (-11, -8)
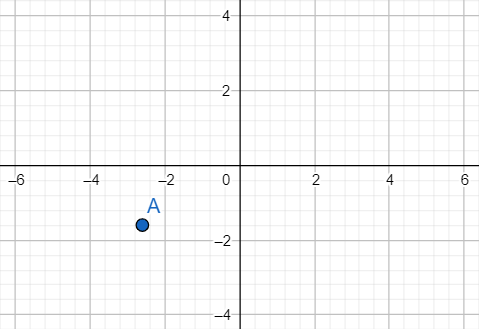
Example 3.
Plot the Points (-2.6, -1.6) on the Coordinate Graph in the x-y plane.
Solution:
First taking the scale as your wish
Here I am taking 1 cm = 5 units on the graph.
Let the point E = (-2.6, -1.6).
Here, the x-coordinate = -2.5 and the y-coordinate = -1.5.
So, move 2.6 units from the origin towards the negative direction of the x-axis.
From that place to move 1.6 units towards the negative direction of the y-axis.
Now the position of the point is reached as the coordinates (-2.6, -1.6).
Example 4.
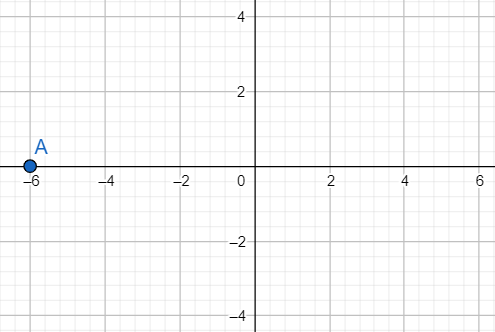
Plot the Points (-6, 0) on the Coordinate Graph in the x-y plane.
Solution:
First taking the scale as your wish
Here I am taking 1 cm = 5 units on the graph.
Let the point B = (-6, 0).
Here, the x-coordinate = -6 and the y-coordinate = 0.
So, the point is on the x-axis. Move 6 units from the origin towards the negative direction of the x-axis. Now the position of the point is reached as the coordinates (-6, 0).
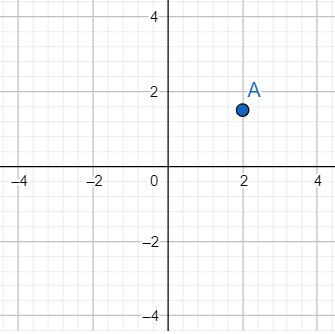
Example 5.
Plot the Points (2, 1.5) on the Coordinate Graph in the x-y plane.
Solution:
First taking the scale as your wish
Here I am taking 1 cm = 3 units on the graph.
Let the point C = (2, 1.5).
Here, the x-coordinate = 2 and the y-coordinate = 1.5.
So, move 2 units from the origin towards the positive direction of the x-axis.
From that place to move 1.5 units towards the positive direction of the y-axis.
Now the position of the point reached has the coordinates (2, 1.5).
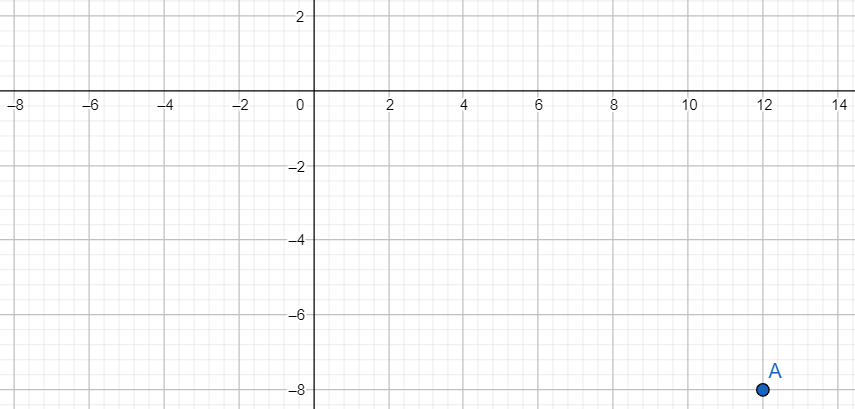
Example 6.
Plot the points (12, -8) and (-16, -20) in the x-y plane.
Solution:
Taking 1 cm = 4 as the scale of representation the points are plotted as shown below.
(i) Let P = (12, -8). Here the x-coordinate = 12 and y-coordinate = -8. So, move 12 units from O towards the positive direction of the x-axis. From that place move 8 units towards the negative direction of the y-axis. The position of the point now reached has the coordinates (12, -8).