In statistics, the representation of data can be done in two types: organized and unorganized data. Knowing the types and methods of data representation in statistics can help kids to solve the measures of central tendency effortlessly. The mean and median of ungrouped data and grouped data can be answered so easily. So, refer to this article and get useful information on statistical data representations. Also, check the difference between grouped data and ungrouped data along with some worked-out examples.
Few Related Articles:
Definition of Data
A collection of information compiled by observations, research measurements, or analysis is known as Data.
What is Representation of Data?
Data representation is the form where data is stored, processed, and transmitted. There are various types to represent the data in mathematical form like decimal number system, binary number system, octal, and hexadecimal number system. In statistics, the statistical data is represented in various methods such as Bar charts, histograms, pie charts, and boxplots.
Depending on the given expression data can be represented in raw (ie., ungrouped) or arrayed or grouped. Let’s dig deep and get some idea on these types of data representation in statistics with example problems.
1. Raw or Ungrouped Data
The data that are gained from direct observation is known as ungrouped data. Ungrouped data is also called raw data. In statistics, the discrete data or unorganized data is called ungrouped data that can be presented in tabular data representation named discrete frequency distribution table.
The major limitation of raw data is computation, analysis and interpretation become difficult. Hence, it is mandatory to organize raw data in a systematic order.
Example on Ungrouped Data: Let’s consider the marks gained by 10 students in science test are:
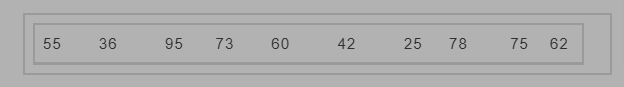
Now, it is in the raw data form. By these observations, can we find the least and highest marks?
Actually yes we can do it as takes less time. But, you can even take less time by arranging them in ascending or descending order. Hence, let’s see the marks arranged in ascending order:
Finally, we can easily find the least and highest marks scored in the science test. Therefore, the highest score is 95, and the least score is 25. The class range in this example would be the difference between the highest value and the lowest value
Do Check:
2. Arrayed Data
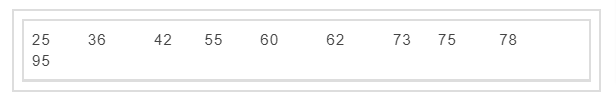
The data that is arranged in the form of ascending order or descending order is known as arrayed data. This form of data representation is very useful to find ungrouped data problems.
The arrayed form of raw data from the above example can be expressed like this:
3. Grouped Data
The data which has been separated in the form of different class intervals or categories is called grouped data. We can present this type of data by using Histograms and frequency tables. Compared to raw data, grouped data accuracy is high when finding the mean and median.
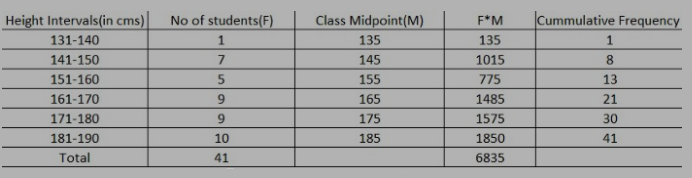
Example of Grouped Data: Let’s consider the following height of students which is in raw data: (171,161,155,155,183,191,185,170,172,177,183,190,139,149,150,150,152,158,159,174,178,179,190,170,143,165,167,187,169,182,163,149,174,174,177,181,170,182,170,145,143)
Now, the above-ungrouped data can be classified into groups and check out the outcome of the grouped data of heights of students from the following table:
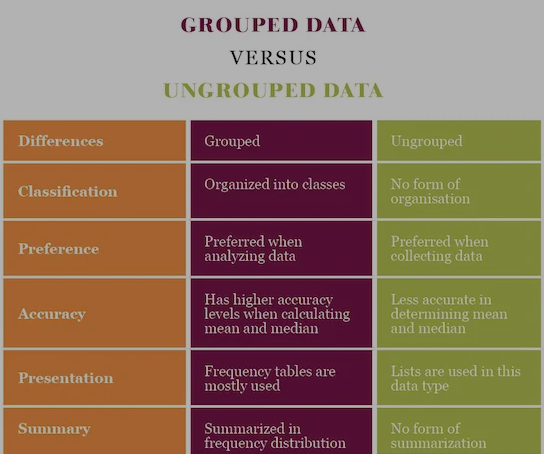
Grouped Vs Ungrouped Data
The following image shows the difference between the grouped and ungrouped data. Take a look at it for a better understanding.
Solved Exampled of Data Representation in Statistics
Example 1:
Find the mean of the following ungrouped distributions:
x: 20 40 60 80 100
f: 10 20 30 40 50
Solution:
| xi | fi | xifi |
| 20 | 10 | 20×10=200 |
| 40 | 20 | 40×20=800 |
| 60 | 30 | 60×30=1800 |
| 80 | 40 | 80×40=3200 |
| 100 | 50 | 100×50=5000 |
| Total | ∑fi=150 | ∑xifi=10,000 |
Now, the mean formula is
\(\overline{x}\) =∑xifi/∑fi
⇒ \(\overline{x}\) = 10,000/150
⇒ \(\overline{x}\) = 66.66(approx)
Hence, the required mean of this ungrouped data is 66.66 approximately.
Example 2:
Arrange the following raw data in the arrayed form of data:
80, 70, 0, 20, 20, 45, 50, 65, 30, 50, 70, 20, 4, 90, 49, 40, 45, 30, 30, 50, 20, 80, 39, 30, 50, 50, 70, 70, 20, 40, 90, 30, 40, 50, 65, 45, 70, 79, 20, 4, 30, 50, 20, 45, 50, 45, 90, 30, 4, 50.
Solution:
Given ungrouped data is 80, 70, 0, 20, 20, 45, 50, 65, 30, 50, 70, 20, 4, 90, 49, 40, 45, 30, 30, 50, 20, 80, 39, 30, 50, 50, 70, 70, 20, 40, 90, 30, 40, 50, 65, 45, 70, 79, 20, 4, 30, 50, 20, 45, 50, 45, 90, 30, 4, 50.
Now, arrange it in ascending order to form the arrayed data;
4, 4, 4, 20, 20, 20, 20, 20, 20, 20, 30, 30, 30, 30, 30, 30, 30, 39, 40, 40, 40, 45, 45, 45, 45, 45, 49, 50, 50, 50, 50, 50, 50, 50, 50, 50, 65, 65, 70, 70, 70, 70, 70, 79, 80, 80, 90, 90, 90, 90.
Example 3:
The following table shows the ungrouped data of students’ with their scores. Make this whole collection in the shorter form means in grouped data to understand easily.
| Marks Obtained | Number of Students |
| 4 20 30 39 40 45 49 50 65 70 79 80 90 |
4 8 8 2 4 6 2 10 3 6 2 3 5 |
| Total | 63 |
Solution:
The data presented in the above table can be organized in a shorter form by grouping the whole collection as shown below:
| Marks Obtained
From 0 to under 20 From 20 to under 40 From 40 to under 60 From 60 to under 80 From 80 to under 100 |
Number of Students
4 18 (i.e., 8 + 8 +2) 22 (i.e., 4 + 6 + 2 + 10) 11 (i.e., 3 + 6 +2) 8 (i.e., 3 + 5) |
The total number of students is 63.