Worksheet on Graph of Linear Relations in x, y with step-wise solutions is available on this page. So, the students of grade 9 can go through the problems provided here and try to solve them and test how much they have learned from the chapter coordinate geometry. This page is the one-stop for the students who are lagging in graphing linear equations using x, y.
We will learn how to draw the graphs of linear relations in x, y coordinates. Hence practice the problems given below and score better grades in the exams. These concepts will be helpful for you in further classes.
See More:
- Slope of the Graph of y = mx + c
- Worksheet on Plotting Points in the Coordinate Plane
- Worksheet on Slope and Y-intercept
Graphing Linear Relations in x, y Worksheet Answers
You can see different types of equations in the x-y plane in the graph of linear relations worksheet.
Example 1.
Draw the graph of the linear equation in two variables x – 3y + 1 = 0
Solution:
Given equation is x – 3y + 1 = 0
x + 1 = 3y
y = x + 1/3
In the given equation
If x = -1 then y = (-1) + 1/3 = -2/3
If x = 0 then y = (0) + 1/3= 1/3
If x = 1 then y = (1) + 1/3 = 4/3
If x = 2 then y = (2) + 1/3 = 7/3
Plot the graph using the points (-1,-2/3), (0,1/3), (1,4/3), (2,7/3).
Example 2.
Draw the graph of the linear equation in two variables x + y = 1
Solution:
x + y = 1
– y = x – 1
y = -x + 1
If x = 0 then y = 0 + 1 = 1
If x = 1 then y = -1 + 1 = 0
If x = 2 then y = -2 + 1 = -1
If x = 4 then y = – 4 + 4 = 0
Then plot the following points in the graph (0,1), (1,0), (2,-2) and (4,0)
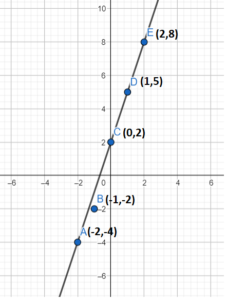
Example 3.
Draw the graph of the linear equation in two variables y = 3x + 2.
Solution:
Given equation is y = 3x + 2
In the given equation
If x = -2 then y = 3(-2) + 2 = -6+2 = -4
If x = -1 then y = 3(-1) + 2 = -2
If x = 0 then y = 3(0) + 2 = 2
If x = 1 then y = 3(1) + 2 = 5
If x = 2 then y = 3(2) + 2 = 8
Plot the graph using the points (-2,-4), (-1,-2), (0,2), (1,5) and (2,8).
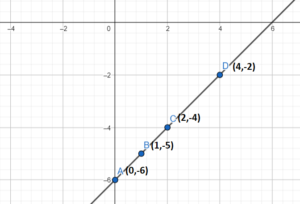
Example 4.
Draw the graph of the linear equation in two variables x − y = 6
Solution:
x – y = 6
– y = 6 – x
y = x – 6
If x = 0 then y = 0 – 6 = -6
If x = 1 then y = 1 – 6 = -5
If x = 2 then y = 2 – 6 = -4
If x = 4 then y = 4 – 6 = -2
Then plot the graph using the points (0,-6), (1,-5), (2,-4), (4,-2).
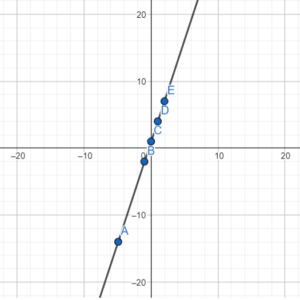
Example 5.
Draw the graph of the linear equation in two variables y = 3x + 1.
Solution:
Given equation is y = 3x + 1
In the given equation
If x = -5 then y = 3(-5) + 1 = -15+ 1 = -14
If x = -1 then y = 3(-1) + 1 = -2
If x = 0 then y = 3(0) + 1 = 1
If x = 1 then y = 3(1) + 1 = 4
If x = 2 then y = 3(2) + 1 = 7
Plot the graph using the points (-5,-14), (-1,-2), (0,1), (1,4) and (2,7).
Example 6.
Draw the graph of the linear equation in two variables 4x + 3y + 1 = 0
Solution:
Given equation is 4x + 3y + 1 = 0
-3y = 4x + 1
y = -4x/3 -1/3
In the given equation
If x = -1 then y = -4(-1)/3 – 1/3 = 1
If x = 0 then y = (0)/3 – 1/3= -1/3
If x = 1 then y = -4(1)/3 – 1/3 = -5/3
If x = 2 then y = -4(2)/3 – 1/3 = -9/3
Plot the graph using the points (-1,1), (0,-1/3), (1,-5/3), (2,-9/3).
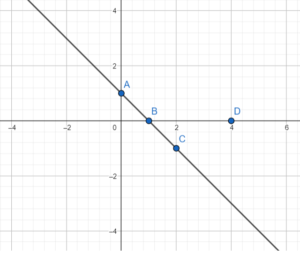
Example 7.
Draw the graph of the linear equation in two variables 2x + y = 4
Solution:
2x + y = 4
– y = 2x – 4
y = -2x + 4
If x = 0 then y = -2(0) + 4 = 4
If x = 1 then y = -2(1) + 4 = 2
If x = 2 then y = -2(2) + 4 = 0
If x = 4 then y = -2(4) + 4 = -4
Then plot the following points in the graph (0,4), (1,2), (2,0) and (4,-4)

Example 8.
Draw the graph of the linear equation in two variables 2x − y = 6
Solution:
2x – y = 6
– y = 6 – 2x
y = 2x – 6
If x = 0 then y = 2(0) – 6 = -6
If x = 1 then y = 2(1) – 6 = -4
If x = 2 then y = 2(2) – 6 = -2
If x = 4 then y = 2(4) – 6 = 2
Then plot the graph using the points (0,-6), (1,-4), (2,-2), (4,2).
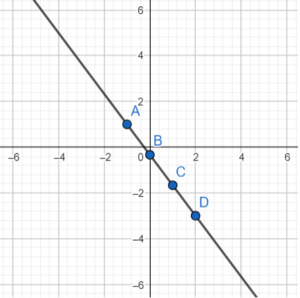
Example 9.
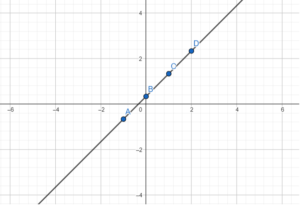
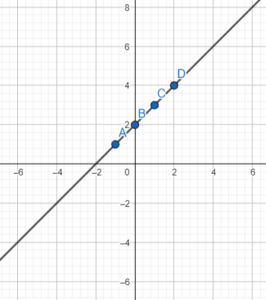
Draw the graph of the linear equation in two variables x – y + 2 = 0
Solution:
Given equation is x – y + 2 = 0
x + 2 = y
In the given equation
If x = -1 then y = (-1) + 2 = 1
If x = 0 then y = (0) + 2 = 2
If x = 1 then y = (1) + 2 = 3
If x = 2 then y = (2) + 2 = 4
Plot the graph using the points (-1,1), (0,2), (1,3), (2,4).
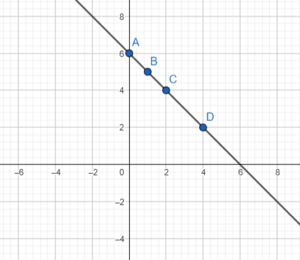
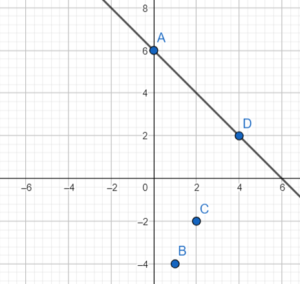
Example 10.
Draw the graph of the linear equation in two variables x + y = 6
Solution:
x + y = 6
– y = x – 6
y = -x + 6
If x = 0 then y = 0 + 6 = 6
If x = 1 then y = -1 + 6 = 5
If x = 2 then y = -2 + 6 = 4
If x = 4 then y = – 4 + 6 = 2
Then plot the following points in the graph (0,6), (1,5), (2,4) and (4,2)