Go through the Spectrum Math Grade 2 Answer Key Chapter 6 Lesson 6.19 Creating a Bar Graph and get the proper assistance needed during your homework.
Spectrum Math Grade 2 Chapter 6 Lesson 6.19 Creating a Bar Graph Answers Key
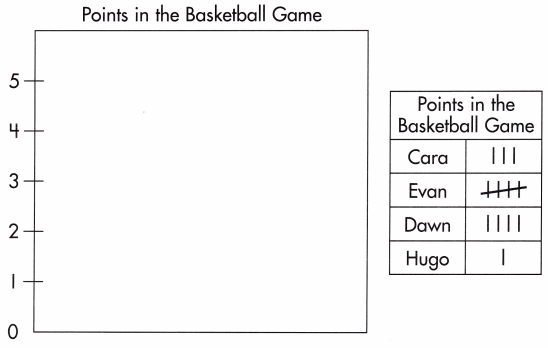
Use the information in the tally chart to complete the bar graph.
Answer:
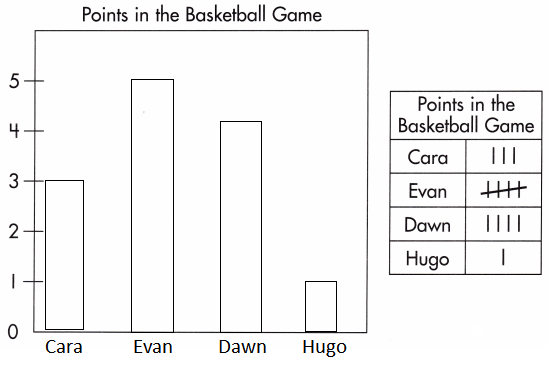
The vertical bar line represents the points in the basketball game and the horizontal bar represents the students.
Cara scored 3 points so mark the bar till the point 3.
Evan scored 5 points so mark the bar till the point 5.
Dawn scored 4 points so mark the bar till the point 4.
Hugo scored 1 point so mark the bar till the point 1.
Use the bar graph to answer the questions.
Which student scored the most points? _____
Answer:
Evan scored the most points than the others.
Which student scored the least points? _____
Answer:
Hugo scored 1 point which is the least when compared to the others.
How many points were scored altogether in the basketball game? ____
Answer:
Cara scored 3 points.
Evan scored 5 points.
Dawn scored 4 points.
Hugo scored 1 point.
The total points scored will be 3+5+4+1=13 points
13 points were scored altogether in the basketball game.
How many more points did Evan score than Hugo? ____
Answer:
Evan scored 5 points.
Hugo scored 1 point.
5-1=4 points were scored more than Hugo.