
In simple words, the bar graph is a graphical representation of data using rectangular bars, where the length of bars is equivalent to the measure of data. Bar charts are used to compare the frequencies or measures of distinct categories of data. The simple steps to draw the bar graph on graph paper along with the solved example questions are provided below for the reference of Grade 5 Math students.
How to Construct Bar Graph on Graph Paper?
You can draw 4 different types of the bar graphs such as horizontal bar graphs, vertical bar graphs, grouped bar charts and stacked bar graphs by following the below-mentioned steps. It will explain each and every step included to draw a bar chart on graph paper.
- At first, draw two lines OX and OY perpendicular lines on graph paper. OX is the horizontal axis, OY is the vertical axis.
- Decide the scale based on the information provided in the question.
- On the x-axis and y-axis, mark the points at equal distance.
- Take names of the horizontal axis, values on the vertical axis.
- Label the names, data values or any other on both axes starting from O.
- Draw the rectangular bars having an equal width and length is equal to the data value in the table.
- Give the graph a title.
The following example problems will implement all these steps and gives a clear idea of how to draw a bar graph on graph paper?
Questions & Solutions on Plotting Bar Graph on Paper
Question 1:
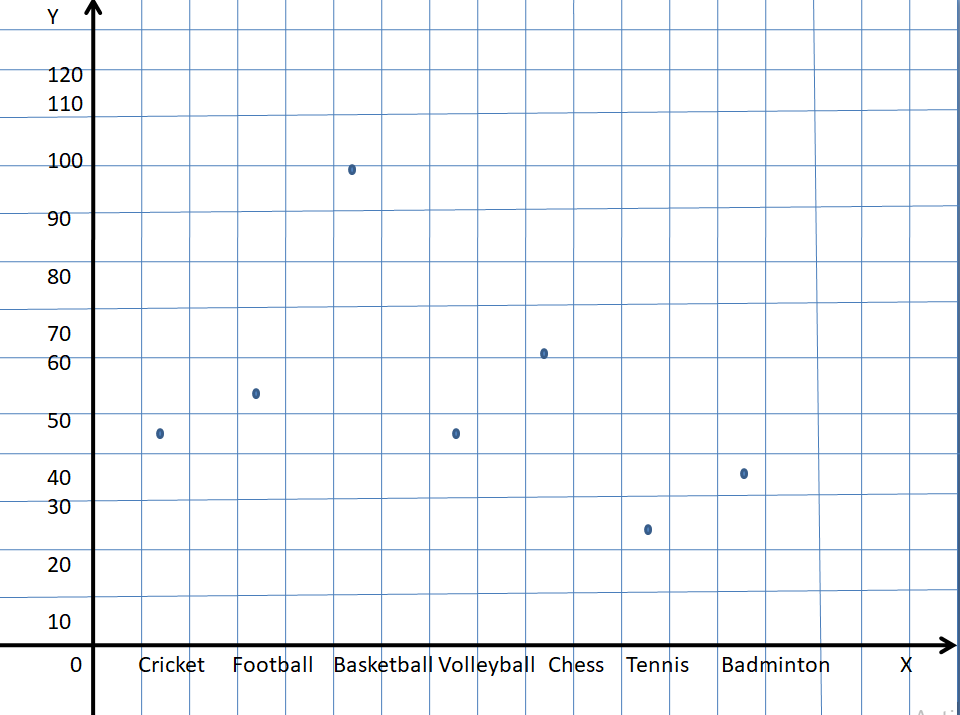
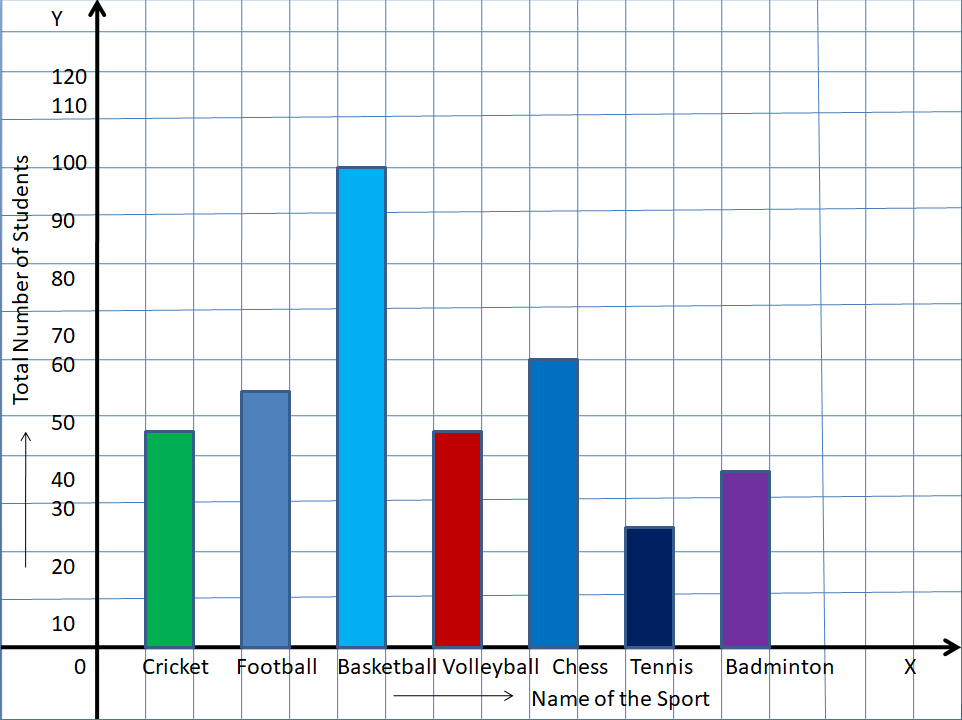
A school conducted a survey to know the favourite sports of the students. The table below shows the results of this survey. Draw a bar graph to represent the following data.
| Name of the Sport | Total Number of Students |
|---|---|
| Cricket | 45 |
| Football | 53 |
| Basketball | 99 |
| Volleyball | 44 |
| Chess | 60 |
| Table Tennis | 24 |
| Badminton | 35 |
Solution:
We follow the above-given steps to draw the bar graph for the data.
Step 1: Get the range in values
The least, highest values are 24 and 99.
Step 2: Determine the scale
So, take 1 box = 10 units on the y-axis and 2 boxes = 1unit on the x-axis.
Step 3: Label the graph
Take the total number of students on a vertical axis, sport name on the horizontal axis.
Step 4: Draw the bars
Mark the values on the graph and draw the bars of equal width.
Step 5: Give a title to the graph.
The graph is about the favourite sport of the students.
Question 2:
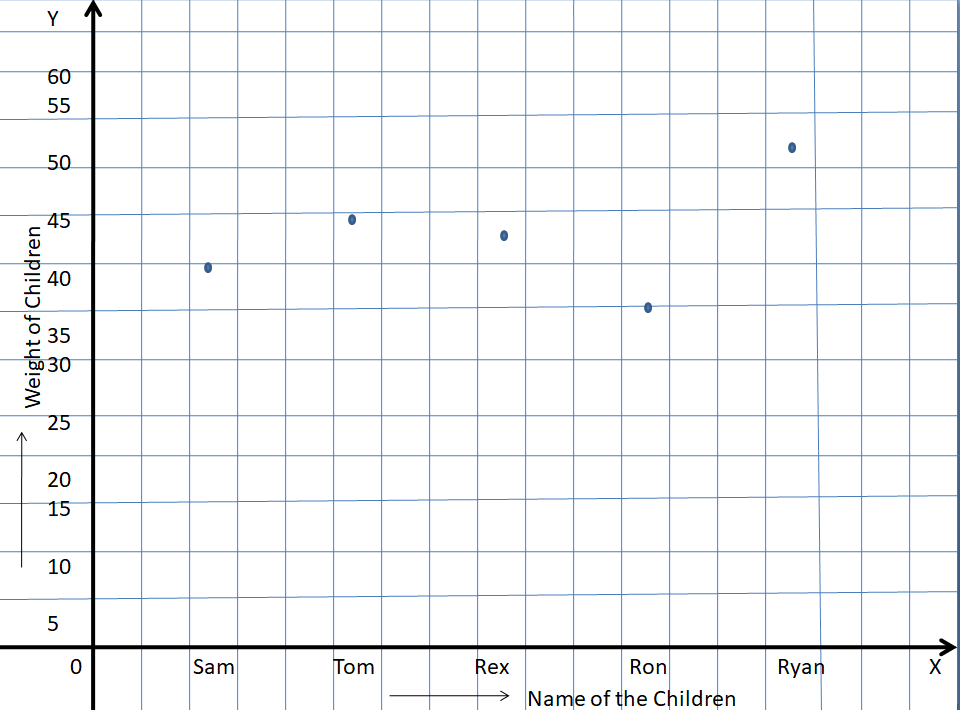
The weight of ‘5’ children’s of a class is given here. Draw a bar graph for the data.
| Name of the Children | Sam | Tom | Rex | Ron | Ryan |
|---|---|---|---|---|---|
| Weight | 40 | 45 | 43 | 35 | 52 |
Solution:
Step 1: Find the range in values
The minimum, maximum weights are 35 and 52
Step 2: Determine the scale
So, take 1 box = 5 units on the y-axis and 3 boxes = 1unit on the x-axis.
Step 3: Label the graph
Take the weight of children on a vertical axis, name of the children on the horizontal axis.
Step 4: Draw the bars
Mark the values on the graph and draw the bars of equal width.

Step 5: Give a title to the graph.
The graph tells about the weight of the children in a class.
FAQ’s on Bar Chart on Graph Paper
1. Where is the title of the bar graph written on the graph paper?
The title of the bar graph is written at the top centre of the bar graph.
2. How to make the bar graph on graph paper?
Draw the horizontal and vertical axes on the graph paper and determine the scale. Write the units on the graph and label the axes. Mark the points and draw the rectangular bars. By depending on the information at the question, give the title to the bar chart.
3. What is the importance of a bar graph?
Generally, graphs are used to visually illustrate the relationships in the data. The purpose of a bar graph is it compare things between different groups or tracks the changes over time.
4. What is the disadvantage of using a bar graph?
Bar graphs don’t work well when you want to display changes in speed. These can be easily manipulated to give the false impression of a data set.