
A double bar graph is a graph that displays two sets of data. A double bar graph is a graph that displays two sets of data. It is helpful to compare data among items based on two categories. A double bar graph displays the information using two bars beside each other at different heights. Here, the bars can be arranged either horizontally or vertically. Learn the step by step process to construct a double bar graph, its uses and examples from this page. We have given useful information for the convenience of grade 5 students.
Double Bar Graph Definition
A double bar graph is used to represent the grouped data. It has two bars for each category to represent the parameters for each category. The height of the bars is proportional to the value provided in the given data set information. Double bar graphs are also known as bar charts.
A double bar graph has two axes. The x-axis shows the categories being compared and the y-axis is the scale. Scale is used to organise the data into equal parts. The parameters of a double graph are scale, keys, bars and title.
Uses of Double Bar Graphs
A double graph is used to represent and compare categories based on quantitative data. A simple bar graph compares categories based on a single parameter. For example, you can compare the weights of 3 students using a bar graph. But using the double bar graph, you can compare the heights, weights of those students easily. Here, students are the category on which comparison is made and weight, height are the two parameters on which the comparison is made.
How to Draw Double Bar Graph?
The simple steps to construct a double bar graph is listed here:
- By checking the data given, decide the title of the graph.
- Determine either you want horizontal bars or vertical bars.
- Draw OX, OY two perpendicular lines on the graph paper.
- Choose the scale.
- Label the two axes with their names.
- Plot the points and draw the bars.
Solved Examples on Double Bar Graphs
Example 1:
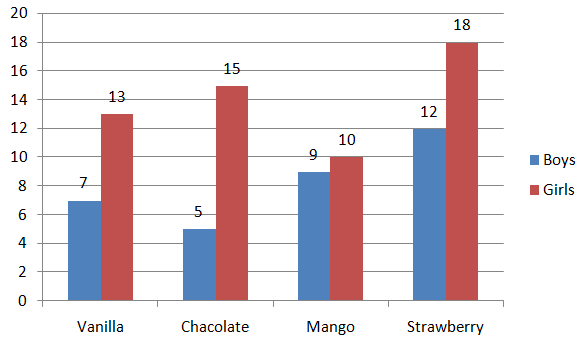
Draw a double bar graph to compare the favourite ice cream flavours of girls and boys in grade III.
| Ice Cream Flavour | Vanilla | Chocolate | Mango | Strawberry |
|---|---|---|---|---|
| Boys | 7 | 5 | 9 | 12 |
| Girls | 13 | 15 | 10 | 18 |
Solution:
Decide the title.
The title of the double bar graph is Favorite Ice Cream Flavours of Boys & Girls in a Class
The graph has vertical bars.
Take ice cream flavour on the x-axis, number of boys and girls on the y-axis.
Mark the points and draw the bars.
Example 2:
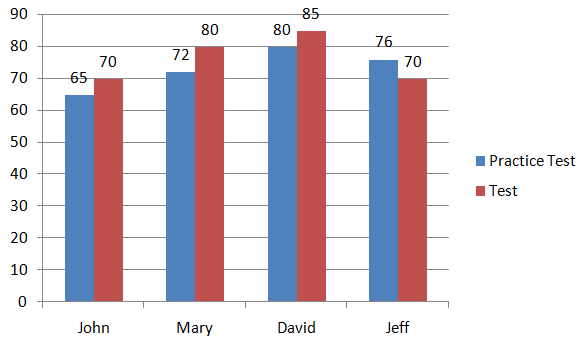
The scores of the practice test and test of various students are given here. Make a double bar graph for the table.
| Students | John | Mary | David | Jeff |
|---|---|---|---|---|
| Practice Test | 65 | 72 | 80 | 76 |
| Test | 70 | 80 | 85 | 70 |
Solution:
Give the title to the double bar graph
The title is Scores of the Practice Test & Test of Students
The graph has vertical bars
Place students names on the x-axis, practice tests, test marks on the y-axis.
Plot the points and draw the bars and give different colours to show variation
Frequently Asked Question’s on Double Bar Graph
1. What is a double bar graph and its purpose?
A double bar graph is the graphical representation of grouped data, where two parameters are considered as a single category. It has two bars for each category. The purpose is to compare the items.
2. When do you use a double bar graph?
When you want to display two sets of data on the same graph, then you will use a double bar graph. It is used to compare a large amount of quantitative data.
3. How to make a double bar graph?
The simple steps of constructing a double bar graph are to determine the scale, label the graph, draw the bars, give the title to the double bar graph and find the range.
4. Can a double bar graph contain parameters of different quantities?
A double bar graph has two parameters that are measured in the quantity. For example, the profit and sales are measured in rupees, so they are applicable.