If you are looking for Chapter 7 Go Math Grade 5 Answer Key then you have reached the right destination. We have mentioned Go Math Grade 5 Answer Key Chapter 7 Multiply Fractions with straight forward explanation for all the Problems. Parents who wanted to give their kids enough practice on concepts of Multiplying Fractions can give them the Go Math 5th Grade Answer Key Chapter 7 Multiply Fractions. Enhance your Math Skills by practicing from the HMH Go Math Grade 5 Answer Key Ch 7 Multiply Fractions.
Go Math Grade 5 Answer Key Chapter 7 Multiply Fractions
Do you feel the concept of Multiplying Fractions difficult? Not anymore with our Go Math Answer Key Grade 5 Chapter 7 Multiply Fractions as they have concepts explained in detail. Start learning the basics involved right from the basic level with our 5th Grade Go Math Answer Key Ch 7 Multiply Fractions. Test your preparation level by answering the questions at the end of the Go Math Grade 5 Answer Key for Multiply Fractions. By doing so, you can have an estimation of your preparation standards.
Chapter 7 – Lesson 1: Find Part of a Group
Chapter 7 – Lesson 2: Investigate • Multiply Fractions and Whole Numbers
Chapter 7 – Lesson 3: Fraction and Whole Number Multiplication
Chapter 7 – Lesson 4: Investigate • Multiply Fractions
Chapter 7 – Lesson 5: Compare Fraction Factors and Products
Chapter 7 – Lesson 6: Fraction Multiplication
Chapter 7 – Mid-Chapter Checkpoint
Chapter 7 – Lesson 7: Investigate • Area and Mixed Numbers
Chapter 7 – Lesson 8: Compare Mixed Number Factors and Products
Chapter 7 – Lesson 9: Multiply Mixed Numbers
Chapter 7 – Lesson 10: Problem Solving • Find Unknown Lengths
Chapter 7 – Chapter 7 Review/Test
- Chapter Review/Test – Page No. 333
- Chapter Review/Test – Page No. 334
- Chapter Review/Test – Page No. 335
- Chapter Review/Test – Page No. 336
Share and Show – Page No. 293
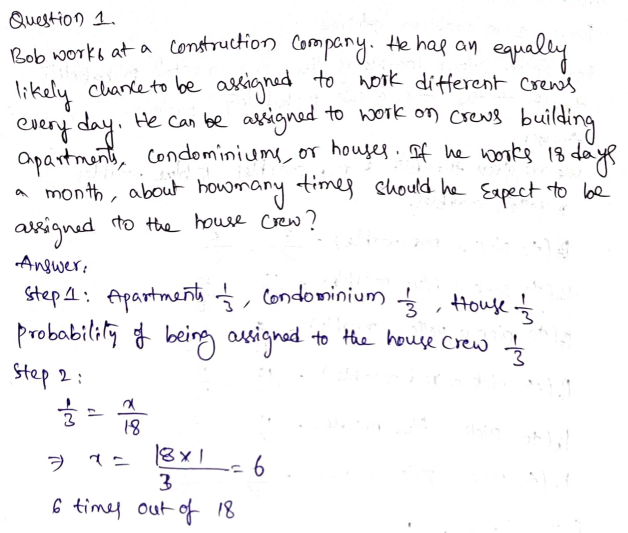
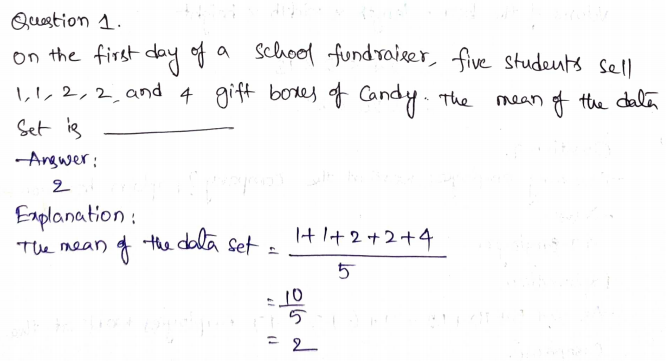
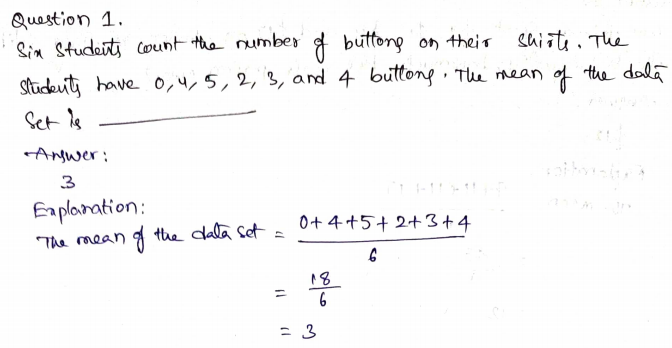
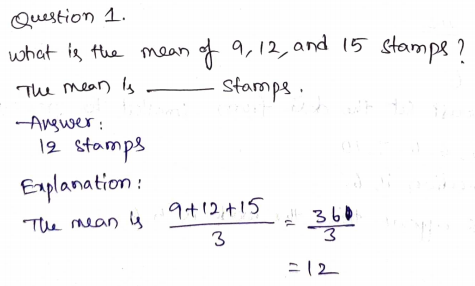
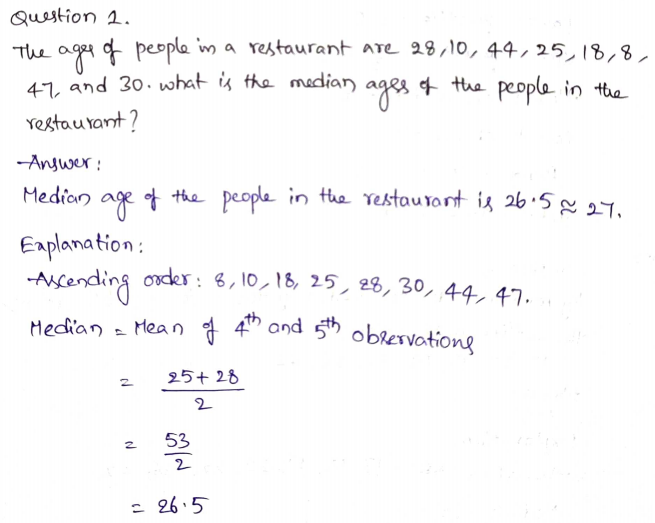
Question 1.
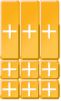
Complete the model to solve.
![]()
\(\frac{7}{8}\) of 16, or \(\frac{7}{8}\) × 16
How many rows of counters are there?
_____ rows
Answer: 8
By seeing the above figure we can say that the number of counters is 8 rows.
Question 1.
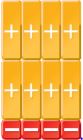
How many counters are in each row?
_____ counters
Answer: 2
There are 2 counters in each row.
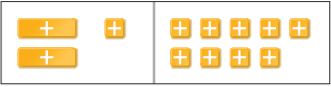
Question 1.
Circle ____ rows to solve the problem.
_____ rows
Answer: 7
• • • • • • •
• • • • • • •
• • • • • • •
• • • • • • •
• • • • • • •
• • • • • • •
• • • • • • •
• • • • • • •
Question 1.
How many counters are circled?
\(\frac{7}{8}\) of 16=
or \(\frac{7}{8}\) × 16 =
_____ counters
Answer: 14
\(\frac{7}{8}\) × 16
8 divides 16 two times.
So, \(\frac{7}{8}\) × 16 = 7 × 2 = 14
Therefore 14 counters are circled.
Use a model to solve.
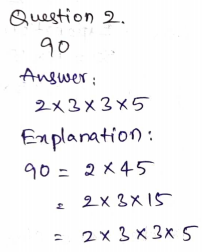
Question 2.
\(\frac{2}{3}\) × 18 = _____
Answer: 12
Explanation:
\(\frac{2}{3}\) × 18
3 divides 18 six times.
2 × 6 = 12
On Your Own
Use a model to solve.
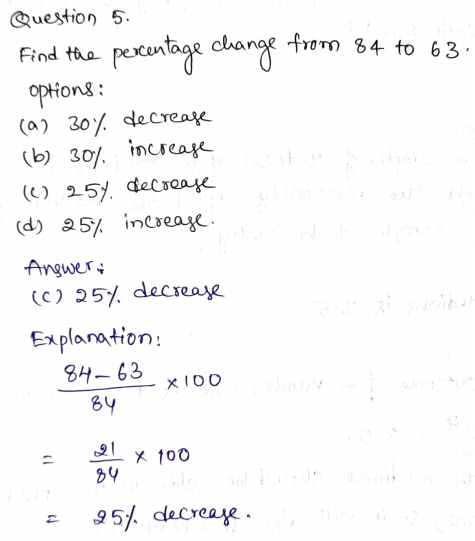
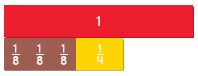
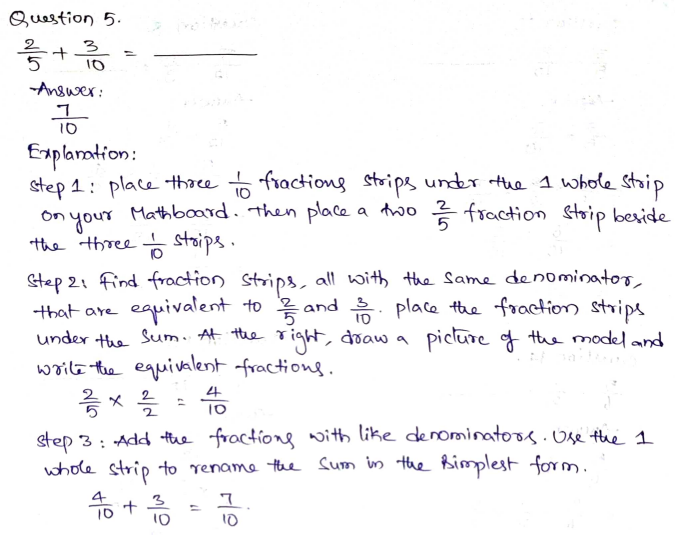
Question 5.
\(\frac{5}{8}\) × 24 = _____
Answer: 15
Explanation:
\(\frac{5}{8}\) × 24
8 divides 24 three times.
5 × 3 = 15
\(\frac{5}{8}\) × 24 = 15
Question 6.
\(\frac{3}{4}\) × 24 = _____
Answer: 18
Explanation:
\(\frac{3}{4}\) × 24
4 divides 24 six times.
\(\frac{3}{4}\) × 24 = 3 × 6 = 18
So, \(\frac{3}{4}\) × 24 = 18
Question 7.
\(\frac{4}{7}\) × 21 = _____
Answer: 12
Explanation:
\(\frac{4}{7}\) × 21
7 divides 21 three times.
4 × 3 = 12
\(\frac{4}{7}\) × 21 = 12
Question 8.
\(\frac{2}{9}\) × 27 = _____
Answer: 6
Explanation:
\(\frac{2}{9}\) × 27
9 divides 27 three times.
2 × 3 = 6
\(\frac{2}{9}\) × 27 = 6
Problem Solving – Page No. 294
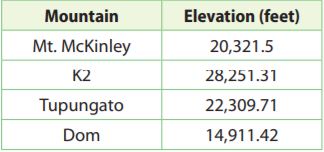
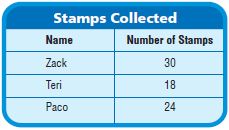
Use the table for 11-12.
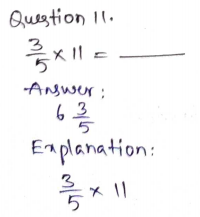
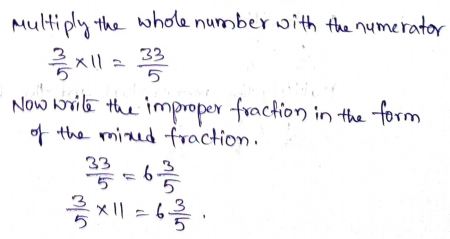
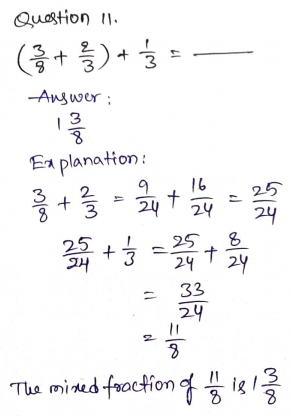
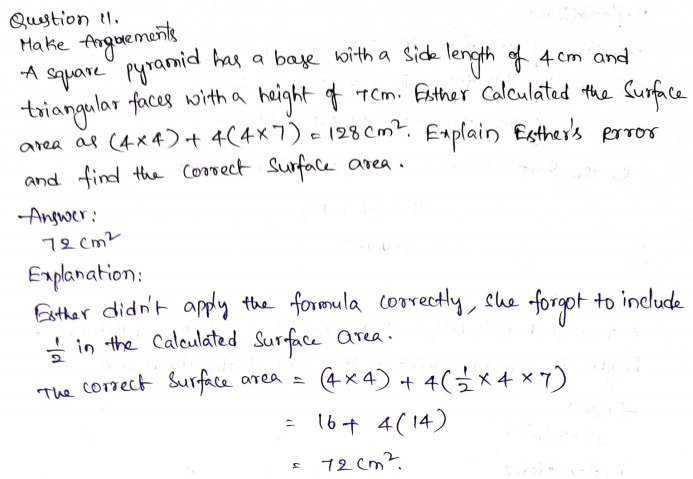
Question 11.
Four-fifths of Zack’s stamps have pictures of animals. How many stamps with pictures of animals does Zack have? Use a model to solve.
_____ stamps
Answer: 24 stamps
Explanation:
Given that, Four-fifths of Zack’s stamps have pictures of animals.
Number of stamps that Zack collected is 30
30 × \(\frac{4}{5}\)
5 divides 30 six times.
6 × 4 = 24
Zack has 24 stamps with pictures of animals.
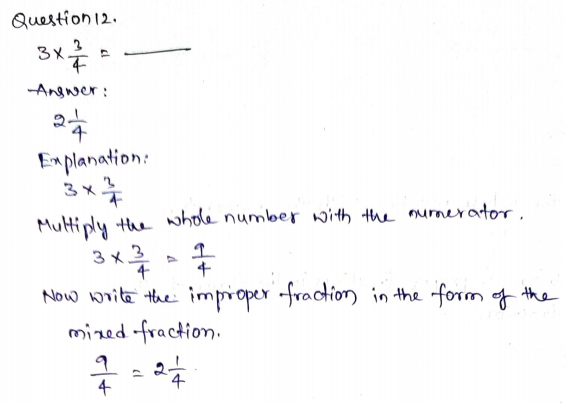
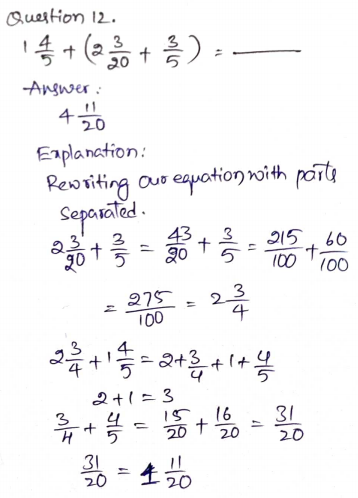
Question 12.
Zack, Teri, and Paco combined the foreign stamps from their collections for a stamp show. Out of their collections, \(\frac{3}{10}\) of Zack’s stamps, \(\frac{5}{6}\) of Teri’s stamps, and \(\frac{3}{8}\) of Paco’s stamps were from foreign countries. How many stamps were in their display? Explain how you solved the problem.
_____ stamps
Answer: 33 stamps
Explanation:
Zack, Teri, and Paco combined the foreign stamps from their collections for a stamp show.
Out of their collections, \(\frac{3}{10}\) of Zack’s stamps, \(\frac{5}{6}\) of Teri’s stamps, and \(\frac{3}{8}\) of Paco’s stamps were from foreign countries.
Number of stamps Zack collected = 30
Number of stamps Teri collected = 18
Number of stamps Paco collected = 24
\(\frac{3}{10}\) of 30
\(\frac{3}{10}\) × 30 = 3 × 3 = 9
\(\frac{5}{6}\) × 18 = 5 × 3 = 15
\(\frac{3}{8}\) × 24 = 3 × 3 = 9
Now add all the stamps = 9 + 9 + 15 = 33
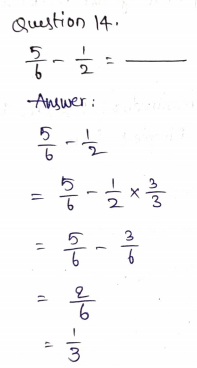
Question 14.
Test Prep Barry bought 21 stamps from a hobby shop. He gave \(\frac{3}{7}\) of them to his sister. How many stamps did he have left?

Options:
a. 3 stamps
b. 6 stamps
c. 9 stamps
d. 12 stamps
Answer: 9 stamps
Explanation:
Test Prep Barry bought 21 stamps from a hobby shop. He gave \(\frac{3}{7}\) of them to his sister.
\(\frac{3}{7}\) × 21
7 divides 21 three times.
3 × 3 = 9 stamps.
Thus the correct answer is option C.
Share and Show – Page No. 297
Use the model to find the product.
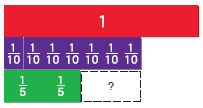
Question 1.
\(\frac{5}{6}\) × 3
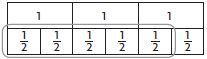
______ \(\frac{□}{□}\)
Answer: 2 \(\frac{1}{2}\)
Explanation:
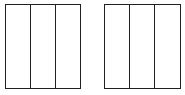
Place three whole fractions strips side by side.
Find six fraction strips all with the same denominator that fits exactly under the three whole numbers.
Circle \(\frac{5}{6}\) of 3 on the model you drew.
Complete the number sentence. \(\frac{5}{6}\) of 3
\(\frac{5}{6}\) × 3 = \(\frac{5}{2}\)
2 \(\frac{1}{2}\)
Question 2.
2 × \(\frac{5}{6}\)

______ \(\frac{□}{□}\)
Answer: 1 \(\frac{2}{3}\)
Explanation:
Place two whole fractions strips side by side.
Find six fraction strips all with the same denominator that fits exactly under the two whole numbers.
2 of \(\frac{5}{6}\) = \(\frac{5}{6}\) × 2
\(\frac{5}{3}\)
The mixed fraction of \(\frac{5}{3}\) is 1 \(\frac{2}{3}\)
Find the product.
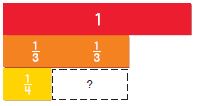
Question 4.
9 × \(\frac{1}{3}\) = ______
Answer: 3
Explanation:
9 × \(\frac{1}{3}\)
Place nine whole fractions strips side by side.
Find three fraction strips all with the same denominator that fits exactly under the two whole numbers.
9 × \(\frac{1}{3}\)
3 divides 9 three times.
9 × \(\frac{1}{3}\) = 3
Thus 9 × \(\frac{1}{3}\) = 3
Question 5.
\(\frac{7}{8}\) × 4 = ______ \(\frac{□}{□}\)
Answer: 3 \(\frac{1}{2}\)
Explanation:
\(\frac{7}{8}\) × 4
Place four whole fractions strips side by side.
\(\frac{7}{8}\) × 4
4 divides 8 two times.
\(\frac{7}{8}\) × 4 = \(\frac{7}{2}\)
The mixed fraction of \(\frac{7}{2}\) is 3 \(\frac{1}{2}\)
\(\frac{7}{8}\) × 4 = 3 \(\frac{1}{2}\)
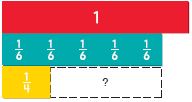
Question 6.
4 × \(\frac{3}{5}\) = ______ \(\frac{□}{□}\)
Answer: 2 \(\frac{2}{5}\)
Explanation:
4 × \(\frac{3}{5}\)
Place four whole fractions strips side by side.
Place three \(\frac{1}{5}\) fraction strips all with the same denominator that fits exactly under the two whole numbers.
4 of \(\frac{3}{5}\)
4 × \(\frac{3}{5}\) = \(\frac{12}{5}\)
The mixed fraction of \(\frac{12}{5}\) is 2 \(\frac{2}{5}\)
Question 7.
\(\frac{7}{8}\) × 2 = ______ \(\frac{□}{□}\)
Answer: 1 \(\frac{3}{4}\)
Explanation:
\(\frac{7}{8}\) × 2
Place two whole fractions strips side by side.
Place seven \(\frac{1}{8}\) fraction strips all with the same denominator that fits exactly under the two whole numbers.
\(\frac{7}{8}\) of 2
\(\frac{7}{8}\) × 2 = \(\frac{7}{4}\)
The mixed fraction of \(\frac{7}{4}\) is 1 \(\frac{3}{4}\)
Question 8.
7 × \(\frac{2}{5}\) = ______ \(\frac{□}{□}\)
Answer: 2 \(\frac{4}{5}\)
Explanation:
7 × \(\frac{2}{5}\)
Place seven whole fractions strips side by side.
Place two \(\frac{1}{5}\) fraction strips all with the same denominator that fits exactly under the two whole numbers.
7 × \(\frac{2}{5}\) = \(\frac{14}{5}\)
The mixed fraction of \(\frac{14}{5}\) = 2 \(\frac{4}{5}\)
Question 9.
\(\frac{3}{8}\) × 4 = ______
Answer: \(\frac{3}{2}\)
Explanation:
\(\frac{3}{8}\) × 4
Place four whole fractions strips side by side.
Place three \(\frac{1}{8}\) fraction strips all with the same denominator that fits exactly under the two whole numbers.
Question 11.
\(\frac{4}{15}\) × 5 = ______ \(\frac{□}{□}\)
Answer: 5 \(\frac{1}{3}\)
Explanation:
\(\frac{4}{15}\) × 5
Place five whole fractions strips side by side.
Place four \(\frac{1}{15}\) fraction strips all with the same denominator that fits exactly under the two whole numbers.
\(\frac{4}{15}\) of 5
\(\frac{4}{15}\) × 5 = \(\frac{4}{3}\)
Convert the improper fraction to the mixed fraction.
\(\frac{4}{3}\) = 5 \(\frac{1}{3}\)
Question 12.
Matt has a 5-pound bag of apples. To make a pie, he needs to use \(\frac{3}{5}\) of the bag. How many pounds of apples will he use for the pie? Explain what a model for this problem might look like.
______ pound(s)
Answer: 3 pounds
Explanation:
Given, Matt has a 5-pound bag of apples.
To make a pie, he needs to use \(\frac{3}{5}\) of the bag.
\(\frac{3}{5}\) × 5 = 3
Therefore Matt used 3 pounds of apples to make a pie.
Problem Solving – Page No. 298
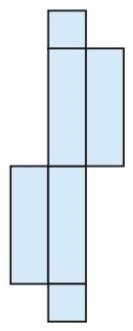
Pose a Problem
Question 13.
Tarique drew the model below for a problem. Write 2 problems that can be solved using this model. One of your problems should involve multiplying a whole number by a fraction and the other problem should involve multiplying a fraction by a whole number.
Pose problems. Solve your problems.
How could you change the model to give you an answer of 4 \(\frac{4}{5}\)?
Explain and write a new equation.
Type below:
_________
Answer:
The five children in the Smith family each spend 2/5 of an hour doing household chores on Saturday. How much time did the spend altogether on their chores?
Multiply the numerator with the whole number.
5 × \(\frac{2}{5}\) = \(\frac{10}{5}\) = 2
Share and Show – Page No. 301
Find the product. Write the product in simplest form.
Question 1.
3 × \(\frac{2}{5}\) =
• Multiply the numerator by the whole number. Write the product over the denominator.
• Write the answer as a mixed number in simplest form.
______ \(\frac{□}{□}\)
Answer: 1 \(\frac{1}{5}\)
Explanation:
Multiply the whole number with the numerator.
3 \(\frac{2}{5}\) = \(\frac{6}{5}\)
Now write the improper fraction in the form of the mixed fraction.
\(\frac{6}{5}\) = 1 \(\frac{1}{5}\)
Question 2.
\(\frac{2}{3}\) × 5 = ______ \(\frac{□}{□}\)
Answer: 3 \(\frac{1}{3}\)
Explanation:
Multiply the whole number with the numerator.
\(\frac{2}{3}\) × 5 = \(\frac{10}{3}\)
Now write the improper fraction in the form of the mixed fraction.
\(\frac{10}{3}\) = 3 \(\frac{1}{3}\)
On Your Own
Find the product. Write the product in simplest form.
Question 5.
5 × \(\frac{2}{3}\) = ______ \(\frac{□}{□}\)
Answer: 3 \(\frac{1}{3}\)
Explanation:
5 × \(\frac{2}{3}\)
Multiply the whole number with the numerator.
5 × \(\frac{2}{3}\) = \(\frac{10}{3}\)
Now write the improper fraction in the form of the mixed fraction.
3 \(\frac{1}{3}\)
5 × \(\frac{2}{3}\) = 3 \(\frac{1}{3}\)
Question 6.
\(\frac{1}{4}\) × 3 = ______ \(\frac{□}{□}\)
Answer: \(\frac{3}{4}\)
Explanation:
\(\frac{1}{4}\) × 3
Multiply the whole number with the numerator.
\(\frac{1}{4}\) × 3 = \(\frac{3}{4}\)
Question 7.
7 × \(\frac{7}{8}\) = ______ \(\frac{□}{□}\)
Answer: 6 \(\frac{1}{8}\)
Explanation:
7 × \(\frac{7}{8}\)
Multiply the whole number with the numerator.
\(\frac{49}{8}\)
Now write the improper fraction in the form of the mixed fraction.
\(\frac{49}{8}\) = 6 \(\frac{1}{8}\)
Thus, 7 × \(\frac{7}{8}\) = 6 \(\frac{1}{8}\)
Question 8.
2 × \(\frac{4}{5}\) = ______ \(\frac{□}{□}\)
Answer: 1 \(\frac{3}{5}\)
Explanation:
2 × \(\frac{4}{5}\)
Multiply the whole number with the numerator.
2 × \(\frac{4}{5}\) = \(\frac{8}{5}\)
Now write the improper fraction in the form of the mixed fraction.
\(\frac{8}{5}\) = 1 \(\frac{3}{5}\)
Question 9.
4 × \(\frac{3}{4}\) = ______
Answer: 3
Explanation:
Multiply the whole number with the numerator.
4 × \(\frac{3}{4}\) = \(\frac{12}{4}\)
4 divides 12 three times.
So, \(\frac{12}{4}\) = 3
4 × \(\frac{3}{4}\) = 3
Question 10.
\(\frac{7}{9}\) × 2 = ______ \(\frac{□}{□}\)
Answer: 1 \(\frac{5}{9}\)
Explanation:
\(\frac{7}{9}\) × 2
Multiply the whole number with the numerator.
\(\frac{7}{9}\) × 2 = \(\frac{14}{9}\)
Now write the improper fraction in the form of the mixed fraction.
\(\frac{14}{9}\) = 1 \(\frac{5}{9}\)
Practice: Copy and Solve. Find the product. Write the product in simplest form.
Question 13.
\(\frac{5}{8}\) × 3 = ______ \(\frac{□}{□}\)
Answer: 1 \(\frac{7}{8}\)
Explanation:
\(\frac{5}{8}\) × 3
Multiply the whole number with the numerator.
\(\frac{5}{8}\) × 3 = \(\frac{15}{8}\)
Now write the improper fraction in the form of the mixed fraction.
\(\frac{15}{8}\) = 1 \(\frac{7}{8}\)
Algebra Find the unknown digit.
Question 14.
\(\frac{■}{2}\) × 8 = 4
■ = ______
Answer: 1
Explanation:
\(\frac{■}{2}\) × 8 = 4
\(\frac{■}{2}\) = 4/8
■ = 4 × 2/8 = 1
■ = 1
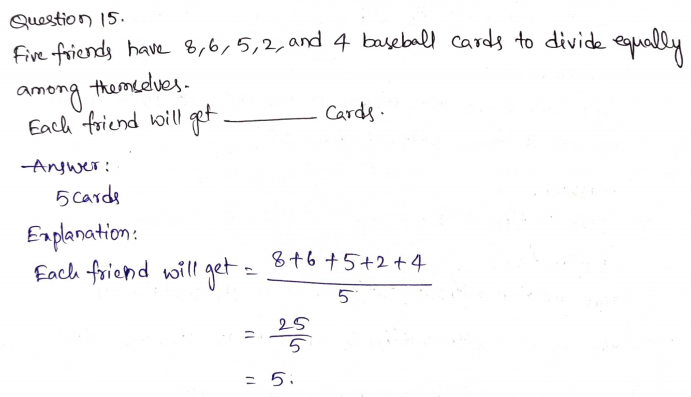
Question 15.
■ × \(\frac{5}{6}\) = \(\frac{20}{6}\) or 3 \(\frac{1}{3}\)
■ = ______
Answer: 4
Explanation:
■ × \(\frac{5}{6}\) = \(\frac{20}{6}\)
■ = 20/6 × 6/5
■ = 20/5 = 4
■ = 4
Question 16.
\(\frac{1}{■}\) × 18 = 3
■ = ______
Answer: 6
Explanation:
\(\frac{1}{■}\) × 18 = 3
\(\frac{1}{3}\) × 18 = ■
■ = 18/3 = 6
■ = 6
UNLOCK the Problem – Page No. 302

Question 17.
The caterer wants to have enough turkey to feed 24 people. If he wants to provide \(\frac{3}{4}\) of a pound of turkey for each person, how much turkey does he need?
a. What do you need to find?
Type below:
__________
Answer: I need to find How much turkey the caterer needs to provide for each person.
Question 17.
b. What operation will you use?
Type below:
__________
Answer: I will use the multiplication operation to solve the problem.
Question 17.
c. What information are you given?
Type below:
__________
I am given the information about the number of people to feed and the fraction of pounds of turkey each person gets.
Question 17.
d. Solve the problem.
Type below:
__________
Answer:
The caterer wants to serve 24 people
\(\frac{3}{4}\) × 24
4 divides 24 six times.
3 × 6 = 18
Thus the caterer needs 18 pounds of Turkey.
Question 17.
e. Complete the sentences.
The caterer wants to serve 24 people _____ of a pound of turkey each.
He will need ____ × ____ , or ______ pounds of turkey.
Type below:
__________
Answer: \(\frac{3}{4}\) × 24
Question 17.
f. Fill in the bubble for the correct answer choice.
Options:
a. 72 pounds
b. 24 pounds
c. 18 pounds
d. 6 pounds
Answer: 18 pounds
Explanation:
The caterer wants to serve 24 people
\(\frac{3}{4}\) × 24
4 divides 24 six times.
3 × 6 = 18
The correct answer is option C.
Question 18.
Patty wants to run \(\frac{5}{6}\) of a mile every day for 5 days. How far will she run in that time?
Options:
a. 25 miles
b. 5 miles
c. 4 \(\frac{1}{6}\) miles
d. 1 \(\frac{2}{3}\) miles
Answer: 4 \(\frac{1}{6}\) miles
Explanation:
Patty wants to run \(\frac{5}{6}\) of a mile every day for 5 days.
\(\frac{5}{6}\) × 5 = \(\frac{25}{6}\)
Convert the improper fraction to the mixed fraction.
\(\frac{25}{6}\) = 4 \(\frac{1}{6}\) miles
Thus the correct answer is option C.
Question 19.
Doug has 33 feet of rope. He wants to use \(\frac{2}{3}\) of it for his canoe. How many feet of rope will he use for his canoe?
Options:
a. 11 feet
b. 22 feet
c. 33 feet
d. 66 feet
Answer: 22 feet
Explanation:
Doug has 33 feet of rope. He wants to use \(\frac{2}{3}\) of it for his canoe.
\(\frac{2}{3}\) × 33 feet
3 divides 33 eleven times.
2 × 11 = 22 feet
The correct answer is option B.
Share and Show – Page No. 304
Use the model to find the product.
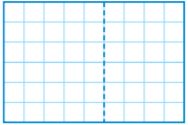
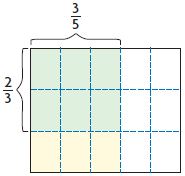
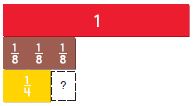
Question 1.
\(\frac{3}{5} \times \frac{1}{3}=\)
\(\frac{□}{□}\)
Answer: \(\frac{1}{5}\)
Explanation:
The fraction \(\frac{3}{5}\) represents the rows and columns.
The fraction \(\frac{1}{3}\) indicates the shaded part of the figure.
\(\frac{3}{5}\) × \(\frac{1}{3}\) = \(\frac{1}{5}\)
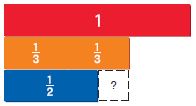
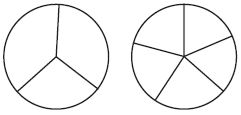
Question 2.
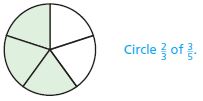
\(\frac{2}{3} \times \frac{3}{5}=\)
\(\frac{□}{□}\)
Answer: \(\frac{2}{5}\)
Explanation:
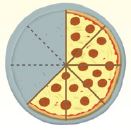
The above figure shows that the circle is divided into 5 parts in which 2 parts are non shaded and 3 parts are shaded.
So, the fraction of the circle is \(\frac{2}{3}\)
The fraction for the shaded part of the circle is \(\frac{3}{5}\)
\(\frac{2}{3}\) × \(\frac{3}{5}\) = \(\frac{2}{5}\)
Share and Show – Page No. 305
Find the product. Draw a model.
Question 5.
\(\frac{3}{5} \times \frac{1}{3}=\) \(\frac{□}{□}\)
Answer: \(\frac{1}{5}\)
Explanation:
\(\frac{3}{5}\) × \(\frac{1}{3}\)
Multiply the denominators and the numerators of the fractions.
\(\frac{3}{5}\) × \(\frac{1}{3}\) = \(\frac{3}{15}\)
\(\frac{3}{15}\) = \(\frac{1}{5}\)
\(\frac{3}{5} \times \frac{1}{3}=\) \(\frac{1}{5}\)
Question 6.
\(\frac{3}{4} \times \frac{1}{6}=\) \(\frac{□}{□}\)
Answer: \(\frac{1}{8}\)
Explanation:
\(\frac{3}{4}\) × \(\frac{1}{6}\)
Multiply the denominators and the numerators of the fractions.
\(\frac{3}{4}\) × \(\frac{1}{6}\) = \(\frac{3}{24}\)
3 divides 24 eight times.
So, \(\frac{3}{24}\) = \(\frac{1}{8}\)
Thus, \(\frac{3}{4} \times \frac{1}{6}=\) \(\frac{1}{8}\)
Question 7.
\(\frac{2}{5} \times \frac{5}{6}=\) \(\frac{□}{□}\)
Answer: \(\frac{1}{3}\)
Explanation:
\(\frac{2}{5}\) × \(\frac{5}{6}\)
Multiply the denominators and the numerators of the fractions.
\(\frac{2}{5}\) × \(\frac{5}{6}\) = \(\frac{10}{30}\)
10 divides 30 three times.
\(\frac{10}{30}\) = \(\frac{1}{3}\)
\(\frac{2}{5} \times \frac{5}{6}=\) \(\frac{1}{3}\)
Question 8.
\(\frac{5}{6} \times \frac{3}{5}=\) \(\frac{□}{□}\)
Answer: \(\frac{1}{2}\)
Explanation:
\(\frac{5}{6}\) × \(\frac{3}{5}\)
Multiply the denominators and the numerators of the fractions.
\(\frac{5}{6}\) × \(\frac{3}{5}\) = \(\frac{15}{30}\)
\(\frac{5}{6}\) × \(\frac{3}{5}\) = \(\frac{15}{30}\) = \(\frac{1}{2}\)
\(\frac{5}{6} \times \frac{3}{5}=\) \(\frac{1}{2}\)
Problem Solving – Page No. 306
What’s the Error?

Question 9.
Cheryl and Marcus are going to make a two-tiered cake. The smaller tier is \(\frac{2}{3}\) the size of the larger tier. The recipe for the bottom tier calls for \(\frac{3}{5}\) cup of water. How much water will they need to make the smaller tier?
They made a model to represent the problem. Cheryl says they need \(\frac{6}{9}\) cup of water. Marcus says they need \(\frac{2}{5}\) cup water. Who is correct? Explain.
Cheryl’s answer Marcus’ answer
Type below:
_________
Answer: Marcus’ answer is correct.
Explanation:
Cheryl and Marcus are going to make a two-tiered cake.
The smaller tier is \(\frac{2}{3}\) the size of the larger tier.
The recipe for the bottom tier calls for \(\frac{3}{5}\) cup of water.
\(\frac{3}{5}\) × \(\frac{2}{3}\) = \(\frac{2}{5}\)
Share and Show – Page No. 309
Complete the statement with equal to, greater than, or less than.
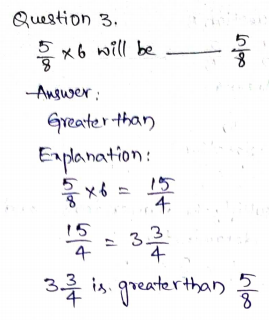
Question 1.
4 × \(\frac{7}{8}\) will be ___________ \(\frac{7}{8}\)
_________
Answer: Greater than
Explanation:
4 × \(\frac{7}{8}\) = \(\frac{7}{2}\)
The denominator with a greater number will be the smallest number.
So, \(\frac{7}{2}\) is greater than \(\frac{7}{8}\)
Question 2.
\(\frac{3}{5} \times \frac{2}{7}\) will be ___________ \(\frac{3}{5}\)
Answer: Less than
Explanation:
\(\frac{3}{5}\) × \(\frac{2}{7}\) = \(\frac{6}{35}\)
The denominator with the greatest number will be the smallest fraction.
So, \(\frac{6}{35}\) is less than \(\frac{3}{5}\)
Question 5.
\(8 \times \frac{7}{8}\) will be ___________ 8
Answer: Less than
Explanation:
8 × \(\frac{7}{8}\)= 7
7 is less than 8.
\(8 \times \frac{7}{8}\) will be less than 8.
On Your Own
Complete the statement with equal to, greater than, or less than.
Question 6.
\(\frac{4}{9} \times \frac{3}{8}\) will be ___________ \(\frac{3}{8}\)
Answer: Less than
Explanation:
\(\frac{4}{9}\) × \(\frac{3}{8}\) = \(\frac{12}{72}\)
= \(\frac{1}{6}\)
\(\frac{1}{6}\) is less than \(\frac{3}{8}\)
\(\frac{4}{9} \times \frac{3}{8}\) will be less than \(\frac{3}{8}\)
Question 7.
\(7 \times \frac{9}{10}\) will be ___________ \(\frac{9}{10}\)
Answer: Greater than
Explanation:
7 × \(\frac{9}{10}\) = \(\frac{63}{10}\)
Denominators are same so compare the numerators.
\(\frac{63}{10}\) is greater than \(\frac{9}{10}\)
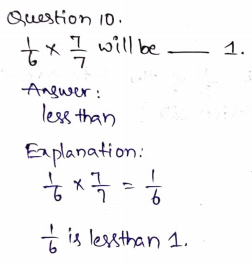
Question 8.
\(5 \times \frac{1}{3}\) will be ___________ \(\frac{1}{3}\)
Answer: Greater than
Explanation:
5 × \(\frac{1}{3}\) = \(\frac{5}{3}\)
Denominators are same so compare the numerators.
\(\frac{5}{3}\) is greater than \(\frac{1}{3}\)
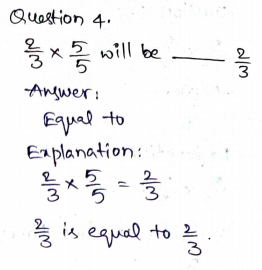
Question 9.
\(\frac{6}{11} \times 1\) will be ___________ \(\frac{6}{11}\)
Answer: Equal to
Explanation:
\(\frac{6}{11}\) × 1 = \(\frac{6}{11}\)
\(\frac{6}{11}\) is equal to \(\frac{6}{11}\).
Problem Solving – Page No. 310
Question 12.
Lola is making cookies. She plans to multiply the recipe by 3 so she can make enough cookies for the whole class. If the recipe calls for \(\frac{2}{3}\) cup of sugar, will she need more than \(\frac{2}{3}\) or less than \(\frac{2}{3}\) cup of sugar to make all the cookies?
_________ \(\frac{2}{3}\) cup of sugar
Answer: More than
Explanation:
ola is making cookies. She plans to multiply the recipe by 3 so she can make enough cookies for the whole class.
3 × \(\frac{2}{3}\) = 2
So, Lola needs more than \(\frac{2}{3}\) cup of sugar.
Question 14.
Test Prep Rochelle saves \(\frac{1}{4}\) of her allowance. If she decides to start saving \(\frac{1}{2}\) as much, which statement below is true?
Options:
a. She will be saving the same amount.
b. She will be saving more.
c. She will be saving less.
d. She will be saving twice as much.
Answer: She will be saving more
Explanation:
Test Prep Rochelle saves \(\frac{1}{4}\) of her allowance.
\(\frac{1}{4}\) is greater than \(\frac{1}{2}\)
So, the answer is option B.
Connect to Art
A scale model is a representation of an object with the same shape as the real object. Models can be larger or smaller than the actual object but are often smaller.
Architects often make scale models of the buildings or structures they plan to build. Models can give them an idea of how the structure will look when finished. Each measurement of the building is scaled up or down by the same factor.

Bob is building a scale model of his bike. He wants his model to be \(\frac{1}{5}\) as long as his bike.
Question 15.
If Bob’s bike is 60 inches long, how long will his model be?
_____ in.
Answer: 12 inches
Explanation:
Given that, Bob is building a scale model of his bike. He wants his model to be \(\frac{1}{5}\) as long as his bike.
If Bob’s bike is 60 inches long then multiply with the fraction \(\frac{1}{5}\)
\(\frac{1}{5}\) × 60 = 12 inches
The model will be 12 inches long.
Question 16.
If one wheel on Bob’s model is 4 inches across, how many inches across is the actual wheel on his bike? Explain.
\(\frac{□}{□}\) in.
Answer: \(\frac{4}{5}\) in.
Explanation:
Given that, one wheel on Bob’s model is 4 inches across.
4 × \(\frac{1}{5}\) = \(\frac{4}{5}\) in.
Share and Show – Page No. 313
Find the product. Write the product in simplest form.
Question 1.
\(6 \times \frac{3}{8}\)
\(\frac{6}{1} \times \frac{3}{8}\) = \(\frac{■}{■}\)
______ \(\frac{□}{□}\)
Answer: 2 \(\frac{1}{4}\)
Explanation:
\(\frac{6}{1} \times \frac{3}{8}\) = \(\frac{■}{■}\)
6 × \(\frac{3}{8}\) = \(\frac{18}{8}\) = \(\frac{9}{4}\)
\(\frac{9}{4}\) = 2 \(\frac{1}{4}\)
2 \(\frac{1}{4}\) = \(\frac{■}{■}\)
\(\frac{■}{■}\) = 2 \(\frac{1}{4}\)
Question 2.
\(\frac{3}{8} \times \frac{8}{9}\) = \(\frac{□}{□}\)
Answer: \(\frac{1}{3}\)
Explanation:
\(\frac{3}{8} \times \frac{8}{9}\) = \(\frac{□}{□}\)
\(\frac{3}{8}\) × \(\frac{8}{9}\) = \(\frac{1}{3}\)
Thus, \(\frac{3}{8} \times \frac{8}{9}\) = \(\frac{1}{3}\)
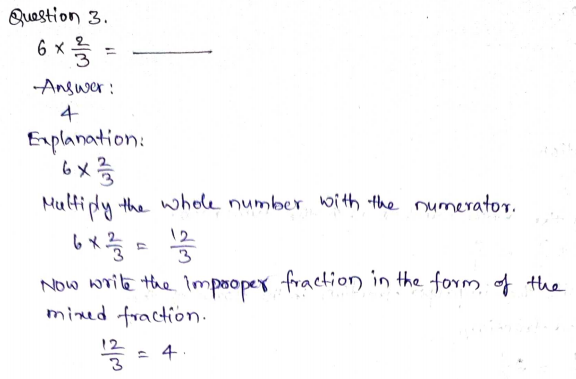
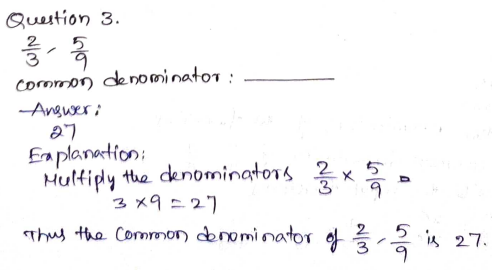
Question 3.
\(\frac{2}{3} \times 27\) = ______
Answer: 18
Explanation:
27 × \(\frac{2}{3}\)
3 divides 27 nine times.
Thus, 27 × \(\frac{2}{3}\) = 18
Question 6.
\(\frac{2}{3} \times \frac{4}{5}\) = \(\frac{□}{□}\)
Answer: \(\frac{8}{15}\)
Explanation:
\(\frac{2}{3}\) × \(\frac{4}{5}\)
Multiply the numerators and the denominators.
\(\frac{2}{3}\) × \(\frac{4}{5}\) = \(\frac{8}{15}\)
Question 7.
\(\frac{1}{3} \times \frac{5}{8}\) = \(\frac{□}{□}\)
Answer: \(\frac{5}{24}\)
Explanation:
\(\frac{1}{3}\) × \(\frac{5}{8}\)
Multiply the numerators and the denominators.
\(\frac{1}{3} \times \frac{5}{8}\) = \(\frac{5}{24}\)
Question 8.
\(4 \times \frac{1}{5}\) = \(\frac{□}{□}\)
Answer: \(\frac{4}{5}\)
Explanation:
Multiply the numerator with the whole number.
4 × \(\frac{1}{5}\) = \(\frac{4}{5}\)
\(4 \times \frac{1}{5}\) = \(\frac{4}{5}\)
On Your Own
Find the product. Write the product in simplest form.
Question 9.
\(2 \times \frac{1}{8}\) = \(\frac{□}{□}\)
Answer: \(\frac{1}{4}\)
Explanation:
Multiply the whole number with the numerator.
2 × \(\frac{1}{8}\)
2 divides 8 four times.
2 × \(\frac{1}{8}\) = \(\frac{1}{4}\)
\(2 \times \frac{1}{8}\) = \(\frac{1}{4}\)
Question 10.
\(\frac{4}{9} \times \frac{4}{5}\) = \(\frac{□}{□}\)
Answer: \(\frac{16}{45}\)
Explanation:
\(\frac{4}{9}\) × \(\frac{4}{5}\)
Multiply the numerators and the denominators.
\(\frac{4}{9}\) × \(\frac{4}{5}\) = \(\frac{16}{45}\)
\(\frac{4}{9} \times \frac{4}{5}\) = \(\frac{16}{45}\)
Question 11.
\(\frac{1}{12} \times \frac{2}{3}\) = \(\frac{□}{□}\)
Answer: \(\frac{1}{18}\)
Explanation:
\(\frac{1}{12}\) × \(\frac{2}{3}\)
Multiply the numerators and the denominators.
\(\frac{1}{12}\) × \(\frac{2}{3}\) = \(\frac{2}{36}\)
\(\frac{2}{36}\) = \(\frac{1}{18}\)
\(\frac{1}{12} \times \frac{2}{3}\) = \(\frac{1}{18}\)
Question 12.
\(\frac{1}{7} \times 30\) = _____ \(\frac{□}{□}\)
Answer: 4 \(\frac{2}{7}\)
Explanation:
30 × \(\frac{1}{7}\) = \(\frac{30}{7}\)
Convert improper fraction to the mixed fraction.
\(\frac{30}{7}\) = 4 \(\frac{2}{7}\)
\(\frac{1}{7} \times 30\) = 4 \(\frac{2}{7}\)
Algebra Evaluate for the given value.
Question 15.
\(\frac{2}{5}\) × c for c = \(\frac{4}{7}\)
\(\frac{□}{□}\)
Answer: \(\frac{8}{35}\)
Explanation:
\(\frac{2}{5}\) × c = \(\frac{4}{7}\)
c = \(\frac{4}{7}\) × \(\frac{2}{5}\)
c = \(\frac{8}{35}\)
Question 16.
m × \(\frac{4}{5}\) for m = \(\frac{7}{8}\)
\(\frac{□}{□}\)
Answer: \(\frac{7}{10}\)
Explanation:
m = \(\frac{4}{5}\) × \(\frac{7}{8}\)
Multiply the numerators and denominators.
\(\frac{4}{5}\) × \(\frac{7}{8}\) = \(\frac{7}{10}\)
Question 17.
\(\frac{2}{3}\) × t for t = \(\frac{1}{8}\)
\(\frac{□}{□}\)
Answer: \(\frac{1}{12}\)
Explanation:
\(\frac{2}{3}\) × t for t = \(\frac{1}{8}\)
t = \(\frac{1}{8}\) × \(\frac{2}{3}\)
t = \(\frac{1}{12}\)
Question 18.
y × \(\frac{2}{3}\) for y = 5
_______
Answer: 4
Explanation:
y × \(\frac{2}{3}\) for y = 5
6 × \(\frac{2}{3}\) = 4
Problem Solving – Page No. 314
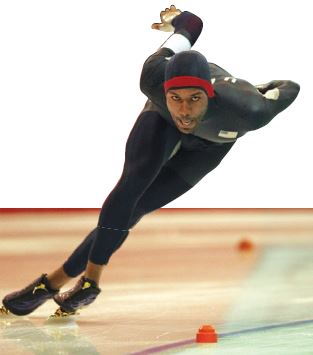
Speedskating is a popular sport in the Winter Olympics. Many young athletes in the U.S. participate in speedskating clubs and camps.
Question 19.
At a camp in Green Bay, Wisconsin, \(\frac{7}{9}\) of the participants were from Wisconsin. Of that group, \(\frac{3}{5}\) were 12 years old. What fraction of the group was from Wisconsin and 12 years old?
\(\frac{□}{□}\)
Answer: \(\frac{7}{15}\)
Explanation:
Given that,
At a camp in Green Bay, Wisconsin, \(\frac{7}{9}\) of the participants were from Wisconsin.
Of that group, \(\frac{3}{5}\) were 12 years old.
To find the fraction of the group was from Wisconsin and 12 years old
We have to multiply the fraction \(\frac{7}{9}\) and \(\frac{3}{5}\)
\(\frac{7}{9}\) × \(\frac{3}{5}\) = \(\frac{21}{45}\)
\(\frac{21}{45}\) = \(\frac{7}{15}\)
Thus the fraction of the group was from Wisconsin and 12 years old is \(\frac{7}{15}\).
Question 20.
Maribel wants to skate 1 \(\frac{1}{2}\) miles on Monday. If she skates \(\frac{9}{10}\) mile Monday morning and \(\frac{2}{3}\) of that distance Monday afternoon, will she reach her goal? Explain.
_____
Answer: Yes
Explanation:
Maribel wants to skate 1 \(\frac{1}{2}\) miles on Monday.
To find whether Maribel reached her goal we have to multiply the fractions \(\frac{9}{10}\) and \(\frac{2}{3}\)
\(\frac{9}{10}\) × \(\frac{2}{3}\) = \(\frac{3}{5}\)
By this we can say that Maribel reaches her goal.
So, the answer is yes.
Question 21.
On the first day of camp, \(\frac{5}{6}\) of the skaters were beginners. Of the beginners, \(\frac{1}{3}\) were girls. What fraction of the skaters were girls and beginners? Explain why your answer is reasonable.
\(\frac{□}{□}\)
Answer: \(\frac{5}{18}\)
Explanation:
On the first day of camp, \(\frac{5}{6}\) of the skaters were beginners. Of the beginners, \(\frac{1}{3}\) were girls.
Multiply the fraction of the skaters were beginning and the fraction of skaters were girls.
\(\frac{5}{6}\) × latex]\frac{1}{3}[/latex] = latex]\frac{5}{18}[/latex]
The fraction of the skaters were girls and beginners are latex]\frac{5}{18}[/latex]
Question 22.
Test Prep On Wednesday, Danielle skated \(\frac{2}{3}\) of the way around the track in 2 minutes. Her younger brother skated \(\frac{3}{4}\) of Danielle’s distance in 2 minutes. What fraction of the track did Danielle’s brother finish in 2 minutes?
Options:
a. \(\frac{1}{3}\)
b. \(\frac{1}{2}\)
c. \(\frac{5}{7}\)
d. \(\frac{3}{4}\)
Answer: \(\frac{1}{2}\)
Explanation:
Test Prep On Wednesday, Danielle skated \(\frac{2}{3}\) of the way around the track in 2 minutes.
Her younger brother skated \(\frac{3}{4}\) of Danielle’s distance in 2 minutes.
Multiply the fraction of Danielle skated and her younger brother skated.
\(\frac{2}{3}\) × \(\frac{3}{4}\) = \(\frac{1}{2}\)
Thus the correct answer is option B.
Mid-Chapter Checkpoint – Page No. 315
Concept and Skills
Question 1.
Explain how you would model 5 × \(\frac{2}{3}\)
Type below:
__________
Answer: \(\frac{10}{3}\)
Question 2.
When you multiply \(\frac{2}{3}\) by a fraction less than one, how does the product compare to the factors?
Type below:
__________
Answer: \(\frac{2}{3}\) × \(\frac{1}{2}\)
= \(\frac{1}{3}\)
Find the product. Write the product in simplest form.
Question 3.
\(\frac{2}{3} \times 6\)
______
Answer: 4
Explanation:
6 × \(\frac{2}{3}\)
Multiply the numerator with the whole numbers.
\(\frac{1}{3}\)
Question 6.
\(\frac{7}{8} \times \frac{3}{8}\)
\(\frac{□}{□}\)
Answer: \(\frac{21}{64}\)
Explanation:
\(\frac{7}{8}\) × \(\frac{3}{8}\)
Multiply the numerators and denominators of the fractions.
\(\frac{7}{8}\) × \(\frac{3}{8}\) = \(\frac{21}{64}\)
Question 7.
\(\frac{1}{2} \times \frac{3}{4}\)
\(\frac{□}{□}\)
Answer: \(\frac{3}{8}\)
Explanation:
Multiply the numerators and denominators of the fractions.
\(\frac{1}{2} \times \frac{3}{4}\)
\(\frac{1}{2}\) × \(\frac{3}{4}\) = \(\frac{3}{8}\)
\(\frac{1}{2} \times \frac{3}{4}\) = \(\frac{3}{8}\)
Question 8.
\(\frac{7}{8} \times \frac{4}{7}\)
\(\frac{□}{□}\)
Answer: \(\frac{1}{2}\)
Explanation:
Multiply the numerators and denominators of the fractions.
7 in the numerator and 7 in the denominator will be canceled.
4 divides 8 two times.
Thus the fraction is \(\frac{1}{2}\)
\(\frac{7}{8} \times \frac{4}{7}\) = \(\frac{1}{2}\)
Question 9.
\(2 \times \frac{3}{11}\)
\(\frac{□}{□}\)
Answer: \(\frac{6}{11}\)
Explanation:
Multiply the numerator with the whole numbers.
2 × \(\frac{3}{11}\)
2 × 3 = 6
2 × \(\frac{3}{11}\) = \(\frac{6}{11}\)
Thus, \(2 \times \frac{3}{11}\) = \(\frac{6}{11}\)
Question 10.
\(\frac{5}{8} \times \frac{2}{3}\)
\(\frac{□}{□}\)
Answer: \(\frac{5}{12}\)
Explanation:
\(\frac{5}{8} \times \frac{2}{3}\)
Multiply the numerators and denominators of the fractions.
\(\frac{5}{8}\) × \(\frac{2}{3}\) = \(\frac{10}{24}\)
\(\frac{10}{24}\) = \(\frac{5}{12}\)
\(\frac{5}{8} \times \frac{2}{3}\) = \(\frac{5}{12}\)
Question 11.
\(\frac{7}{12} \times 8\)
______ \(\frac{□}{□}\)
Answer: 4 \(\frac{2}{3}\)
Explanation:
8 × \(\frac{7}{12}\)
Multiply the numerator with the whole numbers.
8 × \(\frac{7}{12}\) = \(\frac{56}{12}\) = \(\frac{14}{3}\)
Convert the improper fraction to the mixed fraction.
\(\frac{14}{3}\) = 4 \(\frac{2}{3}\)
Complete the statement with equal to, greater than, or less than.
Mid-Chapter Checkpoint – Page No. 316
Question 14.
There is \(\frac{5}{6}\) of an apple pie left from dinner. Tomorrow, Victor plans to eat \(\frac{1}{6}\) of the pie that was left. How much of the whole pie will be left after he eats tomorrow?
\(\frac{□}{□}\) of the whole pie
Answer: \(\frac{25}{36}\) of the whole pie
Explanation:
Gīven that,
An apple pie left from the dinner is \(\frac{5}{6}\)
Victor plans to eat pie which was left is \(\frac{1}{6}\)
The whole pie will be left after Victor eats tomorrow =?
Pie left from dinner = \(\frac{5}{6}\)
Victor plans to eat pie which was left = \(\frac{1}{6}\)
\(\frac{5}{6}\) × \(\frac{1}{6}\) = \(\frac{5}{36}\)
To find the whole pie will be left after he eats tomorrow:
\(\frac{5}{6}\) – \(\frac{5}{36}\)
LCD = 36
\(\frac{5}{6}\) × \(\frac{6}{6}\) – \(\frac{5}{36}\)
\(\frac{30}{36}\) – \(\frac{5}{36}\) = \(\frac{25}{36}\)
Therefore, whole pie left after Victor eats tomorrow is \(\frac{25}{36}\)
Question 15.
Everett and Marie are going to make fruit bars for their family reunion. They want to make 4 times the amount the recipe makes. If the recipe calls for \(\frac{2}{3}\) cup of oil, how much oil will they need?
______ \(\frac{□}{□}\) cup of oil
Answer: 2 \(\frac{2}{3}\)
Explanation:
Everett and Marie are going to make fruit bars for their family reunion.
They want to make 4 times the amount the recipe makes.
4 × \(\frac{2}{3}\) = \(\frac{8}{3}\)
The mixed fraction of \(\frac{8}{3}\) is 2 \(\frac{2}{3}\)
Thus Everett and Marie need Everett and Marie of oil.
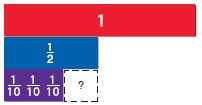
Question 16.
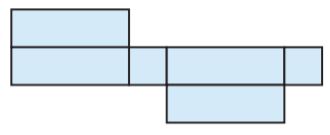
Matt made the model below to help him solve his math problem. Write an expression that matches Matt’s model.
Type below:
__________
Answer: \(\frac{3}{4}\) × \(\frac{1}{3}\)
Explanation:
By seeing the above figure we can say that the fraction for the Matt’s model is \(\frac{3}{4}\) and \(\frac{2}{3}\).
Multiply the fractions \(\frac{3}{4}\) × \(\frac{2}{3}\) = \(\frac{1}{4}\)
Share and Show – Page No. 319
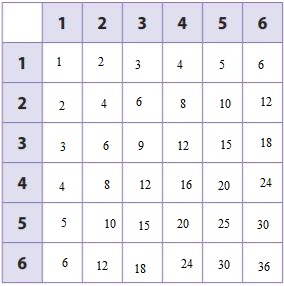
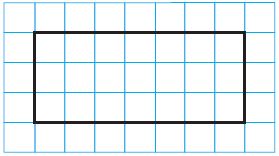
Use the grid to find the area. Let each square represent \(\frac{1}{3}\) meter by \(\frac{1}{3}\) meter.
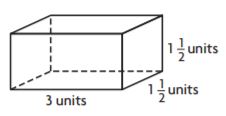
Question 1.
1 \(\frac{2}{3}\) × 1 \(\frac{1}{3}\)
• Draw a diagram to represent the dimensions.

• How many squares cover the diagram?
• What is the area of each square?
• What is the area of the diagram?
______ \(\frac{□}{□}\)
Answer: 2 \(\frac{2}{9}\)
Explanation:
20 squares cover the diagram.
Each square represents \(\frac{1}{9}\) square meter
20 × \(\frac{1}{9}\) = \(\frac{20}{9}\)
Convert the fraction into the mixed fraction.
\(\frac{20}{9}\) = 2 \(\frac{2}{9}\)
Thus the area of the diagram is 2 \(\frac{2}{9}\)
Use the grid to find the area. Let each square represent \(\frac{1}{4}\) meter by \(\frac{1}{4}\) meter.
Question 2.
1 \(\frac{3}{4}\) × 1 \(\frac{2}{4}\)

______ \(\frac{□}{□}\)
Answer: 2 \(\frac{5}{8}\)
Explanation:
42 squares cover the diagram.
Each square represents \(\frac{1}{16}\) square meters.
42 × \(\frac{1}{16}\) = \(\frac{21}{8}\)
Convert the fraction into the mixed fraction.
\(\frac{21}{8}\) = 2 \(\frac{5}{8}\)
The area of the diagram is 2 \(\frac{5}{8}\) square meter.
Question 3.
1 \(\frac{1}{4}\) × 1 \(\frac{1}{2}\)

______ \(\frac{□}{□}\)
Answer: 1 \(\frac{7}{8}\)
Explanation:
30 squares cover the diagram.
Each square represents \(\frac{1}{16}\) square meters.
30 × \(\frac{1}{16}\) = \(\frac{15}{8}\)
Convert the fraction into the mixed fraction.
\(\frac{15}{8}\) = 1 \(\frac{7}{8}\)
Use an area model to solve.
Question 6.
1 \(\frac{1}{9}\) × 1 \(\frac{2}{3}\)
______ \(\frac{□}{□}\)
Answer: 1 \(\frac{23}{27}\)
Explanation:
130 squares the diagram.
Each square represents \(\frac{1}{16}\) square meters.
1 \(\frac{1}{9}\) × 1 \(\frac{2}{3}\)
\(\frac{10}{9}\) × \(\frac{5}{3}\) = \(\frac{50}{27}\)
Convert the fraction into the mixed fraction.
\(\frac{50}{27}\) = 1 \(\frac{23}{27}\)
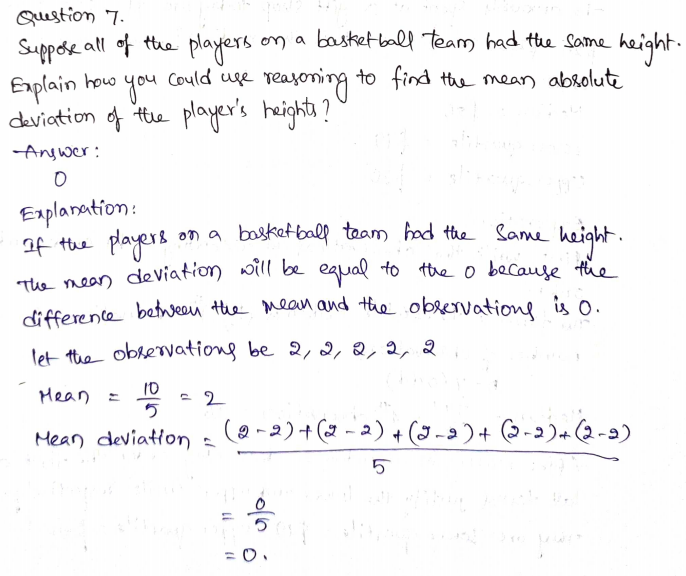
Question 7.
Explain how finding the area of a rectangle with whole-number side lengths compares to finding the area of a rectangle with fractional side lengths.
Type below:
__________
Answer:

15 squares cover the diagram.
Each square is \(\frac{1}{16}\) square unit.
The area of the diagram is \(\frac{15}{16}\) square units.
Problem Solving – Page No. 320
Pose a Problem
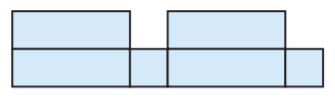
Question 8.
Terrance is designing a garden. He drew the following diagram of his garden. Pose a problem using mixed numbers that can be solved using his diagram.
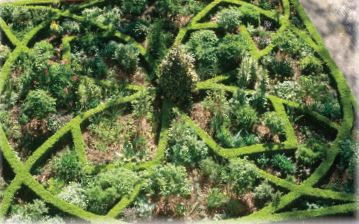
Pose a Problem. Solve your problem.
Describe how you decided on the dimensions of Terrance’s garden.
Type below:
__________
Answer:
how finding the area of a rectangle with mixed fractions side compares to finding the area of the rectangle with the fractional side lengths.
6 × 1 \(\frac{1}{8}\) = \(\frac{□}{□}\)
Let each square represent \(\frac{1}{2}\) meter by \(\frac{1}{2}\)
From the above figure, we can say that the number of squares is 27.
So, 27 squares cover the diagram.
Each square is \(\frac{1}{4}\) square unit.
27 × \(\frac{1}{4}\) = \(\frac{27}{4}\)
Convert the fraction into the mixed fraction.
\(\frac{27}{4}\) = 6 \(\frac{3}{4}\)
Share and Show – Page No. 323
Complete the statement with equal to, greater than, or less than.
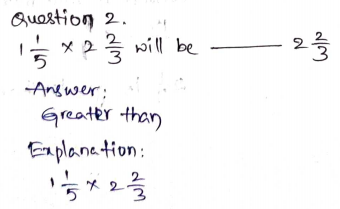
Question 1.
\(\frac{5}{6}\) × 2 \(\frac{1}{5}\) will be __________ 2 \(\frac{1}{5}\)
 Shade the model to
show \(\frac{5}{6}\) × 2 \(\frac{1}{5}\) .
__________
Answer: Less than
Explanation:
\(\frac{5}{6}\) × 2 \(\frac{1}{5}\)
Convert the mixed fraction to the improper fraction.
2 \(\frac{1}{5}\) = \(\frac{11}{5}\)
\(\frac{5}{6}\) × \(\frac{11}{5}\) = \(\frac{55}{30}\)
1 \(\frac{25}{30}\) = 1 \(\frac{5}{6}\)
Thus 1 \(\frac{5}{6}\) is less than 2 \(\frac{1}{5}\)
On Your Own
Complete the statement with equal to, greater than, or less than.
Question 4.
\(\frac{2}{2}\) × 1 \(\frac{1}{2}\) will be __________ 1 \(\frac{1}{2}\)
Answer: Equal to
Explanation:
\(\frac{2}{2}\) × \(\frac{3}{2}\) = \(\frac{6}{4}\)
\(\frac{6}{4}\) = 1 \(\frac{1}{2}\)
1 \(\frac{1}{2}\) is equal to 1 \(\frac{1}{2}\)
\(\frac{2}{2}\) × 1 \(\frac{1}{2}\) will be equal to 1 \(\frac{1}{2}\)
Question 5.
\(\frac{2}{3}\) × 3 \(\frac{1}{6}\) will be __________ 3 \(\frac{1}{6}\)
Answer: Less than
Explanation:
\(\frac{2}{3}\) × 3 \(\frac{1}{6}\)
First, Convert the mixed fraction to the improper fraction.
\(\frac{2}{3}\) × \(\frac{19}{6}\) = \(\frac{38}{18}\)
\(\frac{38}{18}\) = 2 \(\frac{2}{18}\)
2 \(\frac{2}{18}\) is less than 3 \(\frac{1}{6}\)
\(\frac{2}{3}\) × 3 \(\frac{1}{6}\) will be less than 3 \(\frac{1}{6}\)
Question 6.
2 × 2 \(\frac{1}{4}\) will be __________ 2 \(\frac{1}{4}\)
Answer: Greater than
Explanation:
2 × 2 \(\frac{1}{4}\)
First, Convert the mixed fraction to the improper fraction.
2 × \(\frac{9}{4}\) = \(\frac{18}{4}\)
\(\frac{18}{4}\) = 4 \(\frac{2}{4}\)
4 \(\frac{1}{2}\) is greater than 2 \(\frac{1}{4}\)
Question 7.
4 × 1 \(\frac{3}{7}\) will be __________ 1 \(\frac{3}{7}\)
Answer: Greater than
Explanation:
4 × 1 \(\frac{3}{7}\)
First, Convert the mixed fraction to the improper fraction.
4 × \(\frac{10}{7}\) = \(\frac{40}{7}\)
4 × 1 \(\frac{3}{7}\) = 5 \(\frac{5}{7}\)
5 \(\frac{5}{7}\) is greater than 1 \(\frac{3}{7}\)
Algebra Tell whether the unknown factor is less than 1 or greater than 1.
Question 8.
■ × 1 \(\frac{2}{3}\) = \(\frac{5}{6}\)
The unknown factor is __________ 1.
Answer: Less than
Explanation:
■ × 1 \(\frac{2}{3}\) = \(\frac{5}{6}\)
■ × \(\frac{5}{3}\) = \(\frac{5}{6}\)
■ = \(\frac{1}{2}\)
Thus the unknown factor is \(\frac{1}{2}\)
\(\frac{1}{2}\) is less than 1.
Question 9.
■ × 1 \(\frac{1}{4}\) = 2 \(\frac{1}{2}\)
The unknown factor is __________ 1.
Answer: Greater than
Explanation:
■ × 1 \(\frac{1}{4}\) = 2 \(\frac{1}{2}\)
■ = 2 \(\frac{1}{2}\) ÷ 1 \(\frac{1}{4}\)
■ = 2 × 2 = 4
■ = 4
Thus the unknown factor is 4
4 is greater than 1.
Problem Solving – Page No. 324
Question 10.
Kyle is making a scale drawing of his math book. The dimensions of his drawing will be \(\frac{1}{3}\) the dimensions of his book. If the width of his book is 8 \(\frac{1}{2}\) inches, will the width of his drawing be equal to, greater than, or less than 8 \(\frac{1}{2}\) inches?
__________
Answer: Less than
Explanation:
Given that,
Kyle is making a scale drawing of his math book.
The dimensions of his drawing will be \(\frac{1}{3}\) the dimensions of his book.
\(\frac{1}{3}\) × 8 \(\frac{1}{2}\)
First, Convert the mixed fraction to the improper fraction.
\(\frac{1}{3}\) × \(\frac{17}{2}\) = \(\frac{17}{6}\)
Convert the fraction into the mixed fraction.
\(\frac{17}{6}\) = 2 \(\frac{5}{6}\)
2 \(\frac{5}{6}\) is less than 8 \(\frac{1}{2}\) inches.
Question 11.
Sense or Nonsense?
Penny wants to make a model of a beetle that is larger than life-size. Penny says she is going to use a scaling factor of \(\frac{7}{12}\). Does this make sense or is it nonsense? Explain.
Type below:
__________
Answer: It is nonsense because Penny wants to make beetle Larger than life size. So, the scaling factor \(\frac{7}{12}\) is not corresponding, because when we multiply any value with the number less than 1 we get a smaller number.
Question 12.
Shannon, Mary, and John earn a weekly allowance. Shannon earns an amount that is \(\frac{2}{3}\) of what John earns. Mary earns an amount that is 1 \(\frac{2}{3}\) of what John earns. John earns $20 a week. Who earns the greatest allowance? Who earns the least?
__________ earns the greatest allowance.
__________ earns the least allowance
Answer:
Mary earns the greatest allowance.
Shannon earns the least allowance.
Explanation:
Shannon, Mary, and John earn a weekly allowance.
Shannon earns an amount that is \(\frac{2}{3}\) of what John earns.
Mary earns an amount that is 1 \(\frac{2}{3}\) of what John earns.
John earns $20 a week.
\(\frac{2}{3}\) ________ 1 \(\frac{2}{3}\)
Convert the mixed fraction into the improper fraction.
1 \(\frac{2}{3}\) = \(\frac{5}{3}\)
\(\frac{2}{3}\) is less than 1 \(\frac{2}{3}\)
Thus Shannon earns the least allowance and Mary earns the greatest allowance.
Question 13.
Test Prep Addie’s puppy weighs 1 \(\frac{2}{3}\) times what it weighed when it was born. It weighed 1 \(\frac{1}{3}\) pounds at birth. Which statement below is true?
Options:
a. The puppy weighs the same as it did at birth.
b. The puppy weighs less than it did at birth.
c. The puppy weighs more than it did at birth.
d. The puppy weighs twice what it did at birth.
Answer: The puppy weighs more than it did at birth.
Explanation:
Test Prep Addie’s puppy weighs 1 \(\frac{2}{3}\) times what it weighed when it was born.
It weighed 1 \(\frac{1}{3}\) pounds at birth.
1 \(\frac{2}{3}\) is greater than 1 \(\frac{1}{3}\).
So, the puppy weighs more than it did at birth.
Thus the correct answer is option C.
Share and Show – Page No. 327
Find the product. Write the product in simplest form.
Question 1.
1 \(\frac{2}{3}\) × 3 \(\frac{4}{5}\) = \(\frac{■}{3}\) × \(\frac{■}{5}\)
= \(\frac{■}{■}\)
=?
_____ \(\frac{□}{□}\)
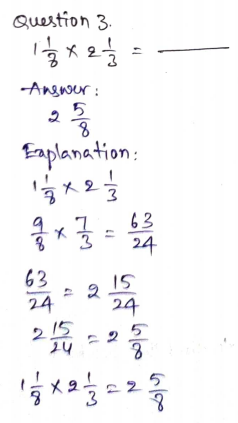
Answer: 6 \(\frac{1}{3}\)
Explanation:
1 \(\frac{2}{3}\) × 3 \(\frac{4}{5}\)
\(\frac{5}{3}\) × \(\frac{19}{5}\)
\(\frac{■}{3}\) × \(\frac{■}{5}\) = \(\frac{5}{3}\) × \(\frac{19}{5}\)
\(\frac{5}{3}\) × \(\frac{19}{5}\) = 6 \(\frac{1}{3}\)
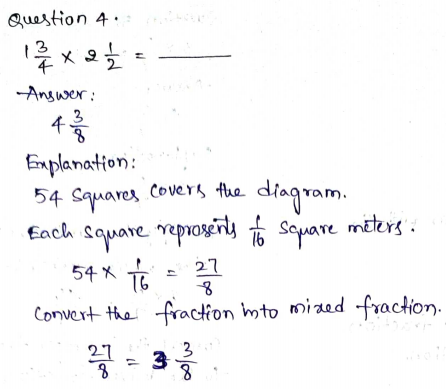
Question 2.
\(\frac{1}{2}\) × 1 \(\frac{1}{3}\)
Shade the model to find the product.
\(\frac{□}{□}\)
Answer: \(\frac{2}{3}\)
Explanation:
\(\frac{1}{2}\) × 1 \(\frac{1}{3}\)
1 \(\frac{1}{3}\) = \(\frac{4}{3}\)
\(\frac{1}{2}\) × \(\frac{4}{3}\) = \(\frac{4}{6}\)
Question 5.
\(1 \frac{2}{7} \times 1 \frac{3}{4}\) = ______ \(\frac{□}{□}\)
Answer: 2 \(\frac{1}{4}\)
Explanation:
1 \(\frac{2}{7}\) × 1 \(\frac{3}{4}\)
Multiply the numerators and the denominators.
Convert the mixed fraction to the improper fraction.
\(\frac{9}{7}\) × \(\frac{7}{4}\) = \(\frac{63}{28}\)
\(\frac{63}{28}\) = 2 \(\frac{1}{4}\)
\(1 \frac{2}{7} \times 1 \frac{3}{4}\) = 2 \(\frac{1}{4}\)
Question 6.
\(\frac{3}{4} \times 1 \frac{1}{4}\) = ______ \(\frac{□}{□}\)
Answer: \(\frac{15}{16}\)
Explanation:
\(\frac{3}{4}\) × 1 \(\frac{1}{4}\)
\(\frac{3}{4}\) × \(\frac{5}{4}\) = \(\frac{15}{16}\)
\(\frac{3}{4} \times 1 \frac{1}{4}\) = \(\frac{15}{16}\)
Use the Distributive Property to find the product.
Question 7.
\(16 \times 2 \frac{1}{2}\) = ______
Answer: 40
Explanation:
\(16 \times 2 \frac{1}{2}\)
(16 × 2) + (16 × \(\frac{1}{2}\))
32 + 8 = 40
\(16 \times 2 \frac{1}{2}\) = 40
Question 8.
\(1 \frac{4}{5} \times 15\) = ______
Answer: 27
Explanation:
\(1 \frac{4}{5} \times 15\)
15 × 1 \(\frac{4}{5}\)
(1 × 15) + (15 × \(\frac{4}{5}\))
15 + \(\frac{60}{5}\)
15 + 12 = 27
Thus \(1 \frac{4}{5} \times 15\) = 27
On Your Own
Find the product. Write the product in simplest form.
Question 9.
\(\frac{3}{4} \times 1 \frac{1}{2}\) = ______ \(\frac{□}{□}\)
Answer: 1 \(\frac{1}{8}\)
Explanation:
\(\frac{3}{4}\) × 1 \(\frac{1}{2}\)
\(\frac{3}{4}\) × \(\frac{3}{2}\) = \(\frac{9}{8}\)
Now convert the improper fraction to the mixed fraction.
\(\frac{9}{8}\) = 1 \(\frac{1}{8}\)
Question 12.
\(2 \frac{1}{2} \times 5 \frac{1}{5}\) = ______
Answer: 13
Explanation:
2 \(\frac{1}{2}\) × 5 \(\frac{1}{5}\)
\(\frac{5}{2}\) × \(\frac{26}{5}\) = \(\frac{130}{10}\)
10 divides 130 thirteen times.
\(\frac{130}{10}\) = 13
\(2 \frac{1}{2} \times 5 \frac{1}{5}\) = 13
Question 13.
\(12 \frac{3}{4} \times 2 \frac{2}{3}\) = ______
Answer: 34
Explanation:
12 \(\frac{3}{4}\) × 2 \(\frac{2}{3}\)
\(\frac{51}{4}\) × \(\frac{6}{3}\)
3 divides 51 seventeen times.
17 × 2 = 34
Question 14.
\(3 \times 4 \frac{1}{2}\) = ______ \(\frac{□}{□}\)
Answer: 13 \(\frac{1}{2}\)
Explanation:
3 × 4 \(\frac{1}{2}\)
3 × \(\frac{9}{2}\) = \(\frac{27}{2}\)
Convert the fraction to the mixed fraction
\(\frac{27}{2}\) = 13 \(\frac{1}{2}\)
Question 15.
\(2 \frac{3}{8} \times \frac{4}{9}\) = ______ \(\frac{□}{□}\)
Answer: 1 \(\frac{1}{18}\)
Explanation:
2 \(\frac{3}{8}\) × \(\frac{4}{9}\)
\(\frac{19}{8}\) × \(\frac{4}{9}\) = \(\frac{76}{72}\)
\(\frac{76}{72}\) = 1 \(\frac{1}{18}\)
\(2 \frac{3}{8} \times \frac{4}{9}\) = 1 \(\frac{1}{18}\)
Question 16.
\(1 \frac{1}{3} \times 1 \frac{1}{4} \times 1 \frac{1}{5}\) = ______
Answer: 2
Explanation:
1 \(\frac{1}{3}\) × 1 \(\frac{1}{4}\) × 1 \(\frac{1}{5}\)
\(\frac{4}{3}\) × \(\frac{5}{4}\) × \(\frac{6}{5}\) = 2
\(1 \frac{1}{3} \times 1 \frac{1}{4} \times 1 \frac{1}{5}\) = 2
Use the Distributive Property to find the product.
Share and Show Connect to health – Page No. 328
Changing Recipes
You can make a lot of recipes more healthful by reducing the amounts of fat, sugar, and salt.
Kelly has a muffin recipe that calls for 1 \(\frac{1}{2}\) cups of sugar. She wants to use \(\frac{1}{2}\) that amount of sugar and more cinnamon and vanilla. How much sugar will she use?
Multiply 1 \(\frac{1}{2}\) by \(\frac{1}{2}\) to find what part of the original amount of sugar to use.
Write the mixed number as a fraction greater than 1. Then, multiply.
\(\frac{1}{2} \times 1 \frac{1}{2}=\frac{1}{2} \times \frac{3}{2}\)
= \(\frac{3}{4}\)
So, Kelly will use \(\frac{3}{4}\) cup of sugar.
Question 19.
Michelle has a recipe that calls for 2 \(\frac{1}{2}\) cups of vegetable oil. She wants to use \(\frac{2}{3}\) that amount of oil and use applesauce to replace the rest. How much vegetable oil will she use?
______ \(\frac{□}{□}\) cups
Answer: 1 \(\frac{2}{3}\)
Explanation:
Michelle has a recipe that calls for 2 \(\frac{1}{2}\) cups of vegetable oil.
She wants to use \(\frac{2}{3}\) that amount of oil and use applesauce to replace the rest
Multiply 2 \(\frac{1}{2}\) by \(\frac{2}{3}\) to find how much vegetable oil she will use.
2 \(\frac{1}{2}\) × \(\frac{2}{3}\)
Convert the mixed fractions into the fractions.
\(\frac{5}{2}\) × \(\frac{2}{3}\) = \(\frac{10}{6}\)
\(\frac{10}{6}\) = \(\frac{5}{3}\) = 1 \(\frac{2}{3}\)
She will use 1 \(\frac{2}{3}\) cups of vegetable oil.
Question 20.
Tony’s recipe for soup calls for 1 \(\frac{1}{4}\) teaspoons of salt. He wants to use \(\frac{1}{2}\) that amount. How much salt will he use?
\(\frac{□}{□}\) teaspoon
Answer: \(\frac{5}{8}\)
Explanation:
Tony’s recipe for soup calls for 1 \(\frac{1}{4}\) teaspoons of salt.
He wants to use \(\frac{1}{2}\) that amount.
Multiply the fractions to find how much salt he will use in the recipe for soup.
1 \(\frac{1}{4}\) × \(\frac{1}{2}\)
Convert the mixed fractions to the improper fractions.
\(\frac{5}{4}\) × \(\frac{1}{2}\) = \(\frac{5}{8}\)
Thus Tony use \(\frac{5}{8}\) teaspoon of salt for soup.
Question 21.
Jeffrey’s recipe for oatmeal muffins calls for 2 \(\frac{1}{4}\) cups of oatmeal and makes one dozen muffins. If he makes 1 \(\frac{1}{2}\) dozen muffins for a club meeting, how much oatmeal will he use?
_____ \(\frac{□}{□}\) cups
Answer: 3 \(\frac{3}{8}\)
Explanation:
Jeffrey’s recipe for oatmeal muffins calls for 2 \(\frac{1}{4}\) cups of oatmeal and makes one dozen muffins.
To find how much oatmeal he will use we need to multiply the fractions.
2 \(\frac{1}{4}\) × 1 \(\frac{1}{2}\)
Convert the mixed fractions to the improper fractions.
\(\frac{9}{4}\) × \(\frac{3}{2}\)
\(\frac{27}{8}\) = 3 \(\frac{3}{8}\)
Thus he will use 3 \(\frac{3}{8}\) cups of oatmeal to make oatmeal muffins.
Question 22.
Cara’s muffin recipe calls for 1 \(\frac{1}{2}\) cups of flour for the muffins and \(\frac{1}{4}\) cup of flour for the topping. If she makes \(\frac{1}{2}\) of the original recipe, how much flour will she use?
\(\frac{□}{□}\) cup of flour
Answer: \(\frac{7}{8}\)
Explanation:
Convert mixed fractions into improper fractions.
1 \(\frac{1}{2}\) = \(\frac{3}{2}\)
\(\frac{3}{2}\) + \(\frac{1}{4}\) = \(\frac{7}{4}\)
Now we can find how much flour she will use to make \(\frac{1}{2}\) of the original recipe, when multiply
\(\frac{7}{4}\) by \(\frac{1}{2}\)
\(\frac{7}{4}\) × \(\frac{1}{2}\) = \(\frac{7}{8}\)
Share and Show – Page No. 331
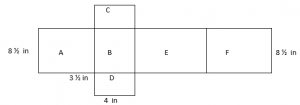
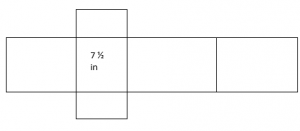
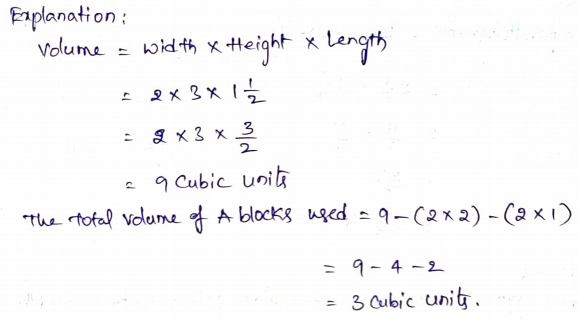
Question 1.
When Pascal built a dog house, he knew he wanted the floor of the house to have an area of 24 square feet. He also wanted the width to be \(\frac{2}{3}\) the length. What are the dimensions of the dog house?
First, choose two numbers that have a product of 24.
Guess: ____ feet and ____ feet
Then, check those numbers. Is the greater number \(\frac{2}{3}\) of the other number?
Check: \(\frac{2}{3}\) × _____ = _____
My guess is ______.
Finally, if the guess is not correct, revise it and check again. Continue until you find the correct answer.
_____ feet by _____ feet
Answer: 4 feet by 6 feet
Explanation:
When Pascal built a dog house, he knew he wanted the floor of the house to have an area of 24 square feet.
He also wanted the width to be \(\frac{2}{3}\) the length.
My guess for 24 square feet is 4 feet and 6 feet.
Now let us check the numbers.
6 × \(\frac{2}{3}\) = 4
So my guess is correct.
Thus the dimensions are 4 feet by 6 feet
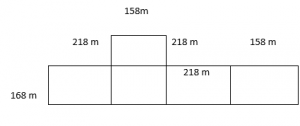
Question 3.
Leo wants to paint a mural that covers a wall with an area of 1,440 square feet. The height of the wall is \(\frac{2}{5}\) of its length. What is the length and the height of the wall?
_____ feet by _____ feet
Answer: 24 feet by 60 feet
Explanation:
Leo wants to paint a mural that covers a wall with an area of 1,440 square feet. The height of the wall is \(\frac{2}{5}\) of its length.
Guess: 1,440 square feet = 24 feet × 60 feet
\(\frac{2}{5}\) × 60 = 24
So, our guess is correct.
.Thus the dimensions of the wall are 24 feet by 60 feet.
On Your Own – Page No. 332
Question 4.
Barry wants to make a drawing that is \(\frac{1}{4}\) the size of the original. If a tree in the original drawing is 14 inches tall, how tall will the tree in Barry’s drawing be?
_____ \(\frac{□}{□}\) inches
Answer: 3 \(\frac{1}{2}\) inches
Explanation:
Given:
Barry wants to make a drawing that is \(\frac{1}{4}\) the size of the original.
The tree is 14 inches tall in the drawing.
14 × \(\frac{1}{4}\) = \(\frac{14}{4}\) = \(\frac{7}{2}\)
Convert the fraction to the mixed fraction.
\(\frac{7}{2}\) = 3 \(\frac{1}{2}\) inches
Question 5.
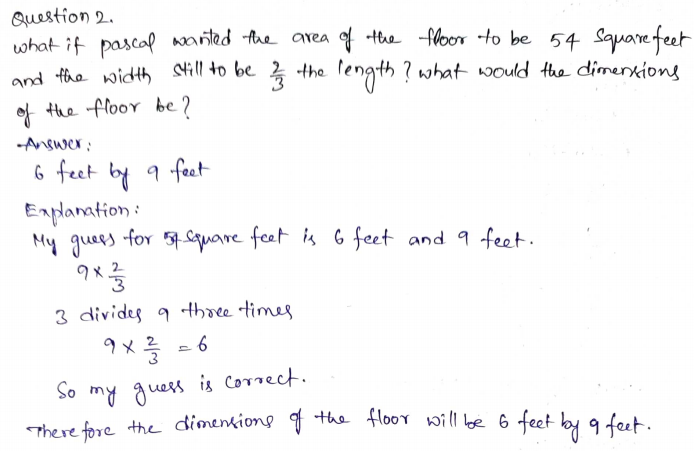
A blueprint is a scale drawing of a building. The dimensions of the blueprint for Penny’s doll house are \(\frac{1}{4}\) of the measurements of the actual doll house. The floor of the doll house has an area of 864 square inches. If the width of the doll house is \(\frac{2}{3}\) the length, what are the dimensions of the floor on the blueprint of the doll house?
_____ inches by _____ inches
Answer: 9 inches by 6 inches
Explanation:
A blueprint is a scale drawing of a building.
The dimensions of the blueprint for Penny’s dollhouse are \(\frac{1}{4}\) of the measurements of the actual dollhouse.
The floor of the dollhouse has an area of 864 square inches.
The area of the dollhouse is 54 square inches.
My guess is 9 inches by 6 inches
Let us check the numbers
9 × \(\frac{2}{3}\) = 6
My guess is correct.
Therefore the dimensions of the floor on the blueprint of the dollhouse is 9 inches by 6 inches
Question 6.
Pose a Problem Look back at Exercise 4. Write a similar problem using a different measurement and a different fraction. Then solve your problem.
Type below:
__________
Answer:
Kyle is making reusable grocery bags and lunch bags. She used a 3/4 yard of cloth to make the grocery bag. A lunch bag requires 2/3 of the amount of cloth of a grocery bag’s needs. How much does she need to make the lunch bag?
\(\frac{3}{4}\) × \(\frac{2}{3}\) = \(\frac{1}{2}\)
Thus Kyle needs \(\frac{1}{2}\) of the grocery bag to make the lunch bag.
Question 7.
Test Prep Albert’s photograph has an area of 80 square inches. The length of the photo is 1 \(\frac{1}{4}\) the width. Which of the following could be the dimensions of the photograph?
Options:
a. 5 inches by 16 inches
b. 12 inches by 10 inches
c. 6 inches by 5 inches
d. 10 inches by 8 inches
Answer: 10 inches by 8 inches
Explanation:
Albert’s photograph has an area of 80 square inches.
The length of the photo is 1 \(\frac{1}{4}\) the width.
My guess for 80 square inches is 10 inches by 8 inches.
Now let us check the numbers.
8 × 1 \(\frac{1}{4}\) = 8 × \(\frac{5}{4}\) = 10
Thus the correct answer is option D.
Chapter Review/Test – Page No. 333
Concepts and Skills
Question 1.
When you multiply 3 \(\frac{1}{4}\) by a number greater than one, how does the product compare to 3 \(\frac{1}{4}\)? Explain.
Type below:
__________
Answer:
Your product will be greater than 3 1/4 because anytime you multiply a fraction times a whole number less than 1 you get a fraction less than one and any time you multiply by a fraction and a whole number greater than 1 your answer is greater than 1.
Use a model to solve.
Question 4.
\(\frac{5}{8}\) × 24 = _____
Answer: 15
Explanation:
\(\frac{5}{8}\) × 24
8 divides 24 three times.
5 × 3 = 15
\(\frac{5}{8}\) × 24 = 15
Find the product. Write the product in simplest form.
Question 5.
\(\frac{3}{5}\) × 8 = _____ \(\frac{□}{□}\)
Answer: 4 \(\frac{4}{5}\)
Explanation:
\(\frac{3}{5}\) × 8 = \(\frac{24}{5}\)
The mixed fraction of \(\frac{24}{5}\) is 4 \(\frac{4}{5}\)
\(\frac{3}{5}\) × 8 = 4 \(\frac{4}{5}\)
Question 6.
\(\frac{1}{4}\) × 10 = _____ \(\frac{□}{□}\)
Answer: 2 \(\frac{1}{2}\)
Explanation:
\(\frac{1}{4}\) × 10
2 divides 10 five times.
\(\frac{1}{2}\) × 5 = \(\frac{5}{2}\)
The mixed fraction of \(\frac{5}{2}\) is 2 \(\frac{1}{2}\)
\(\frac{1}{4}\) × 10 = 2 \(\frac{1}{2}\)
Question 9.
\(\frac{1}{5}\) × \(\frac{5}{7}\) = \(\frac{□}{□}\)
Answer: \(\frac{1}{7}\)
Explanation:
\(\frac{1}{5}\) × \(\frac{5}{7}\)
5 in the numerator and 5 in the denominator gets canceled.
= \(\frac{1}{7}\)
Thus \(\frac{1}{5}\) × \(\frac{5}{7}\) = \(\frac{1}{7}\)
Question 10.
\(\frac{3}{8}\) × \(\frac{1}{6}\) = \(\frac{□}{□}\)
Answer: \(\frac{1}{16}\)
Explanation:
\(\frac{3}{8}\) × \(\frac{1}{6}\)
3 divides 6 two times
\(\frac{3}{8}\) × \(\frac{1}{6}\) = \(\frac{1}{8}\) × \(\frac{1}{2}\)
Multiply the denominators.
= \(\frac{1}{16}\)
Thus \(\frac{3}{8}\) × \(\frac{1}{6}\) = \(\frac{1}{16}\)
Complete the statement with equal to, greater than, or less than.
Chapter Review/Test – Page No. 334
Fill in the bubble completely to show your answer.
Question 13.
Wolfgang wants to enlarge a picture he developed. Which factor listed below would scale up (enlarge) his picture the most if he used it to multiply its current dimensions?
Options:
a. \(\frac{7}{8}\)
b. \(\frac{14}{14}\)
c. 1 \(\frac{4}{9}\)
d. \(\frac{3}{2}\)
Answer: 1 \(\frac{4}{9}\)
Explanation:
The greatest fraction among all the fractions is 1 \(\frac{4}{9}\).
1 \(\frac{4}{9}\) is greater than 1.
Thus the correct answer is option C.
Question 14.
Rachel wants to reduce the size of her photo. Which factor listed below would scale down (reduce) the size of her picture the most?
Options:
a. \(\frac{5}{8}\)
b. \(\frac{11}{16}\)
c. 1 \(\frac{3}{4}\)
d. \(\frac{8}{5}\)
Answer: \(\frac{5}{8}\)
Explanation:
Compare to all the fractions \(\frac{5}{8}\) is smaller.
So, Rachel would reduce the size of her picture to \(\frac{5}{8}\)
So, the correct answer is option A.
Question 15.
Marteen wants to paint \(\frac{2}{3}\) of her room today. She wants to paint \(\frac{1}{4}\) of that before lunch. How much of her room will she paint today before lunch?
Options:
a. \(\frac{1}{12}\)
b. \(\frac{1}{6}\)
c. 1 \(\frac{5}{12}\)
d. \(\frac{11}{12}\)
Answer: \(\frac{1}{6}\)
Explanation:
Marteen wants to paint \(\frac{2}{3}\) of her room today.
She wants to paint \(\frac{1}{4}\) of that before lunch.
\(\frac{2}{3}\) × \(\frac{1}{4}\) = \(\frac{1}{6}\)
So, the answer is option B.
Chapter Review/Test – Page No. 335
Fill in the bubble completely to show your answer.
Question 16.
Gia’s bus route to school is 5 \(\frac{1}{2}\) miles. The bus route home is 1 \(\frac{3}{5}\) times as long. How long is Gia’s bus route home?
Options:
a. 5 \(\frac{3}{10}\) miles
b. 8 miles
c. 8 \(\frac{4}{5}\) miles
d. 17 \(\frac{3}{5}\) miles
Answer: 8 \(\frac{4}{5}\) miles
Explanation:
Gia’s bus route to school is 5 \(\frac{1}{2}\) miles. The bus route home is 1 \(\frac{3}{5}\) times as long.
5 \(\frac{1}{2}\) × 1 \(\frac{3}{5}\)
Convert the mixed fractions to improper fractions.
\(\frac{11}{2}\) × \(\frac{8}{5}\) = \(\frac{88}{10}\) = \(\frac{44}{5}\)
The mixed fraction of \(\frac{44}{5}\) is 8 \(\frac{4}{5}\) miles
Therefore the answer is option C.
Question 17.
Carl’s dog weighs 2 \(\frac{1}{3}\) times what Judy’s dog weighs. If Judy’s dog weighs 35 \(\frac{1}{2}\) pounds, how much does Carl’s dog weigh?
Options:
a. 88 \(\frac{3}{4}\) pounds
b. 82 \(\frac{5}{6}\) pounds
c. 81 \(\frac{2}{3}\) pounds
d. 71 pounds
Answer: 82 \(\frac{5}{6}\) pounds
Explanation:
Carl’s dog weighs 2 \(\frac{1}{3}\) times what Judy’s dog weighs.
To find the weigh of Carl’s dog we need to multiply the fractions
2 \(\frac{1}{3}\) and 35 \(\frac{1}{2}\)
\(\frac{7}{3}\) × \(\frac{71}{2}\) = \(\frac{497}{6}\)
The mixed fraction of \(\frac{497}{6}\) is 82 \(\frac{5}{6}\) pounds.
Thus the correct answer is option B.
Question 18.
In a fifth grade class, \(\frac{4}{5}\) of the girls have brown hair. Of the brown-haired girls, \(\frac{3}{5}\) of the girls have long hair. What fraction of the girls in the class have long brown hair?
Options:
a. \(\frac{1}{20}\)
b. \(\frac{1}{5}\)
c. \(\frac{3}{5}\)
d. \(\frac{1}{4}\)
Answer: \(\frac{1}{5}\)
Explanation:
In a fifth grade class, \(\frac{4}{5}\) of the girls have brown hair. Of the brown-haired girls, \(\frac{3}{5}\) of the girls have long hair.
\(\frac{4}{5}\) – \(\frac{3}{5}\) = \(\frac{1}{5}\)
The correct answer is option B.
Chapter Review/Test – Page No. 336
Constructed Response
Question 19.
Tasha plans to tile the floor in her room with square tiles that are \(\frac{1}{4}\) foot long. Will she use more or fewer tiles if she is only able to purchase square tiles that are \(\frac{1}{3}\) foot long? Explain.
_________ tiles
Answer: Fewer
Explanation:
\(\frac{1}{4}\) is less than \(\frac{1}{3}\)
So, Tasha will use fewer tiles if she is only able to purchase square tiles that are \(\frac{1}{3}\) long.
Performance Task
Question 20.
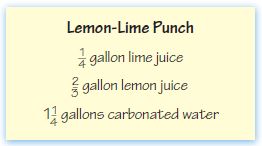
For a bake sale, Violet wants to use the recipe below.
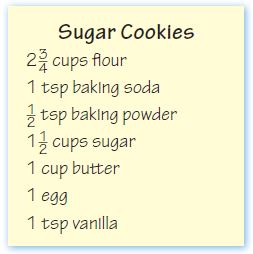
A). If she wants to double the recipe, how much flour will she need?
_____ \(\frac{□}{□}\) cups flour
Answer: 5 \(\frac{1}{2}\) cups flour
Explanation:
To bake the sugar cookies she needs 2 \(\frac{3}{4}\) cups flour.
If she wants to double the recipe, she needs to multiply the 2 \(\frac{3}{4}\) cups flour by 2.
2 \(\frac{3}{4}\) + 2 \(\frac{3}{4}\) = 5 \(\frac{1}{2}\) cups flour
Question 20.
B). Baxter wants to make 1 \(\frac{1}{2}\) times the recipe. Will he need more or less sugar than Violet needs if she doubles the recipe? Explain.
__________ sugar
Answer: less
Explanation:
If violet doubles the recipe he need 2 × 1 \(\frac{1}{2}\) = 3 cups of sugar
Baxter wants to make 1 \(\frac{1}{2}\) times the recipe.
1 \(\frac{1}{2}\) × \(\frac{1}{2}\) = 1 \(\frac{3}{4}\)
Baxter needs less sugar when compared to Violet’s recipe.
Question 20.
C). As shown, the recipe makes 60 cookies. Jorge wants to bring 150 cookies. How much flour will he need to make 150 cookies? Explain how you got your answer. (Hint: what can you multiply 60 by to get 150?)
_____ \(\frac{□}{□}\) cups flour
Answer: 2 \(\frac{1}{2}\) cups flour
Explanation:
The recipe makes 60 cookies. Jorge wants to bring 150 cookies.
Let the amount of flour be x.
60 × x = 150
x = 150/60 = 5/2
The mixed fraction of \(\frac{5}{2}\) is 2 \(\frac{1}{2}\)
Thus, Jorge need 2 \(\frac{1}{2}\) cups flour to make 150 cookies.
Conclusion
Make the most out of the Go Math Answer Key for Grade 5 Ch 7 Multiply Fractions. Our guide on 5th Grade Chapter 7 Multiply Fractions helps you to clarify the concepts related in no time. Keep in touch with our site to avail Go Math Answer Key for different Grades all in one place.


 Options: