Worksheet on Pictograph and Bar Graph consists of different types of questions and answers along with their explanations. All the important concepts such as Interpreting the Data of a Pictograph or Bar Graph, Representing a Pictograph or Bar Graph for the given data, etc. included here. Students can master the concept of Pictograph or Bar Graph with the help of 5th Grade Math Worksheets on Pictograph and Bar Graph.
Therefore, without missing any concept, practice all the problems available in the Printable Pictograph and Bar Graph Worksheet and learn the skills involving reading, drawing, grouping, and many more. Pictograph and Bar Graph Problems available will Reinforce knowledge in analyzing the data under real-life situations and you need not look further anymore.
Also, Check:
Pictograph and Bar Graph Worksheets
Check out all the Problems on Pictographs and also the Problems on Bar Graphs with a clear explanation. We also included images for a better understanding of the studnets.
Example 1.
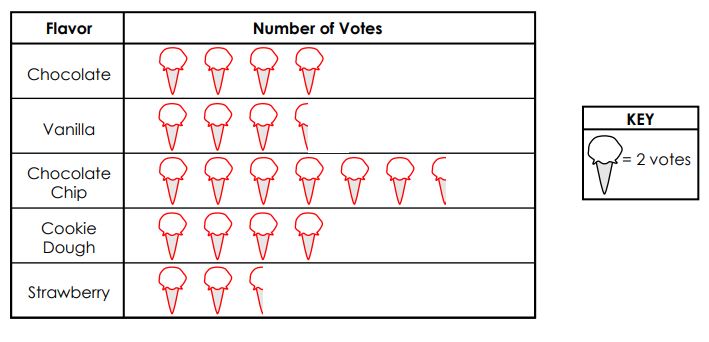
The students are asked to vote for their favorite ice cream flavor. Use the information in the pictograph and answer the questions.
1. How many students voted for the chocolate chips?
2. what flavor did the students like the least?
3. what flavors did the students like the maximum?
4. How many students voted for chocolate chip than strawberry?
5. How many students voted for either chocolate or strawberry?
Solution:
Given that each ice cream flavor = 2 votes.
Therefore, Chocolate = 8 votes
Vanilla = 7 votes
Chocolate chips = 13 votes
Cookie Dough = 8 votes
Strawberry = 5 votes.
1. 13 students voted for chocolate chips.
2. Strawberry flavor students liked the least.
3. Chocolate chip students like the maximum.
4. 8 students voted for chocolate chip than strawberry.
5. 13 students voted for either chocolate or strawberry.
Example 2.
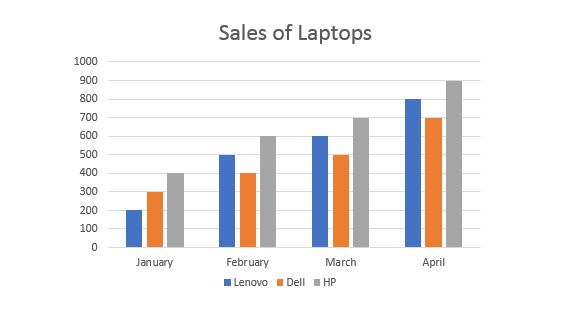
The sales of 3 Laptop company’s in the three consecutive months is represented by the table. Draw a Bar Graph.
| Lenovo | Hp | Dell | |
|---|---|---|---|
| Jan | 200 | 300 | 400 |
| Feb | 500 | 400 | 600 |
| Mar | 600 | 500 | 700 |
| Apr | 800 | 700 | 900 |
Solution:
Given that sales of 3 Laptop company are in the three consecutive months.
Take the months on the x-axis. The sales of 3 Laptop companies are on the y – axis.
Example 3.
The following is the bar graph of the student marks obtained in three subjects.
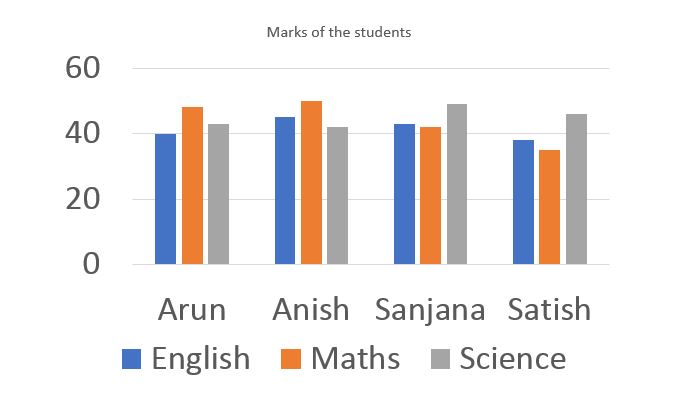
(i) who scored the least marks in English?
(ii) who scored the highest marks in Science?
(iii) who scored the least marks in maths?
Solution:
Given that the bar graph of the student marks obtained in three subjects.
(i) Satish scored the least marks in English.
(ii) Sanjana scored the highest marks in science.
(iii) Satish scored the least marks in maths.
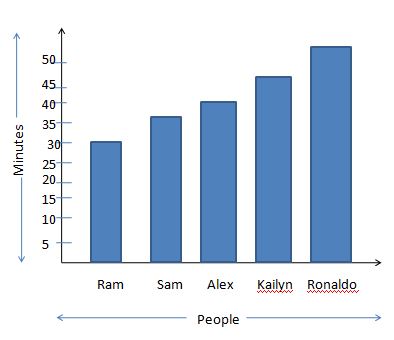
Example 4.
In the examination the time is taken by the five people to solve the question paper is as follows. Represent this information on a bar graph.
| Minutes | 30 | 35 | 40 | 45 | 50 |
|---|---|---|---|---|---|
| People | Ram | Sam | Alex | Kailyn | Ronaldo |
Solution:
Given that in the examination the time is taken by the five people to solve the question paper.
Take the people on the x-axis and time on the y-axis.
Example 5.
How to interpret given data using pictographs. From the given table, the data of 50 students has been collected, who have different colors. The information given was as follows:
| No. of Students | Color |
|---|---|
| 40 | Yellow |
| 30 | Black |
| 20 | Blue |
| 50 | Red |
Solution:
Given that data of 50 students has been collected, who have different colors.
The above table data can be represented as a pictograph as follows:
| Color | No. of Students |
|---|---|
| Yellow | |
| Black | |
| Blue | |
| Red |
where every circle represents 10 students. ![]() represents a circle.
represents a circle.
Example 6.
Verify the below pictograph and interpret the data to answer the below questions. Where every chocolate image represents 3 chocolates.
| Boxes | Number of chocolates |
|---|---|
| Box 1 |  |
| Box 2 | |
| Box 3 | |
| Box 4 | |
(i) Which box had maximum chocolates as per the given data?
(ii) Which box had minimum chocolates as per the given data?
(iii) How many chocolates are more in Box 2 than Box 4?
(iv) Which Box had a maximum number of chocolates? Box 2 or Box 1?
Solution:
Given that a pictograph consists of different boxes with a different number of chocolates in them. Also, given that every chocolate image = 3 chocolates.
Box 1 = 3 chocolate images = 3 × 3 = 9 chocolates
Box 2 = 4 chocolate images = 3 × 4 = 12 chocolates
Box 3 = 5 chocolate images = 3 × 5 = 15 chocolates
Box 4 = 1 chocolate image = 3 × 1 = 3 chocolates
(i) Box 3 had maximum chocolates as per the given data.
(ii) Box 4 had minimum chocolates as per the given data
(iii) Box 2 – Box 4 = 12 chocolates – 3 chocolates = 9 chocolates.
Box 2 has 9 chocolates more than Box 4.
(iv) Box 2 had a maximum number of chocolates compared to Box 1.
Example 7.
If ∎ represents 3 switches and Ψ represents 5 boards, what do the following represent?
(i) ∎Ψ ∎Ψ ∎Ψ
(ii) ∎Ψ∎Ψ ∎Ψ ∎Ψ ∎Ψ ∎
(iii) ∎Ψ ∎Ψ
(iv) ∎Ψ
(v) ∎Ψ ∎Ψ ∎Ψ∎Ψ∎Ψ∎Ψ
(vi) ∎Ψ ∎Ψ ∎Ψ ∎Ψ
(vii) ∎Ψ ∎Ψ ∎Ψ ∎Ψ ∎∎Ψ
(viii) ∎Ψ Ψ Ψ Ψ Ψ Ψ Ψ Ψ Ψ Ψ
Solution:
Given that ∎ represents 3 switches and Ψ represents 5 boards.
∎ = 3 switches; Ψ = 5 boards
(i) ∎Ψ ∎Ψ ∎Ψ
∎∎∎ (three switches) = 3 × 3 switches = 9 switches.
ΨΨΨ (three boards) = 3 × 5 boards = 15 boards.
Therefore, the final answer is 9 switches, 15 boards.
(ii) ∎Ψ∎Ψ ∎Ψ ∎Ψ ∎Ψ ∎
∎∎∎∎∎∎ (six switches) = 6 × 3 switches = 18 switches.
ΨΨΨΨΨ (five boards) = 5 × 5 boards = 25 boards.
Therefore, the final answer is 18 switches, 25 boards.
(iii) ∎Ψ∎Ψ
∎∎ (two switches) = 2 × 3 switches = 6 switches.
ΨΨ (two boards) = 2 × 5 boards = 10 boards.
Therefore, the final answer is 6 switches, 10 boards.
(iv) ∎Ψ
∎ (one switch) = 1 × 3 switches = 3 switches.
Ψ (one boards) = 1 × 5 boards = 5 boards.
Therefore, the final answer is 3 switches, 5 boards.
(v) ∎Ψ ∎Ψ ∎Ψ∎Ψ∎Ψ∎Ψ
∎∎∎∎∎∎ (six switches) = 6 × 3 switches = 18 switches.
ΨΨΨΨΨΨ (six boards) = 6 × 5 boards = 30 boards.
Therefore, the final answer is 18 switches, 30 boards.
(vi) ∎Ψ ∎Ψ ∎Ψ ∎Ψ
∎∎∎∎ (four switches) = 4 × 3 switches = 12 switches.
ΨΨΨΨ (four boards) = 4 × 5 boards = 20 boards.
Therefore, the final answer is 12 switches, 20 boards.
(vii) ∎Ψ ∎Ψ ∎Ψ ∎Ψ ∎∎Ψ
∎∎∎∎∎∎ (six switches) = 6 × 3 switches = 18 switches.
ΨΨΨΨΨ (five boards) = 5 × 5 boards = 25 boards.
Therefore, the final answer is 18 switches, 25 boards.
(viii) ∎Ψ Ψ Ψ Ψ Ψ Ψ Ψ Ψ Ψ Ψ
∎ (one switch) = 1 × 3 switches = 3 switches.
ΨΨΨΨΨΨΨΨΨΨ (ten boards) = 10 × 5 boards = 50 boards.
Therefore, the final answer is 3 switches, 50 boards.
Example 8.
Observe the bar graph representing the number of toys sold in January month on different days of a week and answer the following.
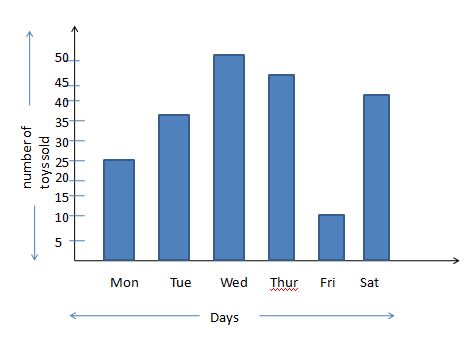
(i) On which day were the maximum toys sold and how many?
(ii) On which day were the minimum toys sold and how many?
(iii) On which day were 25 toys sold?
(iv) How many maximum toys were sold on Tuesday then Friday?
Solution:
Given that the bar graph representing the number of toys sold in January month on different days of a week.
(i) On Wednesday, the maximum number of toys sold. 50 toys are sold on Wednesday.
(ii) On Friday, the minimum number of toys sold. 10 toys are sold on Friday.
(iii) On Tuesday, 25 toys were sold.
(iv) Tuesday = 25 toys were sold
Friday = 10 toys were sold
25 – 10 = 15 toys.
Therefore, 15 more toys were sold on Tuesday than Friday.
Example 9.
A bookseller sold 30 books on Monday, on Tuesday 40 books, on Wednesday 20 books, on Thursday 70 books, on Friday 50 books, and on Saturday 600 books. Draw a pictograph for the books sold during the week.
Solution:
Given that a bookseller sold 30 books on Monday, on Tuesday 40 books, on Wednesday 20 books, on Thursday 70 books, on Friday 50 books, and on Saturday 60 books.
| Days | Books Sold |
|---|---|
| Monday | |
| Tuesday | |
| Wednesday | |
| Thursday | |
| Friday | |
| Saturday |
Here every book is equal to 10 books.![]() = 10 books.
= 10 books.
Monday = 30 books = 3 books.
Tuesday = 40 books = 4 books.
Wednesday = 20 books = 2 books.
Thursday = 70 books = 7 books.
Friday = 50 books = 5 books.
Saturday = 60 books = 6 books.
Example 10.
If ⊗ represents 2 chairs, what do the following represent?
(i) ⊗⊗
(ii) ⊗⊗⊗⊗⊗
(iii) ⊗⊗⊗
(iv) ⊗⊗⊗⊗⊗⊗⊗
(v) ⊗⊗⊗⊗
(vi) ⊗⊗⊗⊗⊗⊗⊗⊗⊗
(vii) ⊗⊗⊗⊗⊗⊗⊗⊗⊗⊗⊗⊗
Solution:
Given that ⊗ represents 2 chairs.
(i) ⊗⊗
⊗⊗ (two cross circles) = 2 × 2 chairs = 4 chairs.
Therefore, the answer is 4 chairs.
(ii) ⊗⊗⊗⊗⊗
⊗⊗⊗⊗⊗ (five cross circles) = 5 × 2 chairs = 10 chairs.
Therefore, the answer is 10 chairs.
(iii) ⊗⊗⊗
⊗⊗⊗ (three cross circles) = 3 × 2 chairs = 6 chairs.
Therefore, the answer is 6 chairs.
(iv) ⊗⊗⊗⊗⊗⊗⊗
⊗⊗⊗⊗⊗⊗⊗ (seven cross circles) = 7 × 2 chairs = 14 chairs.
Therefore, the answer is 14 chairs.
(v) ⊗⊗⊗⊗
⊗⊗⊗⊗ (four cross circles) = 4 × 2 chairs = 8 chairs.
Therefore, the answer is 8 chairs.
(vi) ⊗⊗⊗⊗⊗⊗⊗⊗⊗
⊗⊗⊗⊗⊗⊗⊗⊗⊗ (nine cross circles) = 9 × 2 chairs = 18 chairs.
Therefore, the answer is 18 chairs.
(vii) ⊗⊗⊗⊗⊗⊗⊗⊗⊗⊗⊗⊗
⊗⊗⊗⊗⊗⊗⊗⊗⊗⊗⊗⊗ (twelve cross circles) = 12 × 2 chairs = 24 chairs.
Therefore, the answer is 24 chairs.