Finding ways on how to teach your kids about the Representation of Tabular Data? If so, you have landed on the right page and where you can get a bundle of Tabular Presentation of Data Activity Worksheets that challenge your kids to do their best. In fact, they can understand how to represent data using tables when a large number of data is present. Ready to use Math Worksheets on Presentation of Data using Tables are free to print and are tailored as per your Curriculum Standards.
See More:
Representing Data Using Table Worksheets
Example 1.
The following table shows the number of glass paintings, oil paintings, and acrylic paintings sold in the three days of the exhibition.
| Days | Glass Paintings | Oil Paintings | Acrylic Paintings |
|---|---|---|---|
| 1 | 25 | 15 | 10 |
| 2 | 30 | 23 | 40 |
| 3 | 18 | 35 | 30 |
1. Total no. of all paintings were sold on the first day of the exhibition?
2. Find the total no. of glass paintings sold in the three days?
3. On the second day of the exhibition, which paintings sold the maximum?
4. which paintings are sold minimum on the third day?
5. On the first day, which paintings are sold maximum?
Solution:
1. Total no. of all paintings were sold on the first day of the exhibition is 25+15+10=50.
2. The total no. of glass paintings sold in the three days is 25+30+18=73.
3. Acrylic paintings are maximum sold on the second day.
4. glass paintings are sold minimum on the third day.
5. glass paintings are sold maximum on the first day.
Example 2.
The following table shows the number of cars manufactured by the company and company B in 4 years.
| Years | Company A | Company B |
|---|---|---|
| 1 | 200 | 150 |
| 2 | 250 | 280 |
| 3 | 300 | 300 |
| 4 | 350 | 400 |
1. How many cars were manufactured by both the companies in the 4th year?
2. In which year are the cars manufactured by both the companies are same?
3. which company manufactured fewer cars in the 2nd year?
4. How many no. of cars were manufactured by company b in all the 4 years?
5. which of the following statement is true?
a. In the first two years, company A manufactured more cars than company B?
b. In the first two years, company A manufactured fewer cars than company B?
Solution:
1. The no. of cars manufactured by both the companies in the 4th year is 750.
2. In the third year, the cars manufactured by both companies are the same.
3. Company A manufactured fewer cars in the 2nd year.
4. no. of cars were manufactured by company b in all the 4 years is 1130.
5. a is true
Example 3.
The data on the age of students selected for singing in the contest is arranged in the tabular form?
| Age | 4-6 | 7-9 | 10-12 | 13-15 | 16-18 |
|---|---|---|---|---|---|
| No. of people | 5 | 15 | 35 | 48 | 58 |
1. No. of people selected for the singing competition in the age group 4-6?
2. No. of people selected for the singing competition in the age group 10-12?
3. Fid the no. of people selected for the singing competition in the age group 10-12 than 7-9?
4. which age group is selected maximum in the singing competition?
5. which age group is selected minimum in the singing competition?
Solution:
1. No. of people selected for the singing competition in the age group 4-6 is 5.
2. No. of people selected for the singing competition in the age group, 10-12 is 35.
3. Total no. of people selected for the singing competition in the age group 10-12 than 7-9 is 35-15=20.
4. 16-18 age group is selected maximum in the singing competition.
5. 4-6 age group is selected minimum in the singing competition.
Example 4.
| Name | Age | Qualification | Salary | Hobbies |
|---|---|---|---|---|
| Anil | 24 | BTech | 35000 | Cricket |
| Vijay | 28 | BSC | 40000 | Singing |
| Harsha | 24 | MBA | 25000 | Dancing |
| Sunil | 32 | MCA | 100000 | Cricket |
| Ranjith | 30 | MCA | 70000 | cricket |
| Sudheer | 30 | BTech | 60000 | Singing |
1. Find out how many persons have age more than 29 and whose salary is more than 50,000?
2. How many persons have age below 30 and salary less than 38000?
3. How many persons studied BTech?
4. How many persons have cricket as a hobby?
5. Name the persons who have singing as a hobby?
Solution:
1. Three persons Sunil, Ranjith, and Sudheer have an age of more than 29 and a salary is more than 50,000.
2. Three persons named Anil, Vijay, and Harsha have ages below 30 and salaries less than 38000.
3. Two persons Anil and Sudheer studied BTech.
4. Three persons Anil, Sunil, and Ranjith have cricket as a hobby.
5.Vijay and Sudheer have singing as a hobby.
Practice Math Online with Unlimited Questions provided in 5th Grade Math Activity Sheets and become a blossoming mathematician in no time.
Example 5.
Following are the marks obtained by the 40 students in Science. Arrange the data in increasing order and Represent it in the table using the tally form to show how many students have a given number of marks?
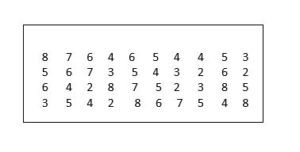
1. How many students obtained more than 7 marks?
2. How many students obtained 5 marks?
3. How many students obtained 8 marks?
Solution:
1. No. of students obtained more than 7 marks are 5.
2. No. of students obtained 5 marks are 8.
3. No. of students obtained 8 marks are 5.
Example 6.
Jaya counted the different coloured dresses that she has in the cupboard with the following results:
Red, Black, Green, Red, White, Blue, Yellow, Red, Blue, White
Make a tally of Jaya’s results.
1. How many Red dresses does she has?
2. How many white dresses does Jaya have?
3. How many yellow dresses does Jaya have?
Solution:

1. No.of red dresses Jaya has are 3 dresses.
2. No. of white dresses Jaya has are 2 dresses.
3. No. of yellow dresses Jaya has are 1 dress.
Example 7.
Following are the different colour cars sold in the showroom in a week. Arrange the data in increasing order and Represent it in the table using the tally form to show how many cars have sold?
Black, Red, Black, Yellow, White, Red, White, Blue, Black, Red, Red, green, White, Blue, Black
1. How many Red colour cars are sold?
2. How many blue colour cars are sold?
3. How many white colour cars are sold?
Solution:

1. Four red colour cars are sold.
2. Two blue colour cars are sold.
3. Three white colour cars are sold.
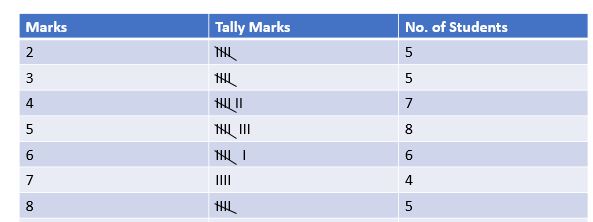
Example 8.
Following are the different flavour ice creams sold in the evenings. Use the information from the tally chart to answer the questions.
1. How many vanilla ice creams are sold?
2. How many Butterscotch ice creams are sold?
3. How many chocolate ice creams are sold?
Solution:
1. Four vanilla ice creams are sold.
2. Eight butterscotch ice creams are sold.
3. Nine Chocolate icecreams are sold.
Example 9.
Following are the items sold in the bakery. Use the information from the tally chart to answer the question.
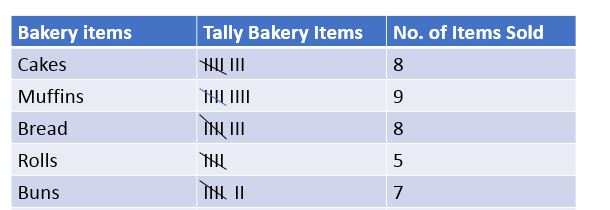
1. How many Rolls are sold in the bakery?
2. How many Buns are sold in the bakery?
3. How many muffins are sold in the bakery?
Solution:
1. 5 rolls are sold in the bakery.
2. 7 buns are sold in the bakery.
3. 9 muffins are sold in the bakery.
Example 10.
Following is the data of boys and girls in the class. Using this information answer the questions?
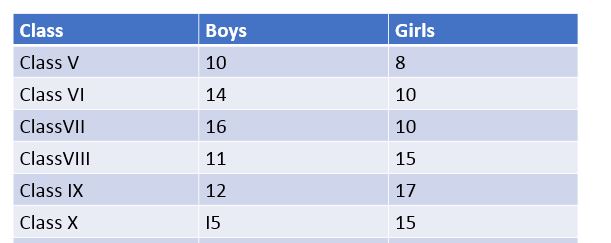
1. How many girls are there in class X?
2. How many boys are there in class V?
3. How many students are there in class VII?
Solution:
1. There are 15 girls in class X.
2. There are 10 boys in class V.
3. There are 16 boys+10 girls=26 students in class VII.