Worksheet on Representing Data on Bar Graph has extensive problems along with detailed explanations and images. The numerous model questions on represent data by a bar graph will let you understand the concept in detail. Don’t skip a single question while practicing Bar Graph topics. 4th Grade Math Students can also check out the answers to every question available in this article.
Download Representing Data on Bar Graph Worksheet for free of cost and learn all the concepts offline. Test your knowledge by practicing from these Bar Graph Worksheets.
See More:
- Interpreting Bar Graph
- Represent Data on a Bar Graph
- Construction of Bar Graphs
Bar Graph Examples with Questions and Answers PDF
Example 1:
A survey has taken for 120 students to know their favorite color?
| Color | Green | Blue | Red | Black | Yellow |
|---|---|---|---|---|---|
| Students | 40 | 20 | 10 | 30 | 20 |
Construct a vertical bar chart for the given table.
(i) Which color is the most liked by the students?
(ii) Which color is the less liked by the students?
Solution:
The given details are regarding the survey on 120 students to know their favorite color.
The color is taking on the X-axis and the number of students on the Y-axis. Therefore, the vertical bar chart for the given table is like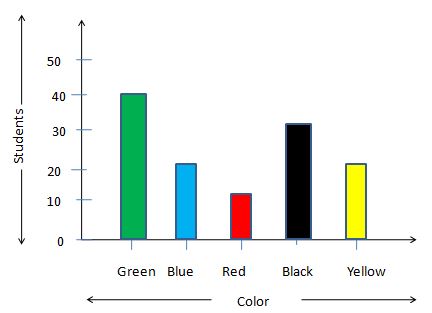
(i) Green color is the most liked by the students.
(ii) Red color is the most liked by the students.
Example 2:
If ⊗ represents 3 apples, what do the following represent?
(i) ⊗⊗⊗
(ii) ⊗⊗⊗⊗⊗⊗⊗
(iii) ⊗⊗⊗⊗
(iv) ⊗⊗⊗⊗⊗⊗
(v) ⊗⊗⊗⊗⊗⊗⊗⊗⊗
(vi) ⊗⊗⊗⊗⊗
(vii) ⊗⊗⊗⊗⊗⊗⊗⊗
Solution:
Given ⊗ represents 3 apples.
(i) ⊗⊗⊗
⊗ (one cross circle) = 3 apples
⊗⊗⊗ (three cross circles) = 3 × 3 apples = 9 apples.
Therefore, the answer is 9 apples.
(ii) ⊗⊗⊗⊗⊗⊗⊗⊗ (one cross circle) = 3 apples
⊗⊗⊗⊗⊗⊗⊗ (seven cross circles) = 7 × 3 apples = 21 applesTherefore, the answer is 21 apples.(iii) ⊗⊗⊗⊗
⊗ (one cross circle) = 3 apples
⊗⊗⊗⊗ (four cross circles) = 4 × 3 apples = 12 applesTherefore, the answer is 12 apples.(iv) ⊗⊗⊗⊗⊗⊗
⊗ (one cross circle) = 3 apples
⊗⊗⊗⊗⊗⊗ (six cross circles) = 6 × 3 apples = 18 applesTherefore, the answer is 18 apples.(v) ⊗⊗⊗⊗⊗⊗⊗⊗⊗
⊗ (one cross circle) = 3 apples
⊗⊗⊗⊗⊗⊗⊗⊗⊗ (nine cross circles) = 9 × 3 apples = 27 apples
Therefore, the answer is 27 apples.
(vi) ⊗⊗⊗⊗⊗
⊗ (one cross circle) = 3 apples
⊗⊗⊗⊗⊗ (five cross circles) = 5 × 3 apples = 15 apples
Therefore, the answer is 15 apples.
(vii) ⊗⊗⊗⊗⊗⊗⊗⊗
⊗ (one cross circle) = 3 apples
⊗⊗⊗⊗⊗⊗⊗⊗ (eight cross circles) = 8 × 3 apples = 24 apples
Therefore, the final answer is 24 apples.
Example 3:
The number of car toys manufactured by a factory during five consecutive weeks is given below.
| Week | First | Second | Third | Fourth | Fifth |
|---|---|---|---|---|---|
| Number of Car Toys | 50 | 150 | 100 | 50 | 200 |
Draw a horizontal bar chart for the given table.
(a) On which week the maximum Car Toys were made?
(b) How many Car Toys were made in the Second Week?
Solution:
Given that the number of car toys manufactured by a factory during five consecutive weeks. The horizontal bar graph for the given information is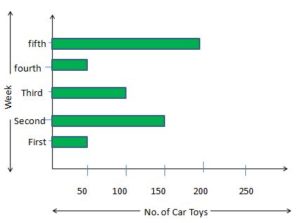 (a) On the fifth week the maximum Car Toys were made.
(b) 150 Car Toys were made in the Second Week.
Example 4:
Observe the given bar graph, representing the number of saplings planted by a different number of members in a locality, and answer the following equations.
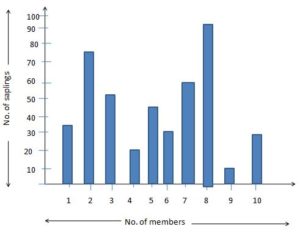
(i) Write the number of saplings planted by 7 members.
(ii) How many saplings are planted with the maximum number of members?
(iii) How many saplings are planted with the minimum number of members?
(iv) How many saplings are planted by 2 members?
Solution:
Given that the number of saplings planted by a different number of members in a locality. The bar graph consists of no. of members on the x-axis and no. of saplings on the y-axis.
(i) 55 number of saplings planted by 7 members.
(ii) 30 saplings are planted with the maximum number of members.
(iii) 35 saplings are planted with the minimum number of members.
(iv) 75 saplings are planted by 2 members.
Example 5:
If ∎ represents 5 pens and Ψ represents 2 pencils, what do the following represent?
(i) ∎Ψ ∎Ψ
(ii) ∎Ψ
(iii) ∎Ψ ∎Ψ ∎Ψ ∎Ψ
(iv) ∎Ψ ∎Ψ ∎Ψ ∎Ψ ∎Ψ
(v) ∎Ψ ∎Ψ ∎Ψ
(vi) ∎Ψ ∎Ψ ∎Ψ ∎Ψ ∎Ψ ∎Ψ
(vii) ∎Ψ ∎Ψ ∎Ψ ∎Ψ ∎Ψ ∎Ψ ∎Ψ ∎Ψ
(viii) ∎Ψ ∎Ψ ∎Ψ ∎Ψ ∎Ψ ∎Ψ ∎Ψ ∎Ψ ∎Ψ ∎Ψ
Solution:
Given ∎ represents 5 pens and Ψ represents 2 pencils
∎ = 5 pens; Ψ = 2 pencils
(i) ∎Ψ ∎Ψ
∎∎ (2 boxes ) = 2 × 5 pens = 10 pens
ΨΨ (2 symbols) = 2 × 2 pencils = 4 pencilsTherefore, the final answer is 10 pens, 4 pencils.(ii) ∎Ψ
∎ (one box ) = 1 × 5 pens = 5 pens
Ψ (one symbol) = 1 × 2 pencils = 2 pencilsTherefore, the final answer is 5 pens, 2 pencils.(iii) ∎Ψ ∎Ψ ∎Ψ ∎Ψ
∎∎∎∎ (four boxes) = 4 × 5 pens = 20 pens
ΨΨΨΨΨ (four symbols) = 4 × 2 pencils = 8 pencilsTherefore, the final answer is 20 pens, 8 pencils.(iv) ∎Ψ ∎Ψ ∎Ψ ∎Ψ ∎Ψ
∎∎∎∎∎ (five boxes) = 5 × 5 pens = 25 pens
ΨΨΨΨΨΨ (five symbols) = 5 × 2 pencils = 10 pencilsTherefore, the final answer is 25 pens, 10 pencils.
(v) ∎Ψ ∎Ψ ∎Ψ
∎∎∎ (three boxes) = 3 × 5 pens = 15 pens
ΨΨΨ (three symbols) = 3 × 2 pencils = 6 pencils
Therefore, the final answer is 15 pens, 6 pencils.
(vi) ∎Ψ ∎Ψ ∎Ψ ∎Ψ ∎Ψ ∎Ψ
∎∎∎∎∎∎ (six boxes) = 6 × 5 pens = 30 pens
ΨΨΨΨΨΨ (six symbols) = 6 × 2 pencils = 12 pencils
Therefore, the final answer is 30 pens, 12 pencils.
(vii) ∎Ψ ∎Ψ ∎Ψ ∎Ψ ∎Ψ ∎Ψ ∎Ψ ∎Ψ
∎∎∎∎∎∎∎∎ (eight boxes) = 8 × 5 pens = 40 pens
ΨΨΨΨΨΨΨΨ (eight symbols) = 8 × 2 pencils = 16 pencils
Therefore, the final answer is 30 pens, 12 pencils.
(viii) ∎Ψ ∎Ψ ∎Ψ ∎Ψ ∎Ψ ∎Ψ ∎Ψ ∎Ψ ∎Ψ ∎Ψ
∎∎∎∎∎∎∎∎∎∎ (ten boxes) = 10 × 5 pens = 50 pens
ΨΨΨΨΨΨΨΨΨΨ (ten symbols) = 10 × 2 pencils = 20 pencils
Therefore, the final answer is 50 pens, 20 pencils.
Example 6:
The following table shows student marks in two tests.
| Student | Test 1 | Test 2 |
|---|---|---|
| Sam | 65 | 55 |
| Alex | 47 | 32 |
| Reyna | 80 | 78 |
| James | 35 | 31 |
| Robert | 53 | 64 |
Construct a double bar chart for the given table.
Solution:
From the given information, Test 1 represents the first group and Test 2 represents the second group. Let’s take the student names on the x-axis and their test results on the y-axis.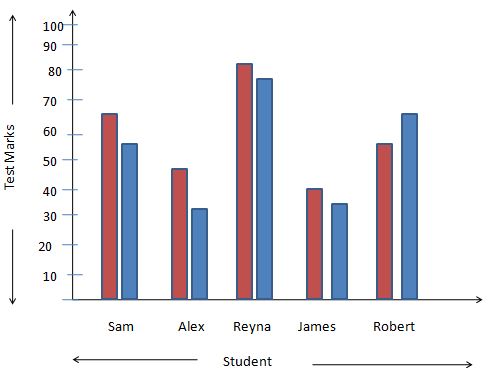
Example 7: Observe the bar graph representing the number of machines sold in April month on different days of a week and answer the following.
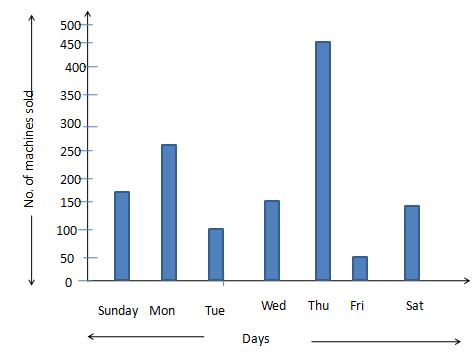
(i) On which day were the maximum machines sold and how many?
(ii) On which day were the minimum machines sold and how many?
(iii) On which day were 250 tickets sold?
(iv) On which day were the equal number of tickets sold and how many?
Solution:
Given that a bar graph representing the number of machines sold in April month on different days of a week.
(i) On Thursday, the maximum machines are sold. 450 machines are sold on Thursday.
(ii) On Thursday, the minimum machines are sold. 50 machines are sold on Thursday.
(iii) On Monday, 250 tickets were sold.
(iv) On Wednesday and Saturday, there was an equal number of machines sold. The number of machines sold is 150.