Engage NY Eureka Math 5th Grade Module 4 Lesson 1 Answer Key
Eureka Math Grade 5 Module 4 Lesson 1 Problem Set Answer Key
Question 1.
Estimate the length of your pencil to the nearest inch. ______________
Answer:
6 inch
Explanation:
The length of the pencil to the nearest inch is 6.
Question 2.
Using a ruler, measure your pencil strip to the nearest \(\frac{1}{2}\) inch, and mark the measurement with an X above the ruler below. Construct a line plot of your classmates’ pencil measurements.

Answer:
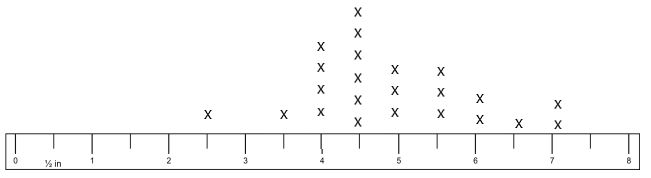
Explanation:
By using a ruler, I have measured the pencil strip to the nearest inch and marked the measurement with an X above the ruler.
Question 3.
Using a ruler, measure your pencil strip to the nearest \(\frac{1}{4}\) inch, and mark the measurement with an X above the ruler below. Construct a line plot of your classmates’ pencil measurements.

Answer:
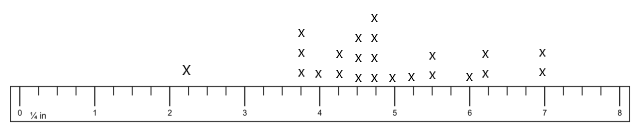
Explanation:
By using a ruler, I have measured the pencil strip to the nearest inch and marked the measurement with an X above the ruler.
Question 4.
Using a ruler, measure your pencil strip to the nearest \(\frac{1}{8}\) inch, and mark the measurement with an X above the ruler below. Construct a line plot of your classmates’ pencil measurements.

Answer:
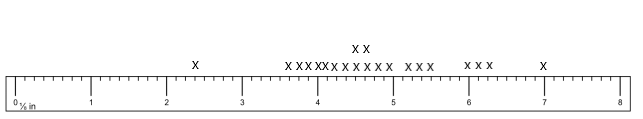
Explanation:
By using a ruler, I have measured the pencil strip to the nearest inch and marked the measurement with an X above the ruler.
Question 5.
Use all three of your line plots to complete the following:
a. Compare the three plots, and write one sentence that describes how the plots are alike and one sentence that describes how they are different.
Answer:
All the 3 line plots are similar because they all show that the majority of the pencil lengths were between 4 and 5 1/2 inches. The 3rd line plot looks different from the others because there’s usually only 1 pencil per measurement, except for 4 5/8 and 4 3/4 in.
b. What is the difference between the measurements of the longest and shortest pencils on each of the three-line plots?
Answer:
Line Plot 1: 7 in – 2 1/2 in = 4 1/2 in.
Line Plot 2: 7 in – 2 1/4 in = 4 3/4 in.
Line Plot 3: 7 in – 2 3/8 in = 4 5/8 in.
Explanation:
The difference between the measurements of the longest and shortest pencils on each of the three-line plots are
Line Plot 1: 7 in – 2 1/2 in = 4 1/2 in, Line Plot 2: 7 in – 2 1/4 in = 4 3/4 in, Line Plot 3: 7 in – 2 3/8 in = 4 5/8 in.
c. Write a sentence describing how you could create a more precise ruler to measure your pencil strip.
Answer:
The most precise ruler we’ve used so far had us measure to the nearest 1/8 inch. We could divide each 1/8 into 2 equal parts as a measure to the nearest 1/16 inch.
Explanation:
I have written a sentence describing how we could create a more precise ruler for measuring the pencil strip.
Eureka Math Grade 5 Module 4 Lesson 1 Exit Ticket Answer Key
Question 1.
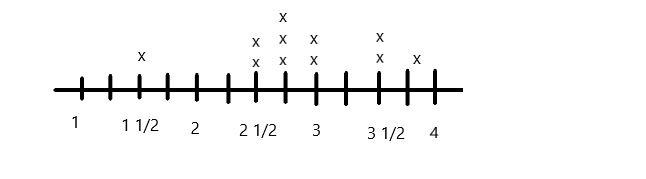
Draw a line plot for the following data measured in inches:
1\(\frac{1}{2}\), 2\(\frac{3}{4}\), 3, 2\(\frac{3}{4}\), 3\(\frac{3}{4}\), 3, 3\(\frac{1}{2}\), 2\(\frac{1}{2}\), 3\(\frac{1}{2}\)
Answer:
Explanation:
I have drawn a line plot with the following data given which are measured in inches.
Question 2.
Explain how you decided to divide your wholes into fractional parts and how you decided where your number scale should begin and end.
Eureka Math Grade 5 Module 4 Lesson 1 Homework Answer Key
A meteorologist set up rain gauges at various locations around a city and recorded the rainfall amounts in the table below. Use the data in the table to create a line plot using \(\frac{1}{8}\) inches.
![]()
|
Location |
Rainfall Amount (inches) |
| 1 | \(\frac{1}{8}\) |
| 2 | \(\frac{3}{8}\) |
| 3 | \(\frac{3}{4}\) |
| 4 | \(\frac{3}{4}\) |
| 5 | \(\frac{1}{4}\) |
| 6 | 1\(\frac{1}{4}\) |
| 7 | \(\frac{1}{8}\) |
| 8 | \(\frac{1}{4}\) |
| 9 | 1 |
| 10 | \(\frac{1}{8}\) |
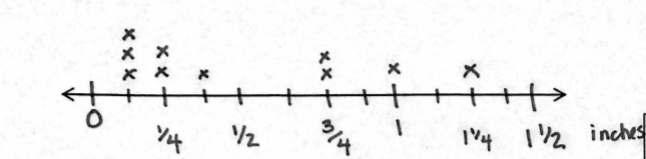
a. Which location received the most rainfall?
Answer:
Location 6
Explanation:
Location 6 has received the most rainfall.
b. Which location received the least rainfall?
Answer:
Location 1, 7, 10
Explanation:
Location 1,7,10 has received the least rainfall.
c. Which rainfall measurement was the most frequent?
Answer:
1/8 inch
Explanation:
The most frequent rainfall measurement was 1/8 inch.
d. What is the total rainfall in inches?
Answer:
5 Inches.
Explanation:
5 inches is the total rainfall and I have given the explanation below.
1/8 + 3/8 + 3/4 + 3/4 + 1/4 + 1 1/4 + 1/8 + 1/4 + 1 + 1/8
4/8 + 6/4 + 1 2/4 + 1/4 + 1 2/8
1 6/8 + 1 9/4
2 3/4 + 9/4
2 12/4
5 inches.