Engage NY Eureka Math 7th Grade Module 5 Lesson 12 Answer Key
Eureka Math Grade 7 Module 5 Lesson 12 Exercise Answer Key
Exercises 1–2
Exercise 1.
If the equally likely model was correct, about how many of each outcome would you expect to see if the cube is rolled 500 times?
Answer:
If the equally likely model was correct, you would expect to see each outcome occur about 83 times.
Exercise 2.
Based on the data from the 500 rolls, how often were odd numbers observed? How often were even numbers observed?
Answer:
Odd numbers were observed 228 times. Even numbers were observed 272 times.
Exercise 3.
Collect data for Sylvia. Carry out the experiment of shaking a cup that contains four balls, two black and two white, observing, and recording whether the pattern is opposite or adjacent. Repeat this process 20 times. Then, combine the data with those collected by your classmates.
Do your results agree with Philippe’s equally likely model, or do they indicate that Sylvia had the right idea? Explain.
Answer:
Answers will vary; estimated probabilities of around \(\frac{1}{3}\) for the opposite pattern and \(\frac{2}{3}\) for the adjacent pattern emerge, casting serious doubt on the equally likely model.
Exercises 4–5
There are three popular brands of mixed nuts. Your teacher loves cashews, and in his experience of having purchased these brands, he suggests that not all brands have the same percentage of cashews. One has around 20% cashews, one has 25%, and one has 35%.
Your teacher has bags labeled A, B, and C representing the three brands. The bags contain red beads representing cashews and brown beads representing other types of nuts. One bag contains 20% red beads, another 25% red beads, and the third has 35% red beads. You are to determine which bag contains which percentage of cashews. You cannot just open the bags and count the beads.
Exercise 4.
Work as a class to design a simulation. You need to agree on what an outcome is, what a trial is, what a success is, and how to calculate the estimated probability of getting a cashew. Base your estimate on 50 trials.
Answer:
An outcome is the result of choosing one bead from the given bag.
A red bead represents a cashew; a brown bead represents a non-cashew.
In this problem, a trial consists of one outcome.
A success is observing a red bead. Beads are replaced between trials. 50 trials are to be done.
The estimated probability of selecting a cashew from the given bag is the number of successes divided by 50.
Exercise 5.
Your teacher will give your group one of the bags labeled A, B, or C. Using your plan from part (a), collect your data. Do you think you have the 20%, 25%, or 35% cashews bag? Explain.
Answer:
Once estimates have been computed, have the class try to decide which percentage is in which bag. Agreeing on the 35% bag may be the easiest, but there could be disagreement concerning the 20% and 25%. If they cannot decide, ask them what they should do. Hopefully, they say that they need more data. Typically, about 500 data points in a simulation yields estimated probabilities fairly close to the theoretical ones.
Exercises 6–8
Suppose you have two bags, A and B, in which there are an equal number of slips of paper. Positive numbers are written on the slips. The numbers are not known, but they are whole numbers between 1 and 75, inclusive. The same number may occur on more than one slip of paper in a bag.
These bags are used to play a game. In this game, you choose one of the bags and then choose one slip from that bag. If you choose Bag A and the number you choose from it is a prime number, then you win. If you choose Bag B and the number you choose from it is a power of 2, you win. Which bag should you choose?
Exercise 6.
Emma suggests that it does not matter which bag you choose because you do not know anything about what numbers are inside the bags. So, she thinks that you are equally likely to win with either bag. Do you agree with her? Explain.
Answer:
Without any data, Emma is right. You may as well toss a coin to determine which bag to choose. However, gathering information through empirical evidence helps in making an informed decision
Exercise 7.
Aamir suggests that he would like to collect some data from both bags before making a decision about whether or not the model is equally likely. Help Aamir by drawing 50 slips from each bag, being sure to replace each one before choosing again. Each time you draw a slip, record whether it would have been a winner or not. Using the results, what is your estimate for the probability of drawing a prime number from Bag A and drawing a power of 2 from Bag B?
Answer:
Answers will vary.
Exercise 8.
If you were to play this game, which bag would you choose? Explain why you would pick this bag.
Answer:
Answers will vary.
Eureka Math Grade 7 Module 5 Lesson 12 Problem Set Answer Key
Question 1.
Some M&M’s® are “defective.” For example, a defective M&M® may have its M missing, or it may be cracked, broken, or oddly shaped. Is the probability of getting a defective M&M® higher for peanut M&M’s® than for plain M&M’s®?
Gloriann suggests the probability of getting a defective plain M&M® is the same as the probability of getting a defective peanut M&M®. Suzanne does not think this is correct because a peanut M&M® is bigger than a plain M&M®, and therefore has a greater opportunity to be damaged.
a. Simulate inspecting a plain M&M® by rolling two number cubes. Let a sum of 7 or 11 represent a defective plain M&M® and the other possible rolls represent a plain M&M® that is not defective. Do 50 trials, and compute an estimate of the probability that a plain M&M® is defective. Record the 50 outcomes you observed. Explain your process.
b. Simulate inspecting a peanut M&M® by selecting a card from a well-shuffled deck of cards. Let a one-eyed face card and clubs represent a defective peanut M&M® and the other cards represent a peanut M&M® that is not defective. Be sure to replace the chosen card after each trial and to shuffle the deck well before choosing the next card. Note that the one-eyed face cards are the king of diamonds, jack of hearts, and jack of spades. Do 20 trials, and compute an estimate of the probability that a peanut M&M® is defective. Record the list of 20 cards that you observed. Explain your process.
c. For this problem, suppose that the two simulations provide accurate estimates of the probability of a defective M&M® for plain and peanut M&M’s®. Compare your two probability estimates, and decide whether Gloriann’s belief is reasonable that the defective probability is the same for both types of M&M’s®. Explain your reasoning.
Answer:
a. A simulated outcome for a plain M&M® involves rolling two number cubes. A trial is the same as an outcome in this problem. A success is getting a sum of 7 or 11, either of which represents a defective plain M&M®. 50 trials should produce somewhere around 11 successes. A side note is that the theoretical probability of getting a sum of 7 or 11 is \(\frac{8}{36}\), or \(0 . \overline{2}\).
b. A simulated outcome for a peanut M&M® involves choosing one card from a deck. A trial is the same as an outcome in this problem. A success is getting a one-eyed face card or a club, any of which represents a defective peanut M&M®. 20 trials of choosing cards with replacement should produce somewhere around six successes.
c. Estimates will vary; the probability estimate for finding a defective plain M&M® is approximately 0.22, and the probability estimate for finding a defective peanut M&M® is about 0.30. Gloriann could possibly be right, as it appears more likely to find a defective peanut M&M® than a plain one, based on the higher probability estimate.
Question 2.
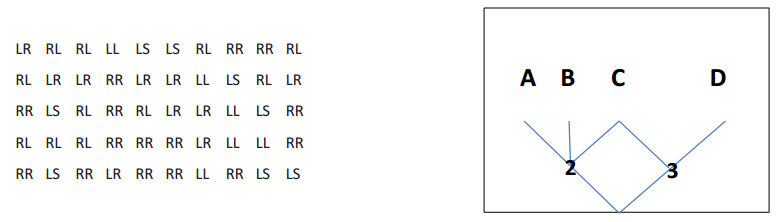
One at a time, mice are placed at the start of the maze shown below. There are four terminal stations at A, B, C, and D. At each point where a mouse has to decide in which direction to go, assume that it is equally likely for it to choose any of the possible directions. A mouse cannot go backward.
In the following simulated trials, L stands for left, R for right, and S for straight. Estimate the probability that a mouse finds station C where the food is. No food is at A, B, or D. The following data were collected on 50 simulated paths that the mice took.
a. What paths constitute a success, and what paths constitute a failure?
b. Use the data to estimate the probability that a mouse finds food. Show your calculation.
c. Paige suggests that it is equally likely that a mouse gets to any of the four terminal stations. What does your simulation suggest about whether her equally likely model is believable? If it is not believable, what do your data suggest is a more believable model?
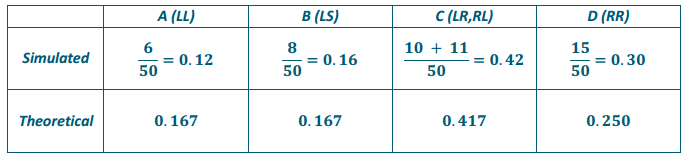
d. Does your simulation support the following theoretical probability model? Explain.
i) The probability a mouse finds terminal point A is 0.167.
ii) The probability a mouse finds terminal point B is 0.167.
iii) The probability a mouse finds terminal point C is 0.417.
iv) The probability a mouse finds terminal point D is 0.250.
Answer:
a. An outcome is the direction chosen by the mouse when it has to make a decision. A trial consists of a path (two outcomes) that leads to a terminal station. The paths are LL (leads to A), LS (leads to B), LR (leads to C), RL (leads to C), and RR (leads to D). A success is a path leading to C, which is LR or RL; a failure is a path leading to A, B, or D, which is LL, LS, or RR.
b. Using the given 50 simulated paths:
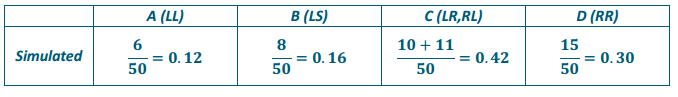
c. Paige is incorrect. The mouse still makes direction decisions that are equally likely, but there is one decision point that has three rather than two emanating paths. Based on the simulation, the mouse is more likely to end up at terminal C.
d. Yes, the simulation appears to support the given probability model, as the estimates are reasonably close.
Eureka Math Grade 7 Module 5 Lesson 12 Exit Ticket Answer Key
Question 1.
There are four pieces of bubble gum left in a quarter machine. Two are red, and two are yellow. Chandra puts two quarters in the machine. One piece is for her, and one is for her friend, Kay. If the two pieces are the same color, she is happy because they will not have to decide who gets what color. Chandra claims that they are equally likely to get the same color because the colors are either the same or they are different. Check her claim by doing a simulation.
a. Name a device that can be used to simulate getting a piece of bubble gum. Specify what outcome of the device represents a red piece and what outcome represents yellow.
b. Define what a trial is for your simulation.
c. Define what constitutes a success in a trial of your simulation.
d. Perform and list 50 simulated trials. Based on your results, is Chandra’s equally likely model correct?
Answer:
a. There are several ways to simulate the bubble gum outcomes. For example, two red and two yellow disks could be put in a bag. A red disk represents a red piece of bubble gum, and a yellow disk represents a yellow piece.
b. A trial is choosing two disks (without replacement).
c. A success is if two disks are of the same color; a failure is if they differ.
d. 50 simulated trials produce a probability estimate of about \(\frac{1}{3}\) for the same color and \(\frac{2}{3}\) for different colors.
Note: Some students may believe that the model is equally likely, but hopefully they realize by now that they should make some observations to make an informed decision. Some may see that this problem is actually similar to Exercise 3.