Engage NY Eureka Math Precalculus Module 5 Lesson 19 Answer Key
Eureka Math Precalculus Module 5 Lesson 19 Example Answer Key
Example 1: Using Probability to Make a Decision About a Hypothesis
Suppose that a friend lends you an MP3 player containing a large number of songs. Your friend tells you that 1/3 of the songs are indie rock, and the rest are hip-hop. You put the MP3 player in random shuffle mode, listen to eight randomly selected songs, and discover that they are all hip-hop. How could you determine whether your friend’s statement is true or not?
a. Do you believe your friend? Why or why not? Use probability to justify your answer.
Answer:
Sample response 1: No. I don’t believe my friend because if \(\frac{1}{3}\) of the songs were indie rock and the rest hip-hop, then 2 or 3 songs in the sample should have been indie rock and the rest hip-hop.
Sample response 2: Yes. I believe my friend. \(\frac{1}{3}\) is the probability of the occurrence of indie rock songs in any sample, but any sample could contain no indie rock songs.
b. If it is true that \(\frac{1}{3}\) of the songs on the MP3 player are indie rock and the rest are hip-hop, what would the probability be that all eight randomly selected songs are hip-hop? (Round your answer to the nearest thousandth.)
Answer:
(\(\frac{2}{3}\))8 ≈0.039
c. Does the result of your random selection lead you to suspect that what your friend told you is false? Explain your answer using the probability in part (a).
Answer:
If what my friend said is true, then it is very unlikely (probability = 0.039) that all eight randomly selected songs would be hip-hop. So, there is strong evidence that what the friend said is false.
Eureka Math Precalculus Module 5 Lesson 19 Exercise Answer Key
Exercise 1—4
Exercise 1.
A class consists of 12 boys and 12 girls. The teacher picks five students to present their work to the rest of the class and says that the five students are being selected at random. The students chosen are all girls.
a. If the teacher was truly selecting the students at random, what would the probability be that all five students selected are girls? (Round your answer to the nearest thousandth.)
Answer:
(\(\frac{12}{24}\))(\(\frac{11}{23}\))(\(\frac{10}{22}\))(\(\frac{9}{21}\))(\(\frac{8}{20}\))≈0.019
b. Does the fact that all five students selected are girls lead you to suspect that the teacher was not truly selecting the students at random but that the teacher had a preference for choosing girls? Explain your answer using the probability in part (a).
Answer:
If the teacher was selecting students at random, then it is very unlikely (probability = 0.019) that all the students selected would be girls. So, there is strong evidence that the teacher had a preference for choosing girls.
Exercise 2.
School starts at 8:00 a.m.; it is now 7:30 a.m., and you are still at home. You have to decide whether to leave now and ride your bicycle to school or to call a friend and ask the friend to pick you up. Your friend would take 10 minutes to get to your house. You know that when you ride your bicycle, the time it takes to get to school has a mean of 26 minutes and a standard deviation of 3 minutes. When your friend drives you, the time it takes to get from your home to school has a mean of 14 minutes and standard deviation of 5 minutes. Which of the two alternatives will make you more likely to get to school on time? Show the assumptions that must be made and the calculations that lead to your conclusion.
Answer:
It should be assumed that the data is normally distributed. This is a valid assumption because
Each trip to school is an independent event.
The dataset of all trips to school is continuous, not discrete.
Barring anything drastic, almost all bicycle trips should take between 17 and 35 minutes (less than 20 minutes and more than 32 minutes being highly unlikely), while all car trips should take between 0 and 29 minutes (less than 4 minutes and more than 24 minutes being highly unlikely).
If you choose to ride the bicycle, to get to school on time, the journey time has to be less than 30 minutes.
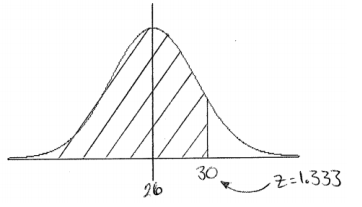
P(X < 30) = P(Z < \(\frac{30-26}{3}\)) = P(Z < 1.333) = 0.909
If you choose to ride with the friend, in order to get to school on time, the journey time has to be less than 20 minutes.
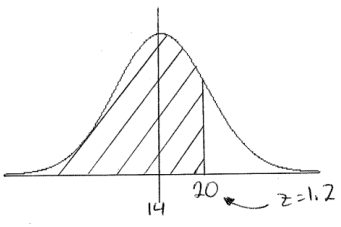
P(X < 20) = P(Z < \(\frac{20-14}{5}\))
= P(Z 1.2)
= 0.885
Since 0.909 is greater than 0.885, you are more likely to get to school on time if you ride the bicycle.
Exercise 3.
Recent polls have shown that 58% of voters in a city support a particular party. However, the party has just entered a new phase of its campaign, and in a new poll of 1,000 randomly selected voters, the proportion of voters who support the party is found to be 0.597.
a. It is known that if 58% of all voters support the party, the proportion of people in a random sample of 1,000 voters who support the party is approximately normally distributed with mean 0.58 and standard deviation 0.0156. If 58% of voters supported the party, what would be the probability of a sample proportion of 0.597 or more supporting the party? (Round your answer to the nearest thousandth.)
Answer:
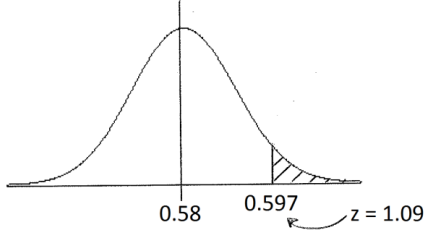
P(sample proportion ≥ 0.597) = P(Z ≥ \(\frac{0.597-0.58}{0.0156}\)) = P(Z ≥ 1.090) = 0.138
b. Should the result of the new poll lead the party to think that support for the party has increased? Explain your answer using the probability in part (a).
Answer:
If support for the party has remained the same, then it is not particularly unlikely (probability = 0.138) that you would get a sample proportion of 0.597 or more. So, there is no strong reason for the party to think that support has increased.
Exercise 4.
In order to be admitted to a master’s degree program, Tim must take a graduate record examination. A graduate record examination is in three sections: verbal reasoning, quantitative reasoning, and analytic writing. The exam is administered by two different companies. In Company A’s version of the exam, Tim estimates that his probabilities of passing the three sections are 0.85, 0.95, and 0.90, respectively. In Company B’s version, he estimates the probabilities of passing to be 0.92, 0.93, and 0.88 for the three sections. (You may assume that, with either of the companies, Tim’s outcomes for the three sections of the exam are independent.)
a. Which company should Tim choose if he must pass all three sections?
Answer:
If Tim uses Company A, then the probability he will pass all three sections is (0.85)(0.95)(0.90) = 0.727.
If Tim uses Company B, then the probability he will pass all three sections is (0.92)(0.93)(0.88) = 0.753.
Since 0.753 is greater than 0.727, Tim should use Company B.
b. Which company should Tim choose if he must pass at least one of the sections?
Answer:
If he uses Company A, then the probability that he will fail all three sections is
(0.15)(0.05)(0.10) = 0.000 750. So, the probability that he passes at least one is
1–0.000 750 = 0.999 250.
If he uses Company B, then the probability that he will fail all three sections is
(0.08)(0.07)(0.12) = 0.000 672. So, the probability that he passes at least one is
1–0.000 672 = 0.999 328.
Tim is almost certain to pass at least one section whichever company he uses, but his chances are slightly better with Company B
Eureka Math Precalculus Module 5 Lesson 19 Problem Set Answer Key
Question 1.
To qualify for a vegetable-growing competition, onions must have a mass of at least 200 g. A grower has the choice of two different types of onion. The first type (when grown under certain conditions) grows to a mass that is approximately normally distributed with mean 192 g and standard deviation 15.3 g. The second (grown under the same conditions) grows to a mass that is approximately normally distributed with mean 187 g and standard deviation 18.8 g. Which of the two types is more likely to produce an onion that qualifies for the competition?
Answer:
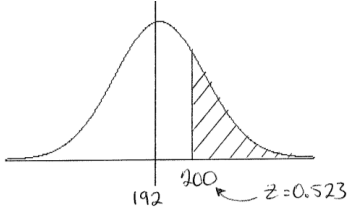
First type:
P(X ≥ 200) = P(Z ≥ \(\frac{200-192}{15.3}\))
= P(Z ≥ 0.523)
= 0.300
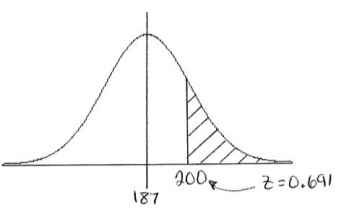
Second type:
P(X ≥ 200) = P(Z ≥ \(\frac{200-187}{18.8}\))
= P(Z ≥ 0.691)
= 0.245
Since 0.300 > 0.245, the first type is more likely to produce an onion that qualifies for the competition.
Question 2.
Ron’s Joke Store sells both regular (fair) number cubes and weighted number cubes. Unfortunately, some of the number cubes have been mixed up. An employee rolls one of the number cubes 100 times, and the proportion of these rolls that result in sixes (the sample proportion) is 0.24.
a. It is known that if a fair number cube is rolled 100 times, then the sample proportion of rolls that result in sixes is approximately normally distributed with mean \(\frac{1}{6}\) and standard deviation 0.0373. If the number cube was fair, what would the probability be that the sample proportion in 100 rolls that result in sixes would be at least 0.24? (Round your answer to the nearest thousandth.)
Answer:
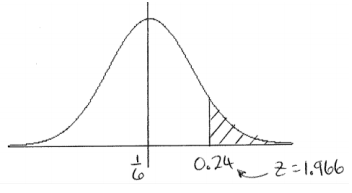
P(sample proportion ≥ 0.24) = P(Z ≥ \(\frac{0.24-\frac{1}{6}}{0.0373}\)) = P(Z ≥ 1.966) = 0.025
b. Does the employee’s result provide strong evidence that the number cube is biased toward sixes? Explain your answer using the probability in part (a).
Answer:
Yes. If the number cube was fair, then it would be very unlikely (probability = 0.025) that you would get a sample proportion of sixes of at least 0.24. So, there is strong evidence that the number cube is biased toward sixes.
Question 3.
Alex and Max are twins, and they are both about to take exams in math, English, history, and science. Their parents have offered them special privileges (details to be announced) if they get A’s in all their exams. For the four exams, Alex’s probabilities of getting A’s are 0.8, 0.9, 0.8, and 0.95, respectively. The equivalent probabilities for Max are 0.9, 0.9, 0.85, and 0.85. (You can assume that the results of the four tests are independent of one another.)
a. Which of the twins is more likely to get A’s in all the exams?
Answer:
P(Alex gets all A’s) = (0.8)(0.9)(0.8)(0.95) = 0.5472
P(Max gets all A’s) = (0.9)(0.9)(0.85)(0.85) = 0.5852
Since 0.5852 is greater than 0.5472, Max is more likely to get all A’s.
b. Which of the twins is more likely to get at least one A?
Answer:
P(Alex gets no A’s) = (0.2)(0.1)(0.2)(0.05) = 0.0002
So, P(Alex gets at least one A) = 1-0.0002 = 0.9998.
P(Max gets no A’s) = (0.1)(0.1)(0.15)(0.15) = 0.000 225
So, P(“Max gets at least one A) = 1-0.000225 = 0.999 775
Alex is slightly more likely than Max to get at least one A.
Question 4.
Roxy is a statistics teacher. She has a set of 52 cards, and she tells her class that there are 26 red and 26 black cards. Roxy shuffles the cards and offers cookies to the first student to select a red card. An eager volunteer starts to select cards at random; after each selection, the card is returned, and the cards are shuffled. Having picked black cards on each of the first five selections, the volunteer exclaims that his teacher is up to one of her tricks. Does the student have strong evidence that the cards are not as Roxy described? Include a probability calculation in your answer.
Answer:
If there were 26 red and 26 black cards in the deck, then the probability of randomly selecting five black cards would be (\(\frac{1}{2}\))5 = 0.03125; it would be very unlikely for all five of the student’s cards to be black. So, yes, the student has strong evidence that the cards are not as Roxy described.
Question 5.
You decide to lay tile on the floor in one room of your house. The room measures 120 sq.ft., and the tiles themselves each measure one square foot. You want to mix white, gray, and black tile in the ratio 3:2:1, respectively. When the tile is delivered to your house, you open up the packages and realize that the tiles are completely assorted. You begin to sort them out. As you are sorting, you randomly pick six gray tiles in a row.
You immediately look for the tile company’s phone number and call them to have your order replaced because the ratio is not correct. Are you justified in doing this?
Answer:
A ratio of 3:2:1 means that 20 tiles are black, 40 are gray, and 60 are white. The probability of choosing six gray tiles in a row is (\(\frac{40}{120}\))(\(\frac{39}{119}\))(\(\frac{38}{118}\))(\(\frac{37}{117}\))(\(\frac{36}{116}\))(\(\frac{35}{115}\))≈0.00105. Picking six gray tiles in this situation would occur about 1 in 1,000 times, which is a very low probability. There is compelling evidence that the ratio of colors is not as it should be.
Question 6.
The published universal distribution of M&Ms by color is 13% brown, 13% red, 14% yellow, 24% blue, 20% orange, and 16% green. You find a snack pack, which has about 20 candies; you open it, calculate the distribution, and then eat them all. In that pack, 15% are orange. Curious, you find a single-serve bag, containing about 50 candies. In this bag, 24% are orange. More intrigued, you go for a king-size bag, which ends up containing about 19% orange. You try some more bags, but none of the bags you try contain the actual published percentage of orange M&Ms. Does this make you think that their figures are wrong and that they should publish the correct percentages?
Answer:
There is not enough evidence to claim that the candy company is wrong. The bags you chose are just a few of the millions of samples of M&Ms that exist, and the variation between bags is natural. In fact, it is probably normally distributed. The figure of 20% comes from two places: the average percentage of orange M&Ms across all bags and the possibility that the company actually counts the colors and sets the percentages as the candy is being made.
Eureka Math Precalculus Module 5 Lesson 19 Exit Ticket Answer Key
Question 1.
A coffee machine has two nozzles. It is known that the amount of coffee dispensed by the first nozzle is approximately normally distributed with mean 7.1 oz. and standard deviation 0.41 oz. and that the amount of coffee dispensed by the second nozzle is approximately normally distributed with mean 7.2 oz. and standard deviation 0.33 oz. If a person is using an 8 oz. cup, which nozzle should he use to minimize the probability that the cup will be overfilled and the coffee will spill?
Answer:
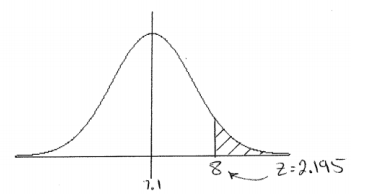
Using the first nozzle, the probability that the coffee will spill is
P(X > 8) = P(Z > \(\frac{8-7.1}{0.41}\)) = P(Z > 2.195) = 0.014.
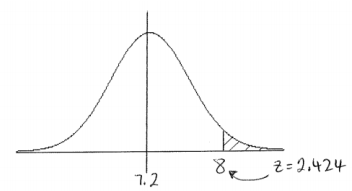
Using the second nozzle, the probability that the coffee will spill is
P(X > 8) = P(Z > \(\frac{8-7.2}{0.33}\)) = P(Z > 2.424) = 0.008.
The probability that the coffee will spill is less likely when using the second nozzle.
Question 2.
Ron’s Joke Store offers a coin that is supposed to be weighted toward heads. Caitlin tries out one of these coins. She flips the coin three times and gets a head on all three flips.
a. If the coin was fair, what would the probability be that Caitlin would get heads on all three flips? (Round your answer to the nearest thousandth.)
Answer:
(\(\frac{1}{2}\))3 = 0.125
b. Should Caitlin’s result of heads on all three flips lead her to conclude that the coin is weighted toward heads? Explain.
Answer:
No. If the coin was fair, then it would not be particularly unlikely (probability = 0.125) that all three flips would result in heads. So, Caitlin’s result does not give her strong evidence that the coin is weighted toward heads. If she had flipped the coin more times (say, 5 or 6) and saw all heads, the evidence that the coin was weighted in favor of heads would be more compelling.