A pictograph is the easiest way of representing the data using pictures Each and every image stands for a certain number of things. It is a method of collecting and recording data in an understandable way for the 5th-grade students. Check the simple steps on how to represent the data in pictograph, how to read it, and example questions with solutions in the following sections.
Steps to Read Pictograph
Get the different ways of data representation like bar graphs, tables, pictographs, and others. The complete step by step process of reading pictographs is along the lines:
- Count how many different types of items or objects are available in the picture.
- Find how items of each kind are present in the graph.
- Write the item name and number of items available in a tabular form or any other form.
Pictograph Definition | Advantages of Pictographs
A pictograph is the representation of data using images or pictures. Pictographs represent the frequency of data while using pictures that are relevant to the data. It is the easiest way to represent or handle the statistical data. Reading pictographs is a simple process.
Some of the advantages pictographs are mentioned here:
- You can express a huge amount of data or information in a simpler manner.
- As they use symbols, images it attracts the students. So, it is an attractive way to represent data.
- They are easy to read as the data is available at one glance.
- Since pictographs are universally used they do not require any external explanation.
Do Read: Worksheet on Pictograph and Bar Graph
How to Represent Data on Pictograph?
The steps that represent the data in a pictograph are given here:
- In the first step, collect the data of category. You can collect data by means and make a table of data.
- Select a symbol or image that really represents the data. If you are representing a cricket ball, then take the ball image.
- If the frequency of data is high, then one symbol cannot represent the frequency. Take a set of numerical values that one symbol will represent.
- Draw two columns, one for the category and the other for data. Draw the actual symbols to represent the frequencies.
- Finally, review your graph and make sure it is presented correctly.
Solved Examples on Reading Pictographs
Example 1:
A fruit store has different varieties of apples. The number of apples in each variety is shown in the pictograph.
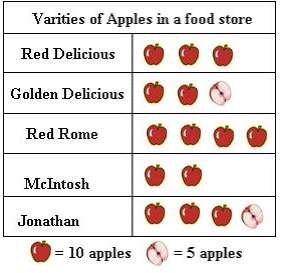
i. How many Red Rome apples are there in the fruit store?
ii. How many varieties of apples are available?
iii. Which variety has the maximum number of apples?
iv. Which variety has the least number of apples?
Solution:
i. The number of Red Rome apples in the store is 4 * 10 = 40.
ii. Five varieties of apples are available in the store. They are Jonathan, McIntosh, Red Rome, Red Delicious, and Golden Delicious.
iii. Red Rome has a maximum number of apples.
iv. McIntosh has a minimum number of apples.
Example 2:
After celebrating the birthday party David find out there were few bakery items left. He made a pictograph with the left items?
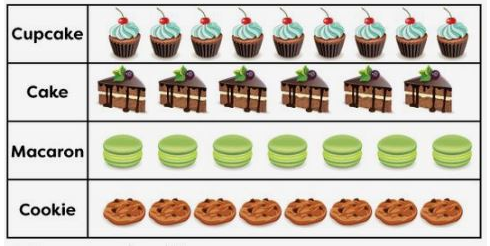
i. How many cookies are left?
ii. Which item count to 7?
iii. How many more cupcakes are there than cookies?
Solution:
i. There are 8 cookies left.
ii. Macaron count to number 7.
iii. Number of cupcakes = 9
Number of cookies = 8
9 – 8 = 1
So, only one cupcake is more than cookies.
FAQ’s on Pictographs Reading
1. What are the examples of pictographs?
An example of a pictograph is the number of different varieties of pizzas available in a store.
2. How pictographs are helpful?
Pictographs represent the data in a simpler way. It makes use of symbols or images to define the given item. It helps the elementary or kindergarten students to understand and solve the math concepts easily.
3. What are the different names to represent pictographs?
The other names to pictograph are pictorial chart, pictograph chart, pictogram chart, picture chart, and so on.
4. What is meant by key in pictograph?
The key in a pictograph represents the value of an image. The key is used when the frequency of the data is too large.