Understand the concepts covered in Linear Functions with the help of BIM Big Ideas Math Algebra 1 Answers Ch 3 Graphing Linear Functions. Big Ideas Math Algebra 1 Answers Graphing Linear Functions given here helps the students to learn the subject easily. Download Big Ideas Math Algebra 1 Ch 3 Graphing Linear Functions Answer Key and enhance your subject knowledge. Thus, Start your preparation and make a note of the weak concepts where you have to spend more time for better scores in the exams.
Big Ideas Math Book Algebra 1 Answer Key Chapter 3 Graphing Linear Functions
Explore the Mathematical Concepts by checking our Big Ideas Math Book Algebra 1 Answer Key Chapter 3 Graphing Linear Functions by using the links. Students can find topic-wise answers key with step by step explanations from here. Hence make use of the links given below to kick-start your preparation. Test yourself by solving the questions in Quiz, Chapter Test, and Chapter Review. By solving the questions from the review you can know what you have learned from this chapter.
- Graphing Linear Functions Maintaining Mathematical Proficiency – Page 101
- Graphing Linear Functions Mathematical Practices – Page 102
- Lesson 3.1 Functions – Page (103 – 110)
- Functions 3.1 Exercises – Page(108-110)
- Lesson 3.2 Linear Functions – Page(111-120)
- Linear Functions 3.2 Exercises – Page(117-120)
- Lesson 3.3 Function Notation – Page(121-126)
- Function Notation 3.3 Exercises – Page(125-126)
- Graphing Linear Functions Study Skills: Staying Focused During Class – Page 127
- Graphing Linear Functions 3.1 – 3.3 Quiz – Page 128
- Lesson 3.4 Graphing Linear Equations in Standard Form – Page(129-134)
- Graphing Linear Equations in Standard Form 3.4 Exercises – Page(133-134)
- Lesson 3.5 Graphing Linear Equations in Slope-Intercept Form – Page(135-144)
- Graphing Linear Equations in Slope-Intercept Form 3.5 Exercises – Page(141-144)
- Lesson 3.6 Transformations of Graphs of Linear Functions – Page(145-154)
- Transformations of Graphs of Linear Functions 3.6 Exercises – Page(151-154)
- Lesson 3.7 Graphing Absolute Value Functions – Page(155-162)
- Graphing Absolute Value Functions 3.7 Exercises – Page(160-162)
- Graphing Linear Functions Performance Task: The Cost of a T-Shirt – Page 163
- Graphing Linear Functions Chapter Review – Page(164-168)
- Graphing Linear Functions Chapter Test – Page 169
- Graphing Linear Functions Cumulative Assessment – Page (170- 171)
Graphing Linear Functions Maintaining Mathematical Proficiency
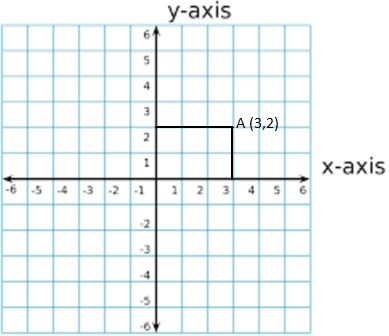
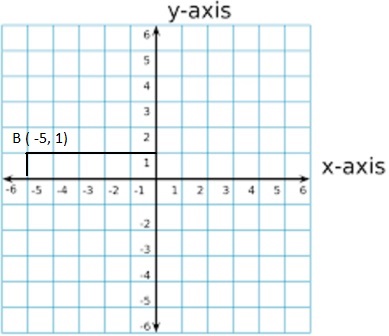
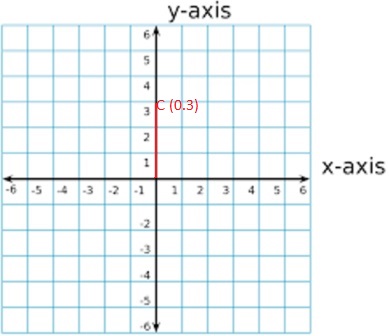
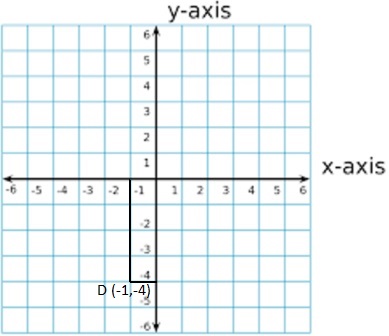
Plot the point in a coordinate plane. Describe the location of the point.
Question 1.
A(3, 2)
Answer:
Given,
A (3,2)
x = 3 and y = 2
Question 2.
B(-5, 1)
Answer:
Given,
B (-5,1)
x = -5 and y = 1
Question 3.
C(0, 3)
Answer:
Given,
C (0,3)
x = 0 and y = 3
Question 4.
D(-1, -4)
Answer:
Given,
D (-1,-4)
x = -1 and y = -4
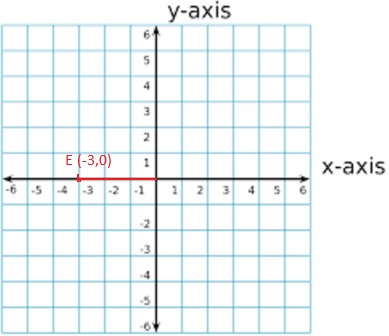
Question 5.
E(-3, 0)
Answer:
Given,
E (-3,0)
x = -3 and y = 0
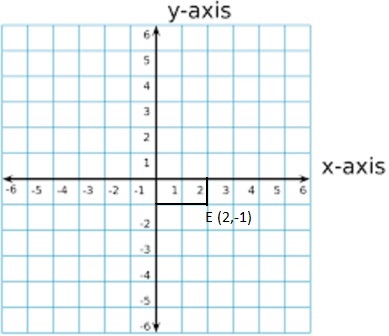
Question 6.
F(2, -1)
Answer:
Given,
F (2,-1)
x = 2 and y = -1
Evaluate the expression for the given value of x.
Question 7.
3x – 4; x = 7
Answer:
Given
3x – 4
x = 7
3 (7) – 4 = 21 – 4 = 17
Question 8.
-5x + 8; x = 3
Answer:
Given,
-5x + 8
x = 3
-5 (3) + 8 = -15 + 8 = -7
Question 9.
10x + 18; x = 5
Answer:
Given,
10x + 18
x = 5
10 (5) + 18 = 50 + 18 = 68
Question 10.
-9x – 2; x = -4
Answer:
Given
-9x – 2
x = -4
-9 (-4) – 2 = 36 – 2 = 34
Question 11.
24 – 8x; x = -2
Answer:
Given
24 – 8x
x = -2
24 – 8 (-2) = 24 + 16 = 40
Question 12.
15x + 9; x = -1
Answer:
Given,
15x + 9 with x = -1
15 (-1) + 9 = -15 + 9 = -6
Question 13.
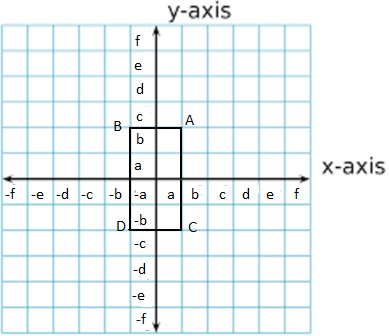
ABSTRACT REASONING
Let a and b be positive real numbers. Describe how to plot (a, b), (-a, b), (a, -b), and (-a, -b).
Answer:
Let a and b be positive real numbers.
The given points are (a, b), (-a, b), (a, -b), and (-a, -b)
Let the names of the points be:
A (a, b), B (-a, b), C (a, -b), and D (-a, -b)
The representation of a and b in the 4 quadrants are
1st Quadrant: (a, b)
2nd Quadrant: (-a, b)
3rd Quadrant: (-a, -b)
4th Quadrant: (a, -b)
Graphing Linear Functions Mathematical Practices
Monitoring Progress
Determine whether the viewing window is square. Explain.
Question 1.
-8 ≤ x ≤ 7, -3 ≤ y ≤ 7
Answer:
Question 2.
-6 ≤ x ≤ 6, -9 ≤ y ≤ 9
Answer:
Question 3.
-18 ≤ x ≤ 18, -12 ≤ y ≤ 12
Answer:
Use a graphing calculator to graph the equation. Use a square viewing window.
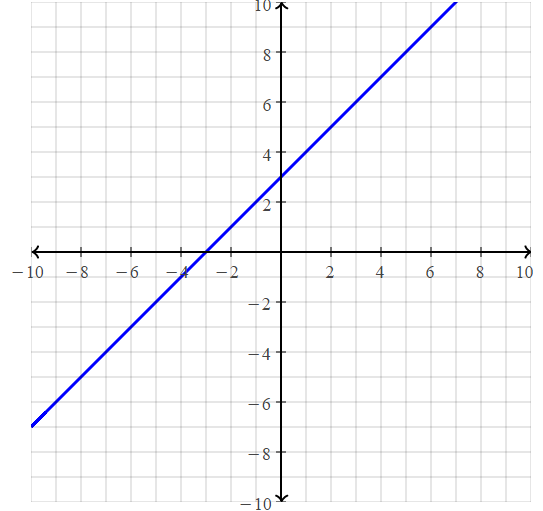
Question 4.
y = x + 3
Answer:
y = x + 3
x = 0
y = 0 + 3 = 3
(0, 3)
x = 1
y = 1 + 3 = 4
(1, 4)
x = 2
y = 2 + 3 = 5
x = -1
y = -1 + 3 = 2
(-1, 2)
x = -2
y = -2 + 3 = 1
(-2, 1)
Question 5.
y = -x – 2
Answer:
y = -x – 2
x = 0
y = 0 – 2 = -2
(0, -2)
x = 1
y = -1 – 2 = -3
(1, -3)
x = 2
y = -2 – 2 = -4
(2, -4)
x = -1
y = -(-1) – 2 = -1
(-1, -1)
Question 6.
y = 2x – 1
Answer:
y = 2x – 1
x = 0
y = 0 – 1 = -1
(0, -1)
x = 1
y = 2(1) – 1 = 1
(1, 1)
x = 2
y = 2(2) – 1 = 4 – 1 = 3
x = -1
y = 2(-1) – 1 = -2 – 1 =-3
(-1, -3)
Question 7.
y = -2x + 1
Answer:
y = -2x + 1
x = 0
y = -2(0) + 1 = 1
(0, 1)
x = 1
y = -2(1) + 1 = -2 + 1 = 1
(1, 1)
x = 2
y = -2(2) + 1 = -4 + 1 = -3
(2, -3)
Question 8.
y = –\(\frac{1}{3}\)x – 4
Answer:
y = –\(\frac{1}{3}\)x – 4
x = 0
y = –\(\frac{1}{3}\)(0) – 4 = -4
(0, -4)
x = 1
y = –\(\frac{1}{3}\)(1) – 4 = y = –\(\frac{1}{3}\) – 4 = -4\(\frac{1}{3}\)
Question 9.
y = \(\frac{1}{3}\)x + 2
Answer:
y = \(\frac{1}{3}\)x + 2
x = 0
y = \(\frac{1}{3}\)(0) + 2 = 2
(0, 2)
x = 1
y = \(\frac{1}{3}\)(1) + 2 = 2\(\frac{1}{3}\)
Question 10.
How does the appearance of the slope of a line change between a standard viewing window and a square viewing window?
Answer:
A typical graphing calculator screen has a height-to-width ratio of 2 to 3. This means that when you use the standard viewing window of -10 to 10, the graph will not be in its true perspective.
Lesson 3.1 Functions
Essential Question
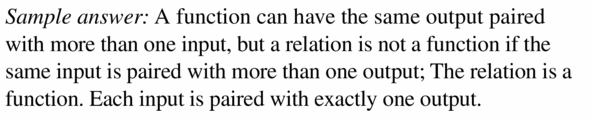
A relation pairs inputs with outputs. When a relation is given as ordered pairs, the x-coordinates are inputs and the y-coordinates are outputs. A relation that pairs each input with exactly one output is a function.
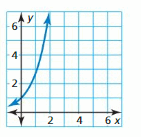
EXPLORATION 1
Describing a Function
Work with a partner. Functions can be described in many ways.
- by an equation
- by an input-output table
- using words
- by a graph
- as a set of ordered pairs
a. Explain why the graph is shown represents a function.
Answer:
The vertical line test can be used to determine whether a graph represents a function. If we can draw any vertical line that intersects a graph more than once, then the graph does not define a function because that x value has more than one output. A function has only one output value for each input value.
b. Describe the function in two other ways.
Answer:
The function can be described in 4 ways.
a. A function can be represented verbally.
Example:
The circumference of a square is four times one of its sides.
b. A function can be represented algebraically.
Example:
3 x + 6
c. A function can be represented numerically.
d. A function can be represented graphically.
EXPLORATION 2
Identifying Functions
Work with a partner. Determine whether each relation represents a function. Explain your reasoning.
e. (-2, 5), (-1, 8), (0, 6), (1, 6), (2, 7)
f. (-2, 0), (-1, 0), (-1, 1), (0, 1), (1, 2), (2, 2)
g. Each radio frequency x in a listening area has exactly one radio station y.
h. The same television station x can be found on more than one channel y.
i. x = 2
j. y = 2x + 3
Answer:
Functions can be described in different ways.
a. By an equation
b. By an input-output table,
c. Using words
d. By a graph
e. As a set of ordered pairs
The given Exercises above i.e., a, e, g, j are the relations that represent a function and the remaining relations are not functions.
Communicate Your Answer
Question 3.
What is a function? Give examples of relations, other than those in Explorations 1 and 2, that (a) are functions and (b) are not functions.
Answer:
A relation from a set of inputs to a set of possible outputs where each input is related to exactly one output is called a function.
Examples of relation that is a function:
a. y = x + 3
b. y = -x² + 1
Example of a relation that is not a function:
A relation is a set of inputs for specific outputs.
A single input has multiple outputs.
3.1 Lesson
Monitoring Progress
Determine whether the relation is a function. Explain.
Question 1.
(-5, 0), (0, 0), (5, 0), (5, 10)
Answer:
(-5, 0), (0, 0), (5, 0), (5, 10)
x represents the input
y represents the output
When we observe the given relation, there are 2 outputs for a single input.
The relation is not a function
Question 2.
(-4, 8), (-1, 2), (2, -4), (5, -10)
Answer:
(-4, 8), (-1, 2), (2, -4), (5, -10)
x represents the input
y represents the output
The given relation is a function
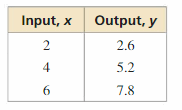
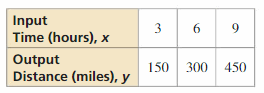
Question 3.
Answer:
(2, 2.6), (4, 5.2), (6, 7.8)
x represents the input
y represents the output
The given relation is a function
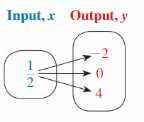
Question 4.
Answer:
(1, -2), (1, 0), (2, 4)
x represents the input
y represents the output
The given relation, there are 2 outputs for a single input
The given relation is not a function
Monitoring Progress
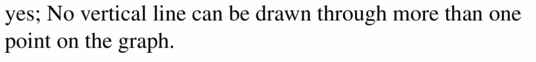
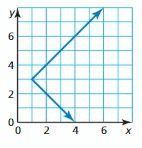
Determine whether the graph represents a function. Explain.
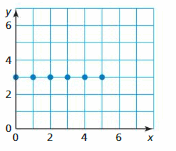
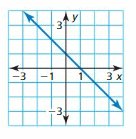
Question 5.
Answer:
(0, 3), (1, 3), (2, 3), (3, 3), (4, 3), (5, 3)
x represents the input
y represents the output
The inputs must be different but outputs may be the same or different
Hence, the given graph is a function
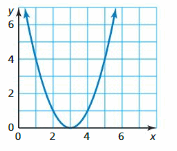
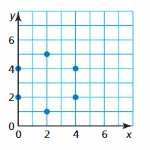
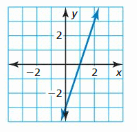
Question 6.
Answer:
(2, 1), (1, 2), (1, 3), (1, 4), (0.5, 5), (0.5, 6), (3, 0), (4, 1), (4.2, 2), (4.8, 3), (5, 4), (5.1, 5), (5.1, 6)
The output is different for the same input.
Hence, the given graph is not a function.
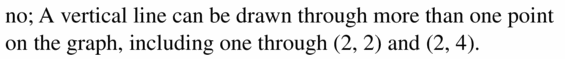
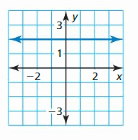
Question 7.
Answer:
With the same value of x, there are different values of y
x represents the input
y represents the output
For a function, each input must be matched with a single output
Hence, the given graph is not a function
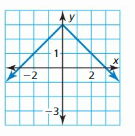
Question 8.
Answer:
We can observe that there are multiple outputs for a single input
The given graph is not a function
Monitoring Progress
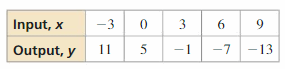
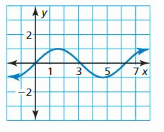
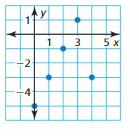
Find the domain and range of the function represented by the graph.
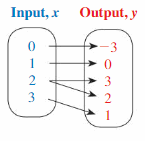
Question 9.
Answer:
The domain is defined as the set of all values present in the x-axis
The range is defined as the set of all values present in the y-axis
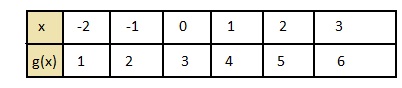
The domain of the given graph is -2, -1, 0, 1, 2
The range of the given graph is 1, 2, 3, 4
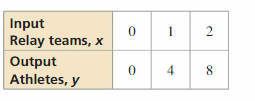
Question 10.
Answer:
Domain is defined as the set of all values present in the x-axis
Range is defined as the set of all values present in the y-axis
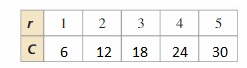
The domain of the given graph is 1, 2, 3, 4, 5
The range of the given graph is 0, 1, 2, 3, 4
Monitoring Progress
Question 11.
The function a = -4b + 14 represents the number ‘a’ of avocados you have left after making b batches of guacamole.
a. Identify the independent and dependent variables.
Answer:
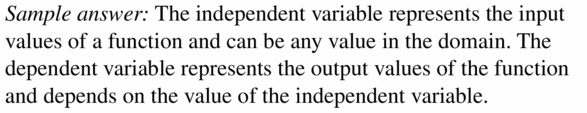
Independent variable represents the input values of a function and can be any value in the domain.
Dependent variable represents the output values of the function and depends on the value of the independent variable
The independent variable is b (batches of guacamole)
The dependent variable is a (The number of avocados)
b. The domain is 0, 1, 2, and 3. What is the range?
Answer:
a = -4b + 14
Input: b
Output: a
Domain: 0, 1, 2, and 3
To find the range, we have to find the values of b for each value present in the domain
a = -4 (0) + 14 = 14
a = -4 (1) + 14 = 10
a = -4 (2) + 14 = 6
a = -4 (3) + 14 = 2
The range for the given equation is 2, 6, 10, and 14
Question 12.
The function t = 19m + 65 represents the temperature t (in degrees Fahrenheit) of an oven after preheating for m minutes.
a. Identify the independent and dependent variables.
Answer:
The independent variable is Minutes
The dependent variable is Temperature
b. A recipe calls for an oven temperature of 350°F. Describe the domain and range of the function.
Answer:
t = 19m + 65
y = mx + c
A recipe calls for an oven temperature of 350°F.
350 = 19m + 65
19m = 350 – 65
19m = 285
m = 285 / 19
m = 15
t = 19 (15) + 350
t = 285 + 65
t = 350°F
The domain of the given function is 0 ≤ m ≤ 15 [ Since the minutes will not be -ve ]
The range of the given function is 65 ≤ t ≤ 350 [ Since the minimum temperature is the value of c ]
Functions 3.1 Exercises
Vocabulary and Core Concept Check
Question 1.
WRITING
How are independent variables and dependent variables different?
Answer:
Question 2.
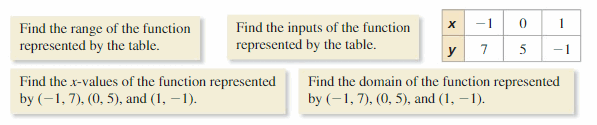
DIFFERENT WORDS, SAME QUESTION
Which is different? Find “both” answers.
Answer:
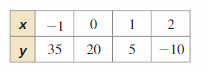
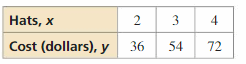
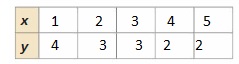
The values of x are -1, 0, 1
The values of y are 7, 5, -1
The x values represent the input and the domain
The y values represent the output and the range
The range of the function represented by the table is: 7, 5, -1
The inputs of the function represented by the table are: -1, 0, 1
The x values of the function represented by the given points are: -1, 0, 1
The domain of the function represented by the given points are: -1, 0, 1
Hence, all the given four are the same.
Monitoring Progress and Modeling with Mathematics
In Exercises 3–8, determine whether the relation is a function. Explain.
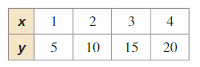
Question 3.
(1, -2), (2, 1), (3, 6), (4, 13), (5, 22)
Answer:
![]()
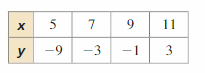
Question 4.
(7, 4), (5, -1), (3, -8), (1, -5), (3, 6)
Answer:
(7, 4), (5, -1), (3, -8), (1, -5), (3, 6)
For a function, each input has only a single output
We can observe that 3 has multiple outputs
Hence, the given relation is not a function.
Question 5.
Answer:
![]()
Question 6.
Answer:
The given relation is:
For a function, a single input has a single output
Each input has only 1 output
Hence, the given relation is a function
Question 7.
Answer:
Question 8.
Answer:
Each input has a single output
Hence, the given relation is a function
In Exercises 9–12, determine whether the graph represents a function. Explain.
Question 9.
Answer:
Question 10.
Answer:
We can observe that the vertical line can be drawn through more than one point on the graph i.e., input 2 has repeated 2 times i.e., (2, 1) and (2, 5)
Hence, the given graph is not a function.
Question 11.
Answer:
Question 12.
Answer:
Each input corresponds to a single output.
Hence, the given graph is a function.
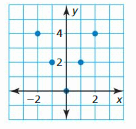
In Exercises 13–16, find the domain and range of the function represented by the graph.
Question 13.
Answer:
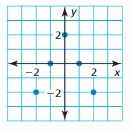
Question 14.
Answer:
The ordered pairs are (0, 4), (-2, 4), (2, 4), (4, 4)
The domain of the given graph is 0, -2, 2, 4
The range of the given graph is 4
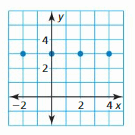
Question 15.
Answer:
Question 16.
Answer:
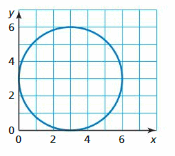
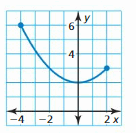
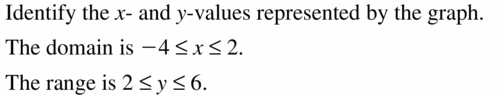
Identify the x and y values
The values of x range from 2 to 7 excluding 2 and 7
The values of y range from 1 to 6 excluding 1 and 6
The domain of the given graph is 2 < x < 7
The range of the given graph is 1 < y < 6
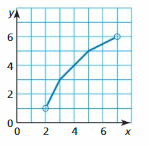
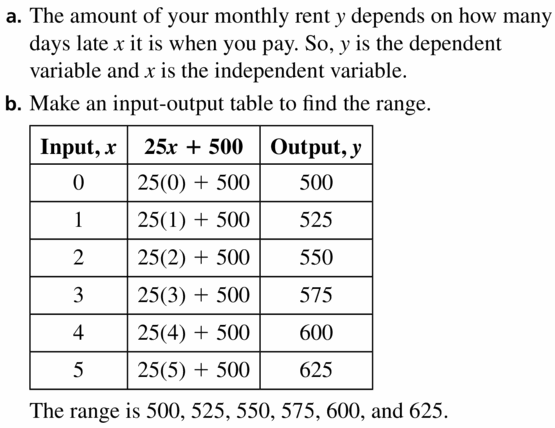
Question 17.
MODELING WITH MATHEMATICS
The function y = 25x + 500 represents your monthly rent y (in dollars) when you pay x days late.
a. Identify the independent and dependent variables.
b. The domain is 0, 1, 2, 3, 4, and 5. What is the range?
Answer:
Question 18.
MODELING WITH MATHEMATICS
The function y = 3.5x + 2.8 represents the cost y (in dollars) of a taxi ride of x miles.

a. Identify the independent and dependent variables.
Answer:
y = 3.5x + 2.8
The independent variable is x which represents the number of miles
The dependent variable is y which represents the cost in dollars
b. You have enough money to travel at most 20 miles in a taxi. Find the domain and range of the function.
Answer:
You have enough money to travel at most 20 miles in a taxi.
y = 3.5x + 2.8
x ≥ 0 and x ≤ 20
The value of x ranges from 0 ≤ x ≤ 20
y = 3.5 (20) + 2.8
y = 7 + 2.8
y = $9.8
y = 3.5 (0) + 2.8
y = 0 + 2.8
y = $2.8
The domain of the given function is 0 ≤ x ≤ 20 miles
The range of the given function is $2.8 ≤ y ≤ $9.8
ERROR ANALYSIS
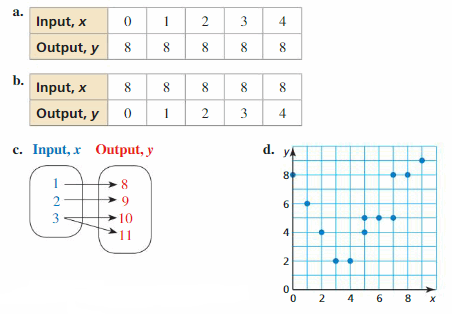
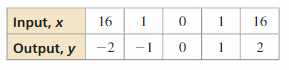
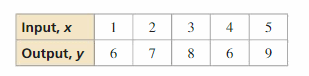
In Exercises 19 and 20, describe and correct the error in the statement about the relation shown in the table.
Question 19.

Answer:
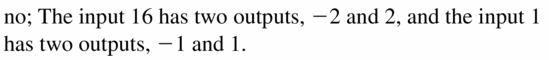
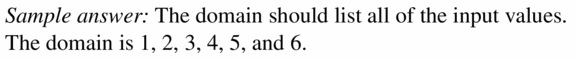
Question 20.

Answer:
The relation is a function and the range is 1, 2, 3, 4, and 5
The relation is a function only when a single input pairs with an output
For the function, the domain, and the range exist
The domain is 1, 2, 3, 4, 5
The range is 6, 7, 8, 6, 9
Thus, the given statement is not correct.
ANALYZING RELATIONSHIPS
In Exercises 21 and 22, identify the independent and dependent variables.
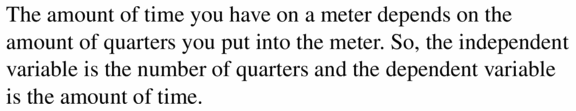
Question 21.
The number of quarters you put into a parking meter affects the amount of time you have on the meter.
Answer:
Question 22.
The battery power remaining on your MP3 player is based on the amount of time you listen to it.
Answer:
The battery power remaining on your MP3 player is based on the amount of time you listen to it.
The Independent variable is Amount of time
The dependent variable Battery power
Question 23.
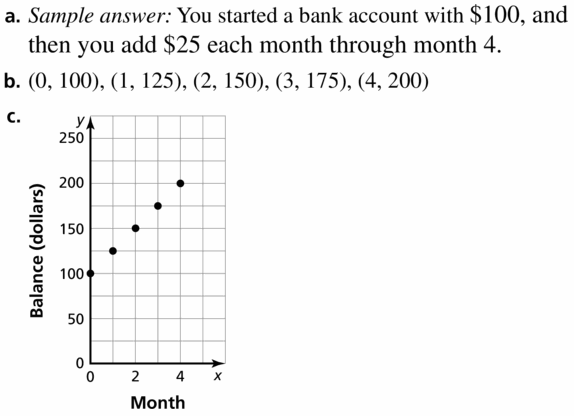
MULTIPLE REPRESENTATIONS
The balance y (in dollars) of your savings account is a function of the month x.
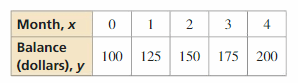
a. Describe this situation in words.
b. Write the function as a set of ordered pairs.
c. Plot the ordered pairs in a coordinate plane.
Answer:
Question 24.
MULTIPLE REPRESENTATIONS
The function 1.5x + 0.5y = 12 represents the number of hardcover books x and softcover books y you can buy at a used book sale.
a. Solve the equation for y.
Answer:
1.5x + 0.5y = 12
0.5y = 12 – 1.5x
y = \(\frac{12 – 1.5x}{0.5}\)
y = \(\frac{12}{0.5}\) – \(\frac{1.5x}{0.5}\)
y = 24 – 3x
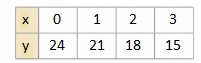
b. Make an input-output table to find ordered pairs for the function.
Answer:
y = 24 – 3x
Put the values of 0, 1, 2, 3 in x
y = 24 – 3(0) = 24
y = 24 – 3(1) = 21
y = 24 – 3(2) = 18
y = 24 – 3 (3) = 15
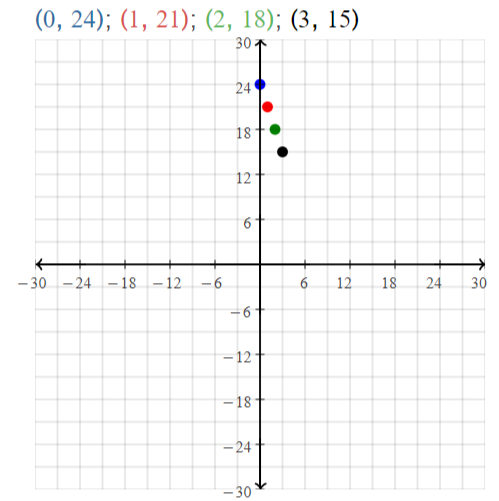
c. Plot the ordered pairs in a coordinate plane.
Answer:
The ordered pair is in the form of (x, y)
The ordered pairs are
Question 25.
ATTENDING TO PRECISION
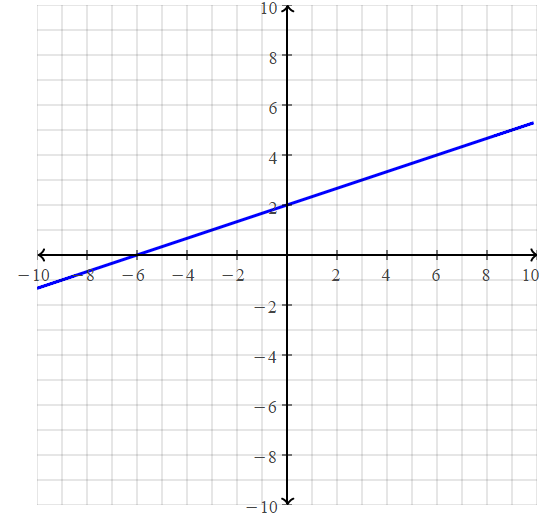
The graph represents a function. Find the input value corresponding to an output of 2.
Answer:
![]()
Question 26.
OPEN-ENDED
Fill in the table so that when t is the independent variable, the relation is a function, and when t is the dependent variable, the relation is not a function.
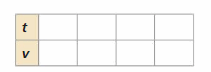
Answer:
Let the function in terms of t and v such as t is the independent variable and v is the dependent variable is
v = t + 4 ———–(1)
Let the function in terms of t and v such as v is the independent variable and t is the dependent variable is
t = 4v ———–(2)
place the values 0, 1, 2, 3 …….. in the independent variables of both functions
In equation (1),
v = 0 + 4 = 4
v = 1 + 4 = 5
v = 2 + 4 = 6
v = 3 + 4 = 7
In equation (2),
t = 4(0) = 0
t = 4(1) = 4
t = 4(2) = 8
t = 4(3) = 12
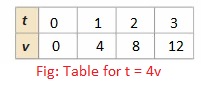
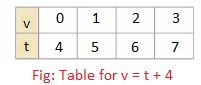
Equation (1) is a function and equation (2) is not a function.
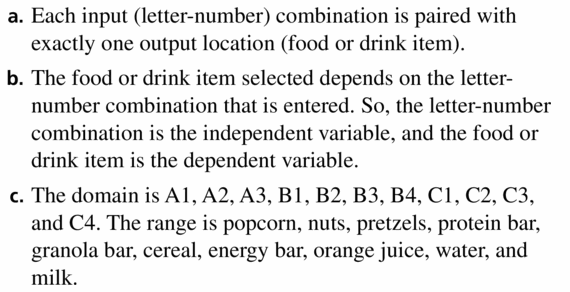
Question 27.
ANALYZING RELATIONSHIPS
You select items in a vending machine by pressing one letter and then one number.

a. Explain why the relation that pairs letter-number combinations with food or drink items is a function.
b. Identify the independent and dependent variables.
c. Find the domain and range of the function
Answer:
Question 28.
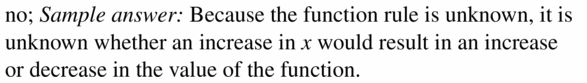
HOW DO YOU SEE IT?
The graph represents the height h of a projectile after t seconds.
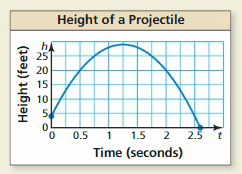
a. Explain why h is a function of t.
b. Approximate the height of the projectile after 0.5 seconds and after 1.25 seconds.
c. Approximate the domain of the function.
d. Is t a function of h? Explain.
Answer:
a. When we draw the vertical lines, each vertical line corresponds to only 1 value.
Hence, h is a function of t by using the vertical line method.
b. The height of the projectile after 0.5 seconds increases and after some time, the height of the projectile decreases
The height of the projectile after 1.25 seconds decreases steadily
The approximate maximum height after 0.5 seconds is 30 feet
The approximate maximum height after 1.25 seconds is 25 feet
c. The values of t in the x-axis vary from 0 to 2.5
The domain of the given graph is: 0 ≤ t ≤ 2.5 seconds
d. t is not a function of h
Reason:
For a single value of t, there are multiple values of h.
We know that a relationship can be considered a function only when a single input pairs with a single output.
We can conclude that t is not a function of h
Question 29.
MAKING AN ARGUMENT
Your friend says that a line always represents a function. Is your friend correct? Explain.
Answer:
![]()
Question 30.
THOUGHT-PROVOKING
Write a function in which the inputs and/or the outputs are not numbers. Identify the independent and dependent variables. Then find the domain and range of the function.
Answer:
Given that the inputs and/or the outputs will not be numbers.
The given function in which the inputs and/or the outputs are not numbers is:
°C = 32 + °F
The independent variable is °F
The dependent variable is °C
We can observe that the values of °F vary from -∞ to ∞
Place the values of -∞ to ∞ in the place of °F
°C = 32 + 0 = 32°F
°C = 32 + 1 = 33°F
°C = 32 – 1 = 31°F
°C = 32 – 40 = -8°F
We can observe that the values of °C vary from -∞ to ∞
The domain of the function is -∞ to ∞
The range of the function is -∞ to ∞
ATTENDING TO PRECISION In Exercises 31–34, determine whether the statement uses the word function in a way that is mathematically correct. Explain your reasoning.
Question 31.
The selling price of an item is a function of the cost of making the item.
Answer:
Question 32.
The sales tax on a purchased item in a given state is a function of the selling price.
Answer:
The sales tax on a purchased item in a given state is a function of the selling price.
The sales tax is a percentage applied to the selling price.
We can conclude that the given statement uses the word function in a way that is mathematically correct.
Question 33.
A function pairs each student in your school with a homeroom teacher.
Answer:

Question 34.
A function pairs each chaperone on a school trip with 10 students.
Answer:
A function pairs each chaperone on a school trip with 10 students.
Each chaperone on a school trip pairs with more than 1 student i.e., the number may be 2 or ∞ but not exactly 10
We can say that the given statement does not use the word function in a way that is mathematically correct.
REASONING
In Exercises 35–38, tell whether the statement is true or false. If it is false, explain why.
Question 35.
Every function is a relation.
Answer:
![]()
Question 36.
Every relation is a function.
Answer:
Every function is a relation that has only 1 output for a single input
But we can not say that every relation has a single output for a single input
The statement is false.
Question 37.
When you switch the inputs and outputs of any function, the resulting relation is a function.
Answer:
Question 38.
When the domain of a function has an infinite number of values, the range always has an infinite number of values.
Answer:
The domain is defined as the set of all the values of x
The range is defined as the set of all the values of y
Let the input be x
Let the output be a constant
The domain of the input can vary from -∞ to ∞
But the range of the output is only a constant even though we put any value of x
The statement is false
Question 39.
MATHEMATICAL CONNECTIONS
Consider the triangle shown.
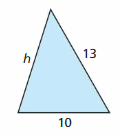
a. Write a function that represents the perimeter of the triangle.
b. Identify the independent and dependent variables.
c. Describe the domain and range of the function. (Hint: The sum of the lengths of any two sides of a triangle is greater than the length of the remaining side.)
Answer:
REASONING
In Exercises 40–43, find the domain and range of the function.
Question 40.
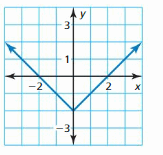
y = | x |
Answer:
y = | x |
We know that,
| x | = x for x > 0
| x | = -x for x < 0
We can put the values of x from -∞ to ∞
The values of x vary from 0 to ∞ since x can’t be negative
The domain of the given function is -∞ to ∞
The range of the given function is 0 to ∞
Question 41.
y = – | x |
Answer:
Question 42.
y = | x | – 6
Answer:
y = | x | – 6
| x | = x for x > 0
| x | = -x for x < 0
We can vary the values of x from -∞ to ∞
The values of y vary from -6 to ∞
The domain of the given function is: -∞ to ∞
The range of the given function is: y ≥ -6
Question 43.
y = 4 – | x |
Answer:
Maintaining Mathematical Proficiency
Write the sentence as an inequality. (Section 2.1)
Question 44.
A number y is less than 16.
Answer:
A number y is less than 16
The sentence as an inequality is y < 16
Question 45.
Three is no less than a number x.
Answer:
![]()
Question 46.
Seven is at most the quotient of a number d and -5.
Answer:
Seven is at most the quotient of a number d and -5
The sentence as an inequality is 7 ≤ d ÷ (-5)
Question 47.
The sum of a number w and 4 is more than -12.
Answer:
![]()
Evaluate the expression.
Question 48.
112
Answer:
11² can be written as,
11² = 11 × 11 = 121
Question 49.
(-3)4
Answer:
![]()
Question 50.
-52
Answer:
-5² can be written as,
-5² = -5 × -5 = 25
Question 51.
25
Answer:
![]()
Lesson 3.2 Linear Functions
Essential Question
How can you determine whether a function is linear or non-linear?
Answer:
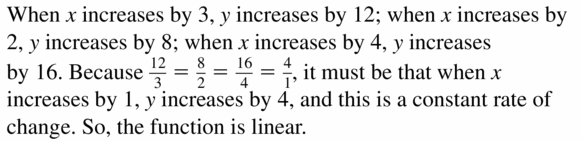
If there is a constant change in x and y, then it would be a linear function otherwise it would not represent a linear function. There is a constant change in x values. i.e., there is not a constant change in y.
EXPLORATION 1
Finding Patterns for Similar Figures
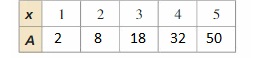
Work with a partner. Copy and complete each table for the sequence of similar figures. (In parts (a) and (b), use the rectangle shown.) Graph the data in each table. Decide whether each pattern is linear or nonlinear. Justify your conclusion.
a. perimeters of similar rectangles
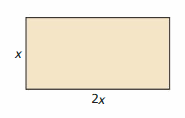
Answer:
length = 2x
width = x
The perimeter of the rectangle (P) = 2 (Length + Width)
P = 2 (x + 2x)
P = 2 (3x)
P = 6x
The completed table for the perimeters of similar rectangles is
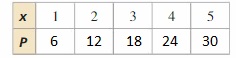
The representation of the perimeters of the similar rectangles in the coordinate plane is:
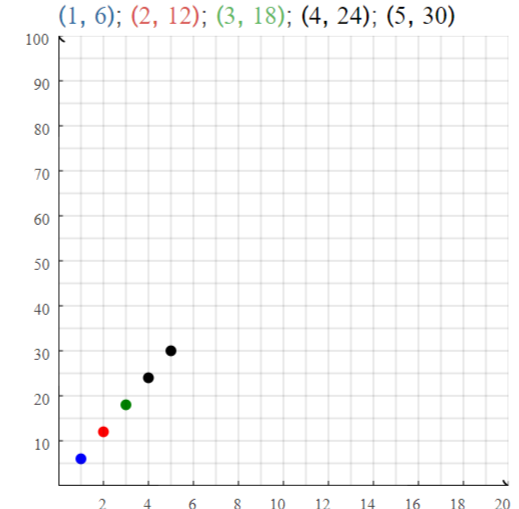
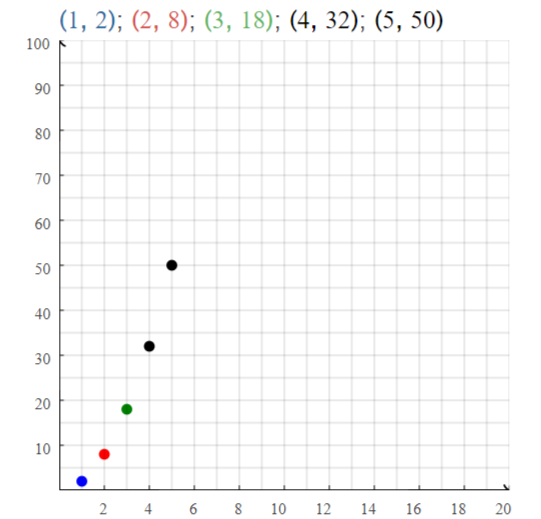
b. areas of similar rectangles
Answer:
length = 2x
width = x
Area of the rectangle (A) = Length × Width
A = x × (2x)
A = 2x²
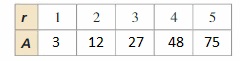
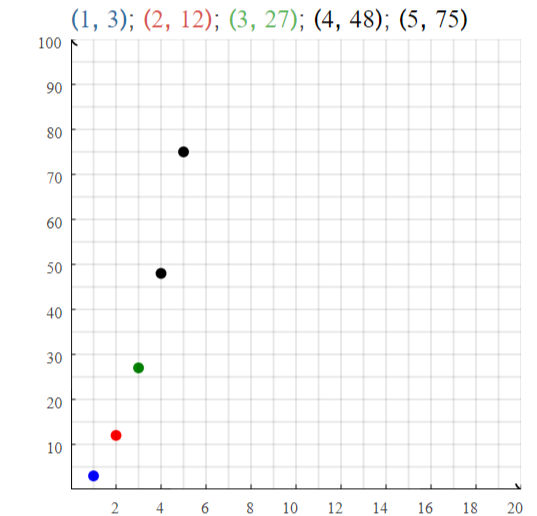
c. circumferences of circles of radius r
Answer:
The circumference of the circle = 2πr
Take the value of π as 3
d. areas of circles of radius r
Answer:
The area of the circle = πr²
Take the value of π as 3
Communicate Your Answer
Question 2.
How do you know that the patterns you found in Exploration 1 represent functions?
Answer:
We can observe that from the vertical test, only one point passes through each vertical line i.e., each input has only 1 output
Our observation coincides with the definition of the function.
The given patterns in Exploration 1 represent functions.
Question 3.
How can you determine whether a function is linear or nonlinear?
Answer:
y = mx + c
Check to see if your equation has exponents.
If it has exponents, it is nonlinear.
If your equation has no exponents, it is linear.
Question 4.
Describe two real-life patterns: one that is linear and one that is nonlinear. Use patterns that are different from those described in Exploration 1.
Answer:
The distance you travel when you go for a jog, you can graph the function and make some assumptions with only two points. The slope of a function is the same as the rate of change for the dependent variable (y), For instance, if you’re graphing distance Vs
The real-life pattern that is non-linear is:
Triangulation of GPS signals
Example:
A device like your cellphone receives signals from GPS satellites, which have known orbital positions around the Earth.
3.2 Lesson
Monitoring Progress
Does the graph or table represent a linear or nonlinear function? Explain.
Question 1.
Answer:
The graph represents a straight line
The straight line will be in the form of y = mx + c or y = mx
where,
m is the slope-intercept
The given graph is a linear function
Question 2.
Answer:
The graph is not a straight line it means that it is not linear
The given graph is a non-linear function.
Question 3.
Answer:
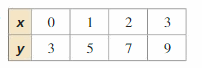
1 – 0 = 1
5 – 3 = 2
There is a constant difference of 1 between the values of x and there is a constant difference of 2 between the values of y
The difference is constant for both the values of x and y
The given table is a linear function.
Question 4.
Answer:
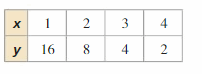
There is a constant difference of 1 between the values of x and there is a constant ratio of 2 between the values of y.
The operations are different between the values of x and y.
The given table is a non-linear function.
Does the equation represent a linear or nonlinear function? Explain.
Question 5.
y = x + 9
Answer:
Given,
y = x + 9
The standard representation of the linear function is y = mx + c
The given equation is a linear function
Question 6.
y = \(\frac{3 x}{5}\)
Answer:
Given,
y = \(\frac{3 x}{5}\)
5y = 3x
3x – 5y = 0
y = \(\frac{3}{5}\)x + 0
The standard representation of a linear function is y = mx + c
The given function is a linear function
Question 7.
y = 5 – 2x²
Answer:
Given,
y = 5 – 2x²
The standard representation of a linear function is y = mx + c
The given function is a non-linear function
Question 8.
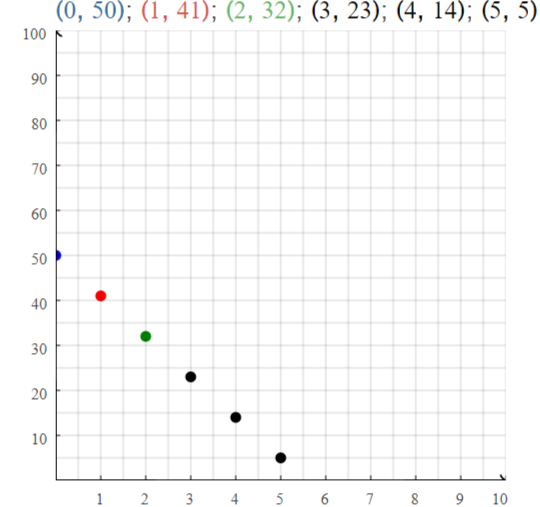
The linear function m = 50 – 9d represents the amount m (in dollars) of money you have after buying d DVDs.
(a) Find the domain of the function. Is the domain discrete or continuous? Explain.
Answer:
Given,
The linear function m = 50 – 9d represents the amount m (in dollars) of money you have after buying d DVDs.
m = 50 – 9d
Where,
m is the amount in dollars you have after buying d DVDs
m is the dependent variable
d is the independent variable
Let
d = 0, 1, 2, 3, 4, 5……
m = 50 – 9 (0) = 50
m = 50 – 9 (1) = 41
m = 50 – 9 (2) = 32
m = 50 – 9 (3) = 23
m = 50 – 9 (4) = 14
m = 50 – 9 (5) = 5
m = 50 – 9 (6) = -4
The domain of the given linear function is 0, 1, 2, 3, 4, and 5 [ Since from 6, -ve values are coming and the money will not be -ve ]
The domain is discrete.
(b) Graph the function using its domain.
Answer:
The domain of the given function is 0, 1, 2, 3, 4, and 5
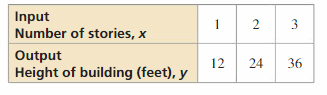
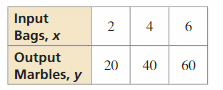
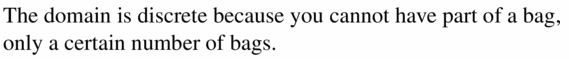
Question 9.
Is the domain discrete or continuous? Explain.
Answer:
The ordered pairs are
(1, 12), (2, 24), (3, 36)
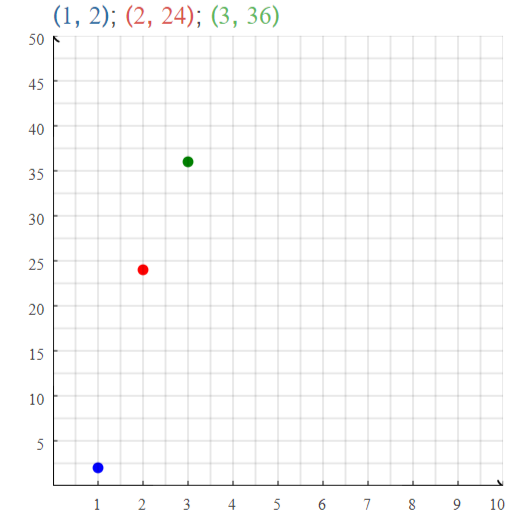
We can say that the points are scattered or discrete and they are unconnected
The domain for the given table is discrete
Question 10.
A 20-gallon bathtub is draining at a rate of 2.5 gallons per minute. The number g of gallons remaining is a function of the number m of minutes.
a. Does this situation represent a linear function? Explain.
Answer:
Given,
A 20-gallon bathtub is draining at a rate of 2.5 gallons per minute.
The number g of gallons remaining is a function of the number m of minutes.
The number g of gallons remaining is a function of the number m of minutes.
From the property of linear function, the change will be constantly increasing or decreasing.
g = 20 – 2.5x
The given situation is a linear function
b. Find the domain of the function. Is the domain discrete or continuous? Explain.
Answer:
The domain of the function = \(\frac{Total volume of the bathtub}{The rate of draining}\)
= \(\frac{20}{2.5}\)
= \(\frac{200}{25}\)
= 8
The domain of the function is: 0 ≤ x ≤ 8
The domain is continuous.
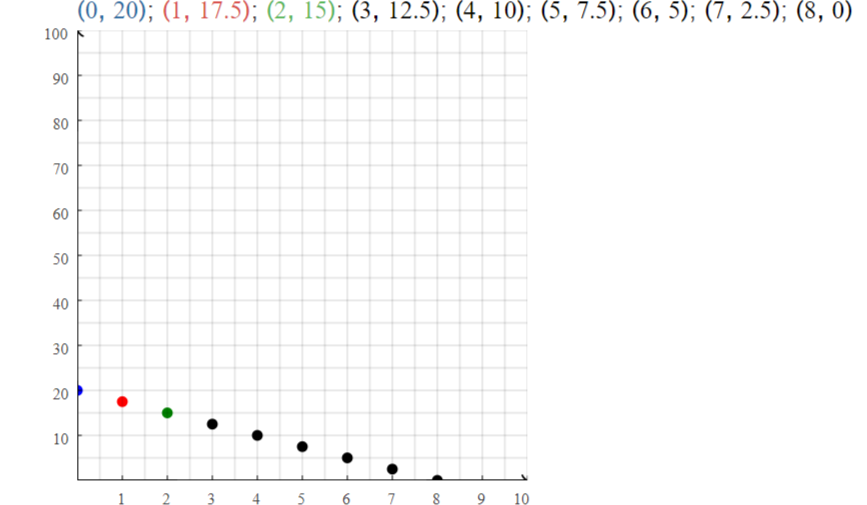
c. Graph the function using its domain.
Answer:
g = 20 – 2.5x
The domain is 0 ≤ x ≤ 8
g = 20 – 2.5 (0) = 20
g = 20 – 2.5 (1) = 17.5
g = 20 – 2.5 (2) = 15
g = 20 – 2.5 (3) = 12.5
g = 20 – 2.5 (4) = 10
g = 20 – 2.5 (5) = 7.5
g = 20 – 2.5 (6) = 5
g = 20 – 2.5 (7) = 2.5
g = 20 – 2.5 (8) = 0
Write a real-life problem to fit the data shown in the graph. Is the domain of the function discrete or continuous? Explain.
Question 11.
Answer:
An escalator moves upwards at a constant rate of 1 step/minute.
What is the rate escalator moves upwards after 8 minutes?
We can say that the points are connected
The domain of the function is continuous
Question 12.
Answer:
If one company offers to pay you $450 per week and the other offers $10 per hour, and both ask you to work 40 hours per week, which company is offering the better rate of pay?
We can see that the points are connected.
Thus the domain is continuous.
Linear Functions 3.2 Exercises
Vocabulary and Core Concept Check
Question 1.
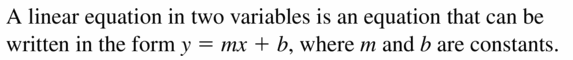
COMPLETE THE SENTENCE
A linear equation in two variables is an equation that can be written in the form ________, where m and b are constants.
Answer:
Question 2.
VOCABULARY
Compare linear functions and nonlinear functions.
Answer:
A Linear function has a constant rate of change, while a non-linear function does not have a constant rate of change.
Example for linear function:
y = 2x + 3
Example for nonlinear function:
y = 6x³
Question 3.
VOCABULARY
Compare discrete domains and continuous domains.
Answer:
Question 4.
WRITING
How can you tell whether a graph shows a discrete domain or a continuous domain?
Answer:
A graph that shows a discrete domain is a set of points not connected between them, while a graph that shows a continuous domain is a continuous curve.
A Discrete domain is a set of input values that consists of only certain numbers in an interval.
A continuous domain is a set of input values that consists of all numbers in an interval.
Sometimes, the set of points that represent the solutions of an equation are distinct, and other times the points are connected.
Monitoring Progress and Modeling with Mathematics
In Exercises 5–10, determine whether the graph represents a linear or nonlinear function. Explain.
Question 5.
Answer:
![]()
Question 6.
Answer:
![]()
Question 7.
Answer:
![]()
Question 8.
Answer:
![]()
Question 9.
Answer:
![]()
Question 10.
Answer:
![]()
In Exercises 11–14, determine whether the table represents a linear or nonlinear function. Explain.
Question 11.
Answer:

Question 12.
Answer:
The difference between all the values of x is 2 which is a constant through all the values of x.
The difference between all the values of y is not constant.
Since the difference between all the values of y is not constant.
The function is a non-linear function
Question 13.
Answer:

Question 14.
Answer:
The difference between all the values of x is +1 throughout all the values of x
The difference between all the values of y is -15 throughout all the values of y
Since the differences are constant for all the values of x and y,
The function is a linear function.
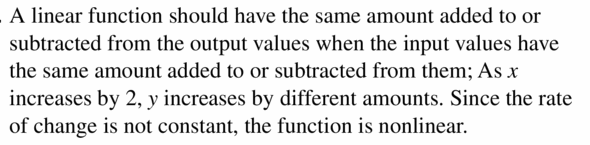
ERROR ANALYSIS
In Exercises 15 and 16, describe and correct the error in determining whether the table or graph represents a linear function.
Question 15.
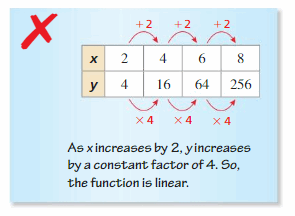
Answer:
Question 16.
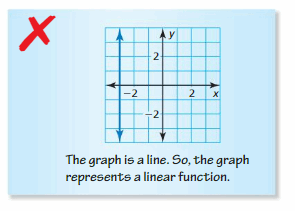
Answer:
Each line passes through one point and the given graph is a straight line.
The given graph is a linear function.
In Exercises 17–24, determine whether the equation represents a linear or nonlinear function. Explain.
Question 17.
y = x2 + 13
Answer:

Question 18.
y = 7 – 3x
Answer:
y = 7 – 3x
The standard representation of the linear function is
y = mx + c
The given equation is a linear function.
Question 19.
![]()
Answer:
Question 20.
y = 4x(8 – x)
Answer:
y = 4x (8 – x)
y = 4x (8) – 4x (x)
y = 32x – 4x²
The standard representation of the linear function is
y = mx + c
The given equation is not a linear function
Question 21.
2 + \(\frac{1}{6}\) y = 3x + 4
Answer:
Question 22.
y – x = 2x – \(\frac{2}{3}\)y
Answer:
y – x = 2x – \(\frac{2}{3}\)y
y + \(\frac{2}{3}\)y = 2x + x
\(\frac{3y}{3}\) + \(\frac{2y}{3}\) = 3x
\(\frac{5}{3}\)y = 3x
y = 3x × \(\frac{3}{5}\)
y = \(\frac{9}{5}\)x + 0
The standard representation of the linear function is
y = mx + c
The given equation is a linear function
Question 23.
18x – 2y = 26
Answer:
Question 24.
2x + 3y = 9xy
Answer:
2x + 3y = 9xy
2x = 9xy – 3y
2x = y (9x – 3)
y = \(\frac{2}{9x – 3}\)x
The standard representation of the linear function is
y = mx + c
The given equation is not a linear function
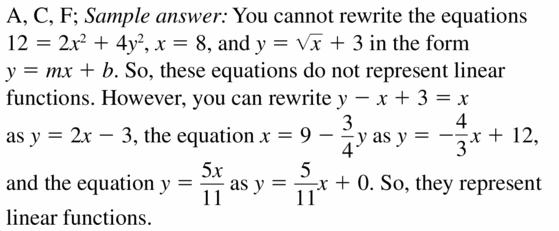
Question 25.
CLASSIFYING FUNCTIONS
Which of the following equations do not represent linear functions? Explain.
A. 12 = 2x2 + 4y2
B. y – x + 3 = x
C. x = 8
D. x = 9 – \(\frac{3}{4}\)y
E. y = \(\frac{5x}{11}\)
F = \(\sqrt{x}\) + 3
Answer:
Question 26.
USING STRUCTURE
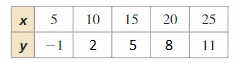
Fill in the table so it represents a linear function.
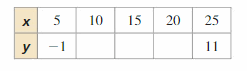
Answer:
The difference between all the values of x is 5 which is a constant.
To find the difference between all the values of y which is a constant, we have to use the trial and error method.
If we add +1 to -1 and continue adding +1 to all the values of y, then
-1 + 1 = 0
0 + 1 = 1
1 + 1 = 2
2 + 1 = 3
But the last value is: 11
If we add +2 to -1 and continue adding +2 to all the values of y, then
-1 + 2 = 1
1 + 2 = 3
3 + 2 = 5
5 + 2 = 7
But the last value is: 11
If we add +3 to -1 and continue adding +3 to all the values of y, then
-1 + 3 = 2
2 + 3 = 5
5 + 3 = 8
8 + 3 = 11
The last value is also: 11
We have to add +3 to make all the values of y constant so that the given table represents a linear function
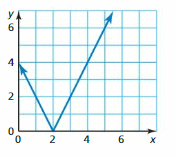
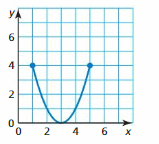
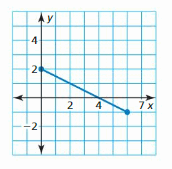
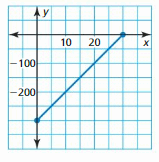
In Exercises 27 and 28, find the domain of the function represented by the graph. Determine whether the domain is discrete or continuous. Explain.
Question 27.
Answer:
Question 28.
Answer:
The domain is defined as the range of all the values of x
The domain is 0, 1, 2, 3, 4, 5, 6, and 7
The domain of the given graph is 0, 1, 2, 3, 4, 5, 6, and 7
In Exercises 29–32, determine whether the domain is discrete or continuous. Explain.
Question 29.
Answer:
Question 30.
Answer:
The difference between the values of x is 1 which is constant throughout all of the values of x
The difference between the values of y is 3 which is constant throughout all of the values of y
The difference is constant for both the values of x and y
The domain of the table is continuous.
Question 31.
Answer:

Question 32.
Answer:
The difference between all the values of x is 1 which is a constant
The difference between all the values of y is 4 which is a constant
Since the difference between all the values of x and y is constant
The given function is a linear function
The domain of the given function is continuous
ERROR ANALYSIS
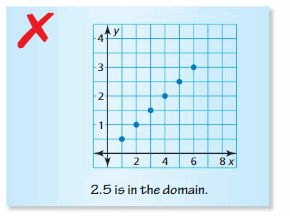
In Exercises 33 and 34, describe and correct the error in the statement about the domain. 33. xy214324682.5 is in the domain.
Question 33.
Answer:
Question 34.
Answer:
The domain is the range of all the values of x
The domain of the given function is 0, 1, 2, 3, 4, 5, and 6
The domain of the given graph is continuous because there are not any unconnected points in the graph.
Question 35.
MODELING WITH MATHEMATICS
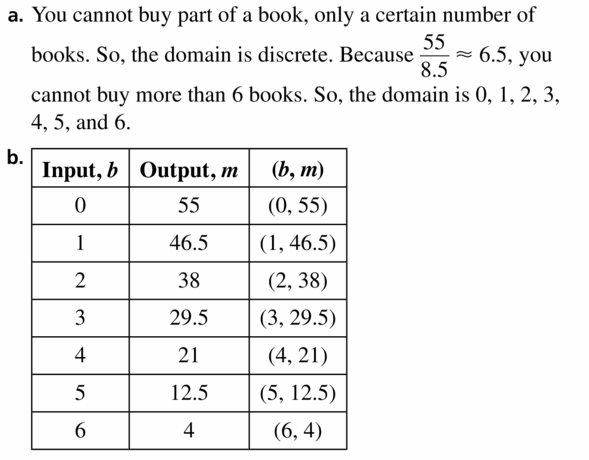
The linear function m = 55 – 8.5b represents the amount m (in dollars) of money that you have after buying b books.
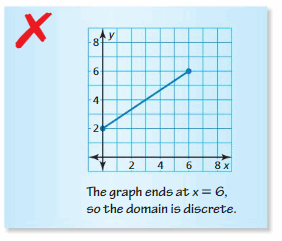
a. Find the domain of the function. Is the domain discrete or continuous? Explain.
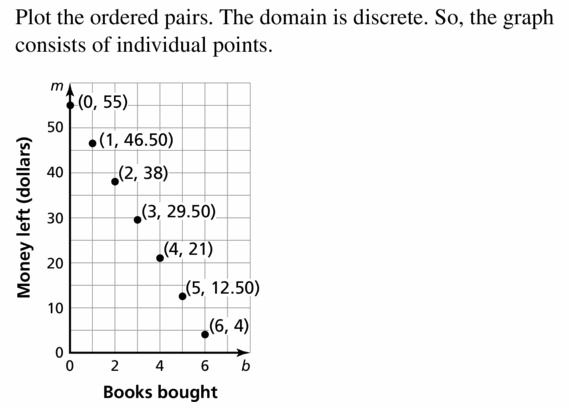
b. Graph the function using its domain.

Answer:
Question 36.
MODELING WITH MATHEMATICS
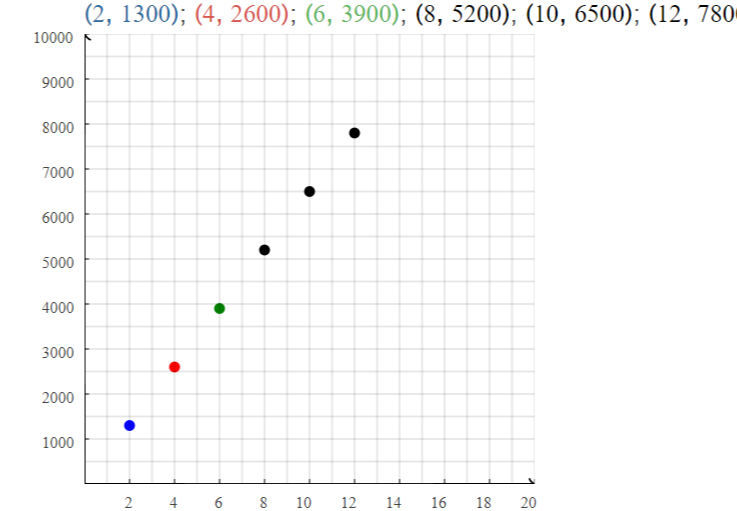
The number y of calories burned after x hours of rock climbing is represented by the linear function y = 650x.
a. Find the domain of the function. Is the domain discrete or continuous? Explain.
b. Graph the function using its domain.

Answer:
a. The number y of calories burned after x hours of rock climbing is represented by the linear function
y = 650x
x is the number of hours
The domain of the given function is
1 ≤ x ≤ 24
The domain of the function is inequality
The domain of the function is continuous
b. y = 650x
The domain of the function is: 1 ≤ x ≤ 24
y = 650 (1) = 650
y = 650 (2) = 1300
y = 650 (3) = 1950…..
y = 650 (12) = 7800
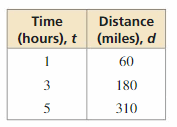
Question 37.
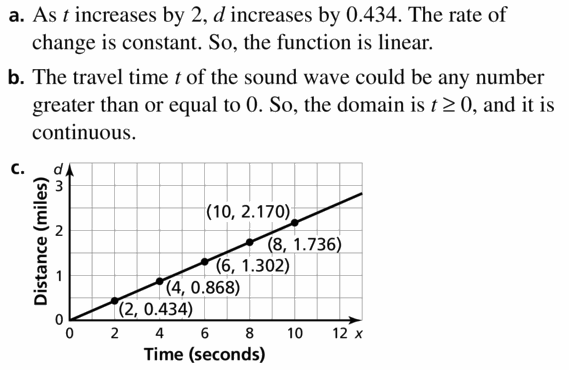
MODELING WITH MATHEMATICS
You are researching the speed of sound waves in dry air at 86°F. The table shows the distances d (in miles) sound waves travel in t seconds.
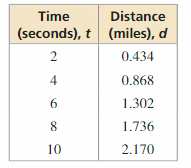
a. Does this situation represent a linear function? Explain.
b. Find the domain of the function. Is the domain discrete or continuous? Explain.
c. Graph the function using its domain.
Answer:
Question 38.
MODELING WITH MATHEMATICS
The function y = 30 + 5x represents the cost y (in dollars) of having your dog groomed and buying x extra services.

a. Does this situation represent a linear function? Explain.
Answer:
y = 30 + 5x
The standard representation of the linear function is y = mx + c
Compare the given function with the standard representation
The given situation represents a linear function
b. Find the domain of the function. Is the domain discrete or continuous? Explain.
Answer:
y = 30 + 5x
Where,
y is the amount in dollars
x is the cost of extra grooming services
The maximum number of given extra grooming services is 5
We can use extra grooming service or not
The domain of the given function is 0 ≤ x ≤ 5
The domain of the function is continuous
c. Graph the function using its domain.
Answer:
y = 30 + 5x
The domain of the function is 0 ≤ x ≤ 5
y = 30 + 5(0) = 30
y = 30 + 5 (1) = 35
y = 30 + 5(2) = 40
y = 30 + 5 (3) = 45
y = 30 + 5 (4) = 50
y = 30 + 5 (5) = 55
WRITING In Exercises 39–42, write a real-life problem to fit the data shown in the graph. Determine whether the domain of the function is discrete or continuous. Explain.
Question 39.
Answer:
Question 40.
Answer:
The temperature of a country in the winter season falls by 2°C
The domain of the graph is continuous as there are not any unconnected points.
Question 41.
Answer:
Question 42.
Answer:
The number of ants in a colony increases by 2 times per day. So, the number of ants increases by how many times in 5 days?
The domain of the given graph is continuous since there is not any unconnected point in the graph.
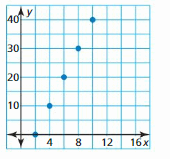
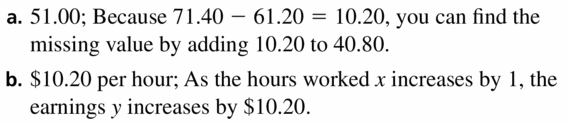
Question 43.
USING STRUCTURE
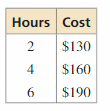
The table shows your earnings y (in dollars) for working x hours.
a. What is the missing y-value that makes the table represent a linear function?
b. What is your hourly pay rate?
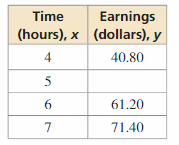
Answer:
Question 44.
MAKING AN ARGUMENT
The linear function d = 50t represents the distance d (in miles) Car A is from a car rental store after t hours. The table shows the distances Car B is from the rental store.
a. Does the table represent a linear or nonlinear function? Explain.
Answer:
The values of x increase at a constant rate of 2 but the value of y increases by 120 1st time and by 130 2nd time
We can observe that for the constant difference of the values of x, there is no constant difference of the values of y
The table is a linear function
b. Your friend claims Car B is moving at a faster rate. Is your friend correct? Explain.
Answer:
The function represented by car A is
d = 50t
The function represented by car B is
We can say that the distance traveled by car A increases at a constant rate whereas the distance traveled by car B increases at a random rate
The car B is moving at a faster rate when we observe the above table
MATHEMATICAL CONNECTIONS
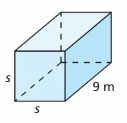
In Exercises 45–48, tell whether the volume of the solid is a linear or nonlinear function of the missing dimension(s). Explain.
Question 45.
Answer:
Question 46.
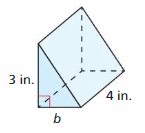
Answer:
The volume of a prism = Area × height
= Length × Width × Height
The volume of a prism (V) =3 × b × 4
V = 12b
Compare the above volume with y = mx + c
V = 12b + 0
The equation represents a Linear function
Question 47.
Answer:
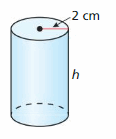
Question 48.
Answer:
The volume of a cone = \(\frac{1}{3}\) πr²h
The volume of a cone (V) = \(\frac{1}{3}\) × \(\frac{22}{7}\) × r² × 15
V = 770r²
y = mx + c
But, the given equation is not in the form of y = mx + c
The equation represents a non-linear function
Question 49.
REASONING
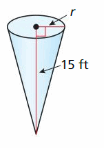
A water company fills two different-sized jugs. The first jug can hold x gallons of water. The second jug can hold y gallons of water. The company fills A jugs of the first size and B jugs of the second size. What does each expression represent? Does each expression represent a set of discrete or continuous values?
a. x + y
b. A + B
c. Ax
d. Ax + By

Answer:
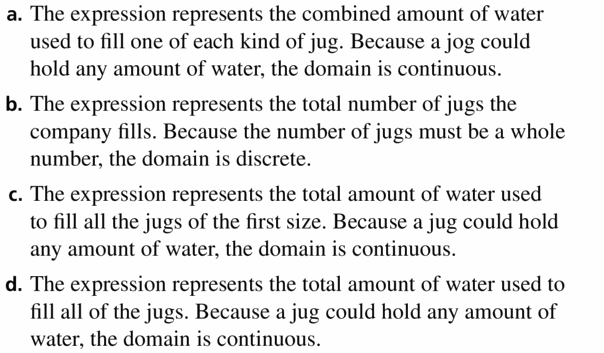
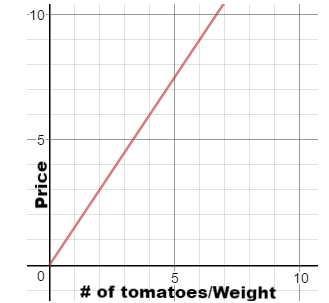
Question 50.
THOUGHT-PROVOKING
You go to a farmer’s market to buy tomatoes. Graph a function that represents the cost of buying tomatoes. Explain your reasoning.
Answer:
You go to a farmer’s market to buy tomatoes.
To draw the graph that represents the cost of buying tomatoes,
Cost of tomatoes ∝ Quantity or weight of tomatoes
∝ represents the direct relation. In a graph, this relation can be represented in a straight line
Question 51.
CLASSIFYING A FUNCTION
Is the function represented by the ordered pairs linear or nonlinear? Explain your reasoning.
(0, 2), (3, 14), (5, 22), (9, 38), (11, 46)
Answer:
Question 52.
HOW DO YOU SEE IT?
You and your friend go running. The graph shows the distances you and your friend run.
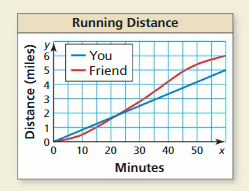
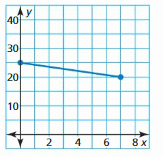
a. Describe your run and your friend’s run. Who runs at a constant rate? How do you know? Why might a person not run at a constant rate?
Answer:
The running represented by you is a straight line
The running represented by your friend is not a straight line
A straight line has a constant rate
You run at a constant rate and your friend does not run at a constant rate.
b. Find the domain of each function. Describe the domains using the context of the problem.
Answer:
The domain is defined as the range of the values of x
The domain of the function related to you is 0 ≤ x ≤ 50
The domain of the function related to your friend is 0 ≤ x ≤ 50
WRITING
In Exercises 53 and 54, describe a real-life situation for the constraints.
Question 53.
The function has at least one negative number in the domain. The domain is continuous.
Answer:
Question 54.
The function gives at least one negative number as an output. The domain is discrete.
Answer:
When you go on a world tour and for some days, you stayed in Antarctica,
The temperatures in Antarctica is at a negative temperature around the year and only for some months in the year, the temperature will be positive
Maintaining Mathematical Proficiency
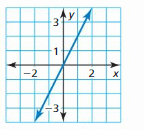
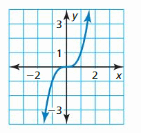
Tell whether x and y show direct variation. Explain your reasoning.
Question 55.
Answer:
Question 56.
Answer:
It is a straight line and passes through the origin
x and y shows direct variation
Question 57.
Answer:

Evaluate the expression when x = 2.
Question 58.
6x + 8
Answer:
6x + 8
x = 2,
6x + 8 = 6 (2) + 8
= 12 + 8 = 20
Question 59.
10 – 2x + 8
Answer:
Question 60.
4(x + 2 – 5x)
Answer:
4 (x + 2 – 5x)
x = 2,
4 (x + 2 – 5x) = 4 (2 + 2 – 5 (2) )
= 4 (4 – 10 )
= 4 (-6) = -24
Question 61.
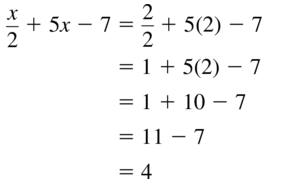
\(\frac{x}{2}\) + 5x – 7
Answer:
Lesson 3.3 Function Notation
Essential Question
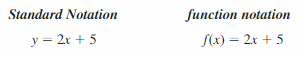
How can you use function notation to represent a function?
The notation f(x), called function notation, is another name for y. This notation is read as “the value of f at x” or “f of x.” The parentheses do not imply multiplication. You can use letters other than f to name a function. The letters g, h, j, and k are often used to name functions.
EXPLORATION 1
Matching Functions with Their Graphs
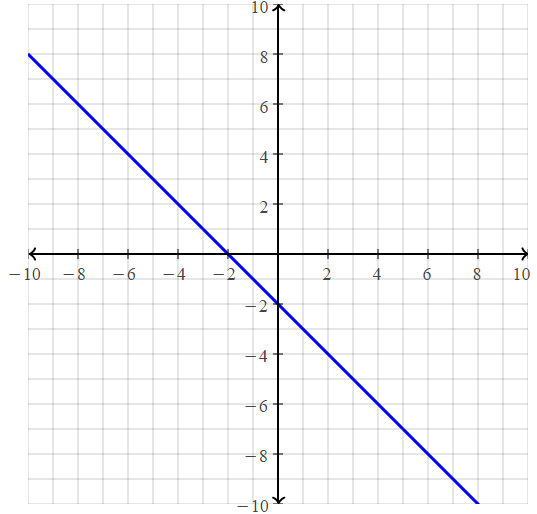
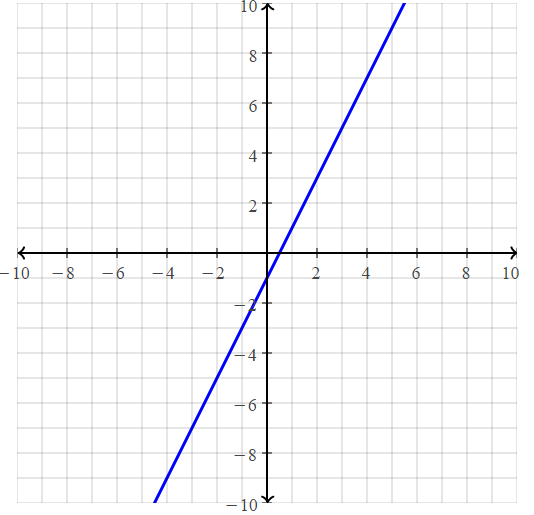
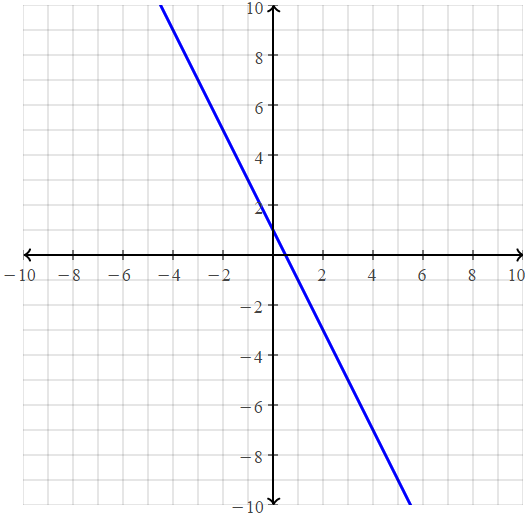
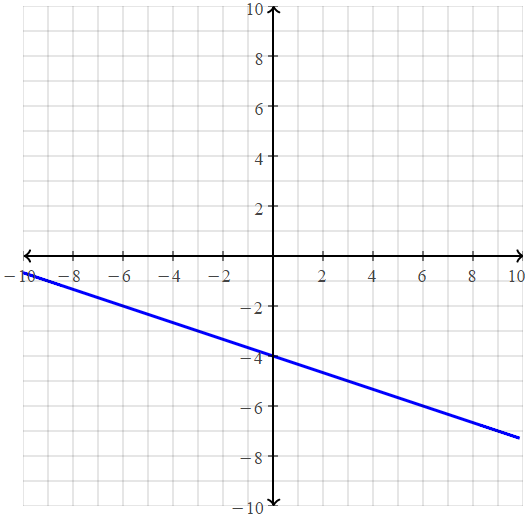
Work with a partner. Match each function with its graph.
a. f (x) = 2x – 3
b. g(x) = -x + 2
c. h(x) = x2 – 1
d. j(x) = 2x2 – 3
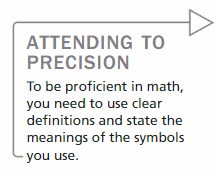
Answer:
a. f(x) = 2x – 3
We can conclude that graph B) matches this equation
b. f(x) = 2x – 3
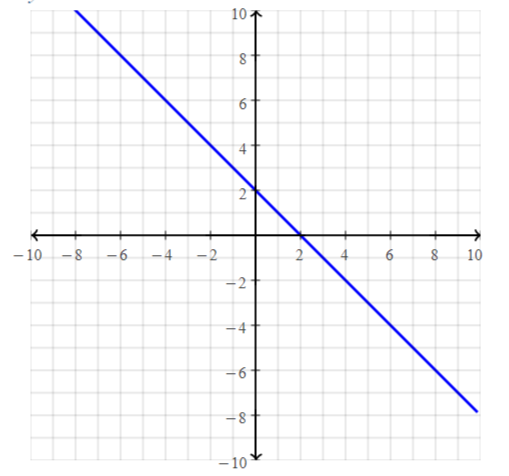
We can conclude that graph D) matches this equation
c. h(x) = x² – 1
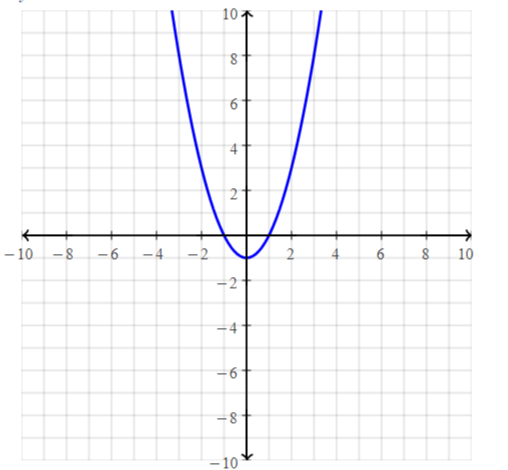
We can conclude that graph A) matches this equation
d. j(x) = 2x² – 3
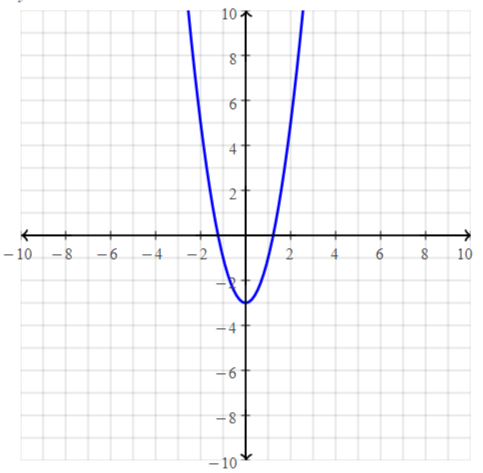
We can conclude that graph C) matches this equation
EXPLORATION 2
Evaluating a Function
Work with a partner. Consider the function
f(x) = -x + 3.
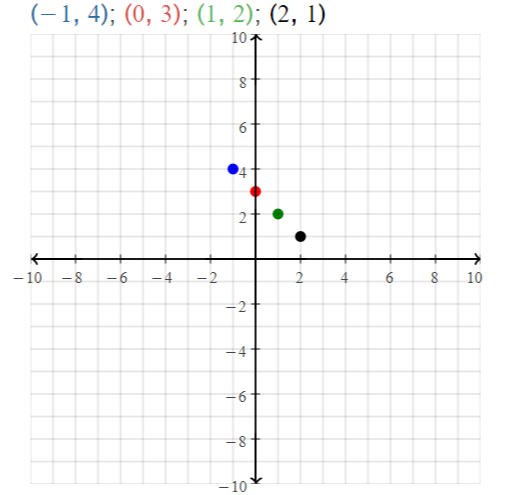
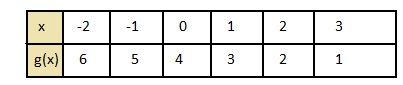
Locate the points (x, f(x)) on the graph. Explain how you found each point.
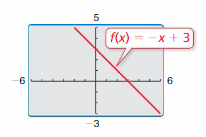
a. (-1, f(-1))
b. (0, f(0))
c. (1, f(1))
d. (2, f(2))
Answer:
f(x) = -x + 3
a. (-1, f(-1)) = (-1, [-(-1) + 3]) = (-1, 4)
b. (0, f(0)) = (0, [0 + 3]) = (0, 3)
c. (1, f(1)) = (1, [-1 + 3]) = (1, 2)
d. (2, f(2)) = (2, [-2 + 3]) = (2, 1)
(-1, 4), (0, 3), (1, 2), (2, 1)
Communicate Your Answer
Question 3.
How can you use function notation to represent a function? How are standard notation and function notation similar? How are they different?
Answer:
The standard notation and function notation are similar in the way of simplification
Difference between Function notation and standard notation:
The representation of function notation largely depends on the number of variables present in the function
Example:
f(x,y) = 2xy + 3
f(x) = x + 3
The representation of the standard notation does not depend on the number of variables present in the equation.
3.3 Lesson
Monitoring Progress
Evaluate the function when x = −4, 0, and 3.
Question 1.
f(x) = 2x – 5
Answer:
f(x) = 2x – 5
When x = -4,
f(-4) = 2 (-4) – 5 = -8 – 5 = -13
When x = 0,
f(0) = 2 (0) – 5 = 0 – 5 = -5
When x = 3,
f(3) = 2 (3) – 5 = 6 – 5 = 1
Question 2.
g(x) = -x – 1
Answer:
g(x) = -x – 1
When x = -4,
g(-4) = -[-4] – 1 = 4 – 1 = 3
When x = 0,
g(0) = 0 – 1 = -1
When x = 3,
g(3) = -3 – 1 = -4
Question 3.
WHAT IF? In Example 2, let f(t) be the outside temperature (°F) t hours after 9 A.M. Explain the meaning of each statement.
a. f(4) = 75
b. f(m) = 70
c. f(2) = f(9)
d. f(6) > f(0)
Monitoring Progress
Find the value of x so that the function has the given value.
Question 4.
f(x) = 6x + 9; f(x) = 21
Answer:
f(x) = 6x + 9 with f(x) = 21
21 = 6x + 9
6x = 21 – 9
6x = 12
x = 12 / 6
x = 2
Question 5.
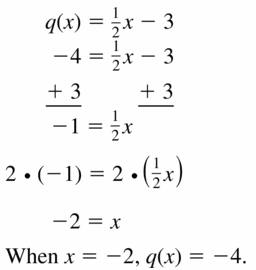
g(x) = \(-\frac{1}{2}\)x + 3; g(x) = -1
Answer:
g(x) = \(-\frac{1}{2}\)x + 3 with g(x) = -1
-1 = \(-\frac{1}{2}\)x + 3
\(-\frac{1}{2}\)x = -1 – 3
\(-\frac{1}{2}\)x = -4
–\(\frac{1}{2}\)x = -4
\(\frac{1}{2}\)x = 4
x = 2(4)
x = 8
Graph the linear function.
Question 6.
f(x) = 3x – 2
Answer:
f(x) = 3x – 2
put the values -2, -1, 0, 1, 2 in the place of x and find the values of f(x) to plot a graph
f(-2) = 3 (-2) – 2 = -6 – 2 = -8
f(-1) = 3(-1) – 2 = -3 – 2 = -5
Hence,
The representation of the given function in the coordinate plane is:
Question 7.
g(x) = -x + 4
Answer:
g(x) = -x + 4
put the values -2, -1, 0, 1, 2 in the place of x and find the values of f(x) to plot a graph
g(-2) = -[-2] + 4 = 2 + 4 = 6
g(-1) = -[-1] + 4 = 4 + 1 = 5
Question 8.
h(x) = \(-\frac{3}{4}\)x – 1
Answer:
h(x) = \(-\frac{3}{4}\)x – 1
put the values -2, -1, 0, 1, 2 in the place of x and find the values of f(x) to plot a graph
h(-2) = \(-\frac{3}{4}\) (-2) – 1
= \(\frac{3}{2}\) – 1
= \(\frac{1}{2}\)
h(-1) = \(-\frac{3}{4}\) (-1) – 1
= \(\frac{3}{4}\) – 1
= \(-\frac{1}{4}\)
Question 9.
WHAT IF?
Let f(x) = 250 – 75x represent the second flight, where f(x) is the number of miles the helicopter is from its destination after x hours. Which flight takes less time? Explain.
Function Notation 3.3 Exercises
Vocabulary and Core Concept Check
Question 1.
COMPLETE THE SENTENCE
When you write the function y = 2x + 10 as f(x) = 2x + 10, you are using ______________.
Answer:
Question 2.
REASONING
Your height can be represented by a function h, where the input is your age. What does h(14) represent?
Answer:
Your height can be represented by a function h, where the input is your age
h (14) means you are 14 years old
Monitoring Progress and Modeling with Mathematics
In Exercises 3–10, evaluate the function when x = –2, 0, and 5.
Question 3.
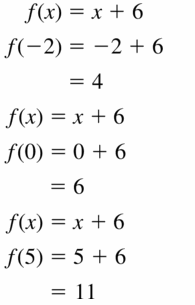
f(x) = x + 6
Answer:
Question 4.
g(x) = 3x
Answer:
g (x) = 3x
x = -2,
g (-2) = 3 (-2) = -6
x = 0,
g (0) = 3 (0) = 0
x = 5,
g (5) = 3 (5) = 15
The values of g (x) when x = -2, 0, 5 is: -6, 0, and 15
Question 5.
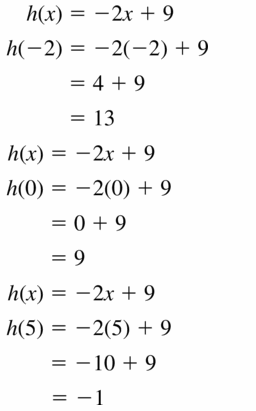
h(x) = -2x + 9
Answer:
Question 6.
r(x) = -x – 7
Answer:
r (x) = -x – 7
x = -2,
r (-2) = -[-2] – 7
= 2 – 7 = -5
x = 0,
r (0) = 0 – 7 = -7
x = 5,
r (5) = -5 – 7 = -12
The values of r (x) when x = 0, -2, 5 is -5, -7, and -12
Question 7.
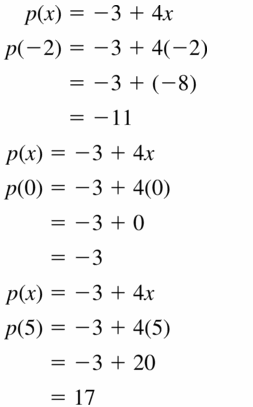
p(x) = -3 + 4x
Answer:
Question 8.
b(x) = 18 – 0.5x
Answer:
b (x) = 18 – 0.5x
x = -2,
b (-2) = 18 – 0.5 (-2)
= 18 + 1 = 19
x = 0,
b (0) = 18 – 0.5 (0) = 18
x = 5,
b (5) = 18 – 0.5 (5)
18 – 2.5 = 15.5
The values of b (x) when x = 0, -2, 5 is: 19, 18, and 15.5
Question 9.
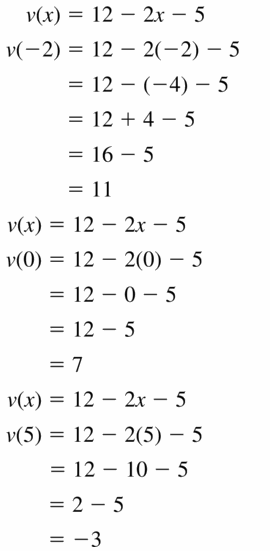
v(x) = 12 – 2x – 5
Answer:
Question 10.
n(x) = -1 – x + 4
Answer:
n (x) = -1 – x + 4
x = -2,
n (-2) = -1 – [-2] + 4
= -1 + 2 + 4
= 6 – 1
= 5
x = 0,
n (0) = -1 – 0 + 4
= -1 + 4 = 3
x = 2,
n (2) = -1 – 2 + 4
= 4 – 3
= 1
The values of n (x) when x = -2, 0, 5 is 5, 3, and 1
Question 11.
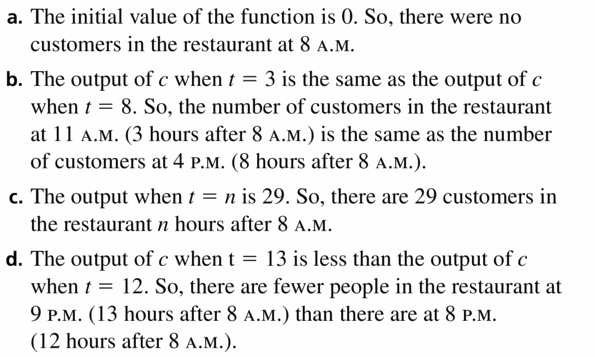
INTERPRETING FUNCTION NOTATION
Let c(t) be the number of customers in a restaurant t hours after 8 A.M. Explain the meaning of each statement.
a. c(0) = 0
b. c(3) = c(8)
c. c(n) = 29
d. c(13) < c(12)
Answer:
Question 12.
INTERPRETING FUNCTION NOTATION
Let H(x) be the percent of U.S. households with Internet use x years after 1980. Explain the meaning of each statement.
a. H(23) = 55
b. H(4) = k
c. H(27) ≥ 61
d. H(17) + H(21) ≈ H(29)
Answer:
Let H (x) is the percent of U.S households with internet use x years after 1980
a. H (23) = 55
The meaning of the above function is
23 years after 1980, 55% of U.S households will be using the internet
b. H(4) = k
The meaning of the above function is
4 years after 1980, k% of U.S households will be using the internet
c. H(27) ≥ 61
The meaning of the above function is
27 years after 1980, more than 61% of U.S households will be using the internet
d. H(17) + H(21) ≈ H(29)
The meaning of the above function is
The percentage of U.S households using the internet after 29 years is equal to the sum of the percentage of households using the internet after 17 years and 21 years
In Exercises 13–18, find the value of x so that the function has the given value.
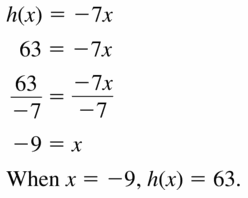
Question 13.
h(x) = -7x; h(x) = 63
Answer:
Question 14.
t(x) = 3x; t(x) = 24
Answer:
t (x) = 3x with t (x) = 24
24 = 3x
x = 24 / 3
x = 8
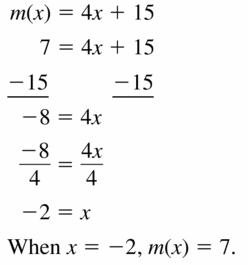
Question 15.
m(x) = 4x + 15; m(x) = 7
Answer:
Question 16.
k(x) = 6x – 12; k(x) = 18
Answer:
k (x) = 6x – 12 with k (x) = 18
6x – 12 = 18
6x = 12 + 18
6x = 30
x = 30 / 6
x = 5
Question 17.
q(x) = \(\frac{1}{2}\)x – 3; q(x) = -4
Answer:
Question 18.
j(x) = –\(\frac{4}{5}\)x + 7; j(x) = -5
Answer:
j (x) = –\(\frac{4}{5}\)x + 7 with j (x) = -5
-5 = –\(\frac{4}{5}\)x + 7
-5 – 7 = –\(\frac{4}{5}\)x
–\(\frac{4}{5}\)x = -12
\(\frac{4}{5}\)x = 12
x = 12 × –\(\frac{5}{4}\)
x = 15
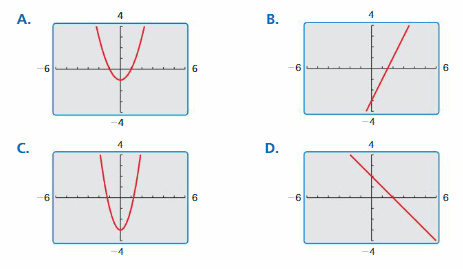
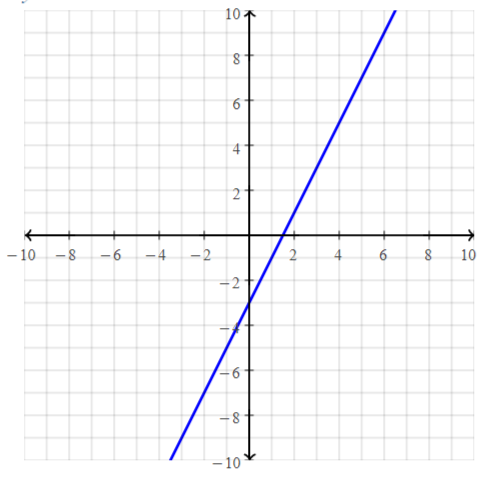
In Exercises 19 and 20, find the value of x so that f(x) = 7.
Question 19.
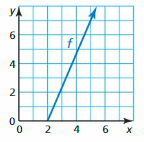
Answer:
![]()
Question 20.
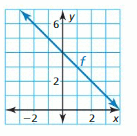
Answer:
f (x) = 7
y = f (x)
y = 7
x = -2
f (x) = 7 is (-2, 7)
Question 21.
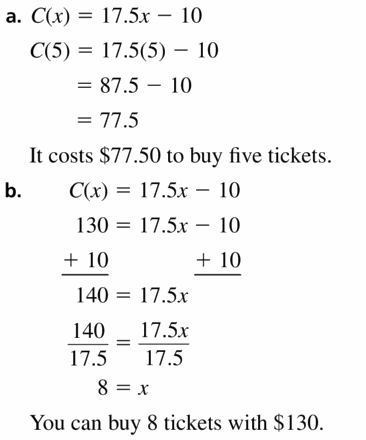
MODELING WITH MATHEMATICS
The function C(x) = 17.5x – 10 represents the cost (in dollars) of buying x tickets to the orchestra with a $10 coupon.
a. How much does it cost to buy five tickets?
b. How many tickets can you buy for $130?
Answer:
Question 22.
MODELING WITH MATHEMATICS
The function d(t) = 300,000t represents the distance (in kilometers) that light travels in t seconds.
a. How far does light travel in 15 seconds?
b. How long does it take light to travel 12 million kilometers?

Answer:
d (t) = 300,000t
a. The distance traveled by light in 15 seconds is
d (15) = 300,000 (15) = 4,500,000 kilometers
b. Given that the total distance traveled by light is 12 million kilometers
d (t) = 12 million kilometers
12,000,000 = 300,000 (t)
t = 12,000,000 / 300,000
t = 40 seconds
In Exercises 23–28, graph the linear function.
Question 23.
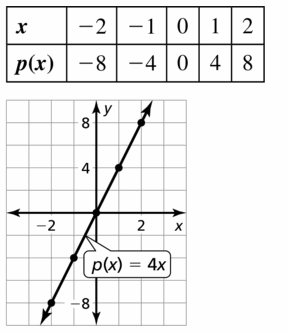
p(x) = 4x
Answer:
Question 24.
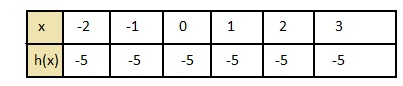
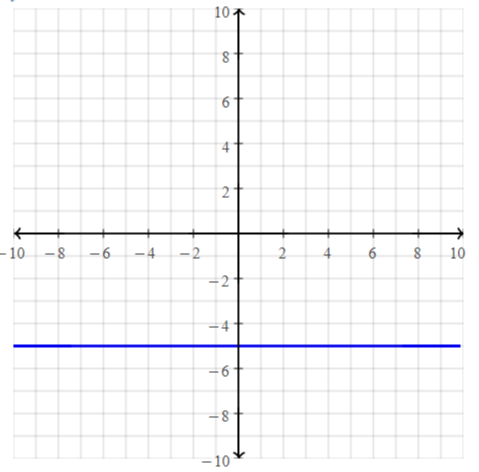
h(x) = -5
Answer:
h (x) = -5
put the values -2, -1, 0, 1, 2 in the place of x and find the values of f(x) to plot a graph
Question 25.
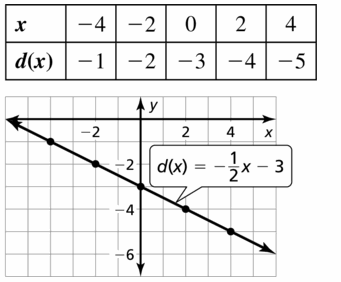
d(x) = \(-\frac{1}{2} x\) – 3
Answer:
Question 26.
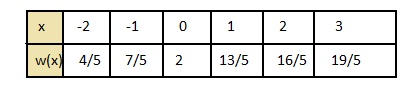
w(x) = \(\frac{3}{5} x\) + 2
Answer:
w (x) = \(\frac{3}{5} x\) + 2
w (x) = \(\frac{3}{5}\) x + 2
put the values -2, -1, 0, 1, 2 in the place of x and find the values of f(x) to plot a graph
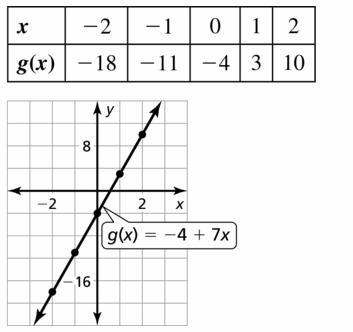
Question 27.
g(x) = -4 + 7x
Answer:
Question 28.
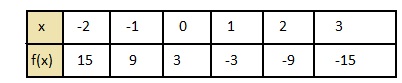
f(x) = 3 – 6x
Answer:
f (x) = 3 – 6x
put the values -2, -1, 0, 1, 2 in the place of x and find the values of f(x) to plot a graph
Question 29.
PROBLEM-SOLVING
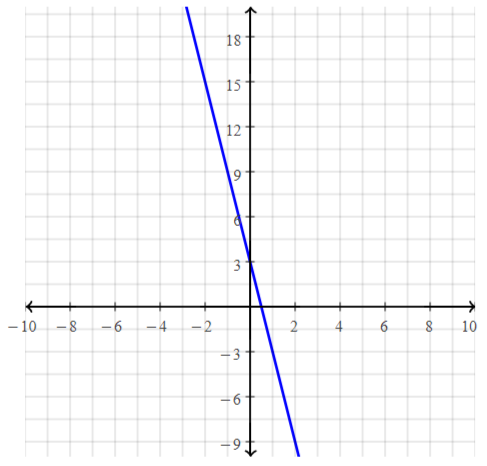
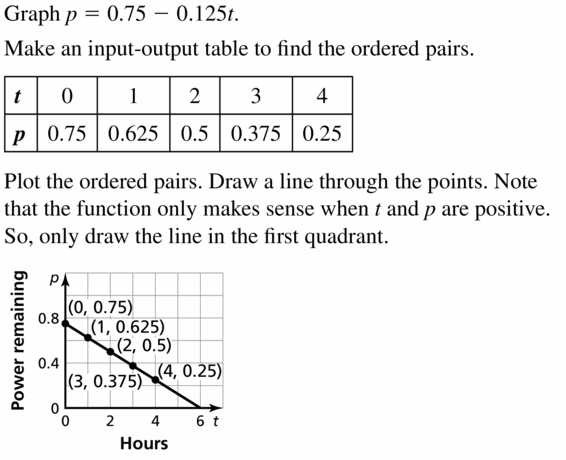
The graph shows the percent p(in decimal form) of battery power remaining in a laptop computer after t hours of use. A tablet computer initially has 75% of its battery power remaining and loses 12.5% per hour. Which computer’s battery will last longer? Explain.
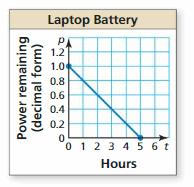
Answer:
Question 30.
PROBLEM-SOLVING
The function C(x) = 25x + 50 represents the labor cost (in dollars) for Certified Remodeling to build a deck, where x is the number of hours of labor. The table shows sample labor costs from its main competitor, Master Remodeling. The deck is estimated to take 8 hours of labor. Which company would you hire? Explain.
Answer:
C(x) = 25x + 50
represents the labor cost (in dollars) for certified Remodeling to build a deck
Where,
x is the number of hours of labor.
The table shows the sample labor costs from its main competitor, Master Remodeling.
It is also given that the deck is estimated to take 8 hours of labor.
We can observe that the competitor ‘Master Remodeling’ completes the deck in 6 hours whereas, for certified Remodeling, it will take 8 hours of labor to complete a deck thereby increasing the cost. i.e., the value of C(x) also increases when compared to the Master Remodeling
We choose “Master Remodeling” Company
Question 31.
MAKING AN ARGUMENT
Let P(x) be the number of people in the U.S. who own a cell phone x years after 1990. Your friend says that P(x + 1) > P(x) for any x because x + 1 is always greater than x. Is your friend correct? Explain.
Answer:
Question 32.
THOUGHT-PROVOKING
Let B(t) be your bank account balance after t days. Describe a situation in which B(0) < B(4) < B(2).
Answer:
B (0) < B (4) < B (2)
Sunday – Day 0
Monday -Day 1
Tuesday -Day 2
Wednesday – Day 3
Thursday – Day 4
Friday – Day 5
Saturday – Day 6
A man named A works at a company where he receives his salary every Tuesday (Day 2) of a normal week. He then spends some of his salary paying bills on Thursday (Day 4). On Sunday, he decides to spend all of his remaining salary on food, groceries, and transportation allowance for the following week
Question 33.
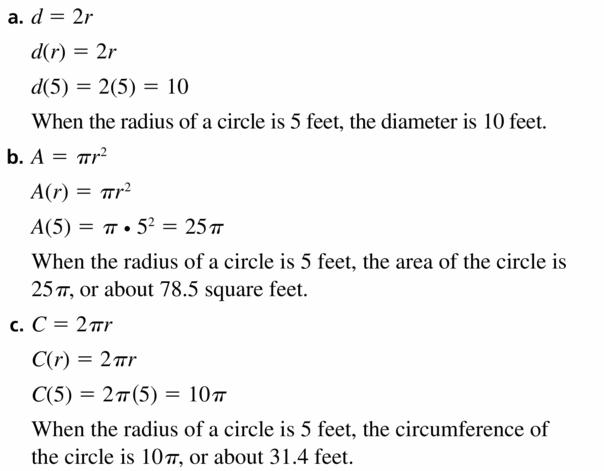
MATHEMATICAL CONNECTIONS
Rewrite each geometry formula using function notation. Evaluate each function when r = 5 feet. Then explain the meaning of the result.
a. Diameter, d = 2r
b. Area, A = πr2
c. Circumference, C = 2πr
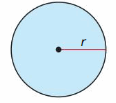
Answer:
Question 34.
HOW DO YOU SEE IT?
The function y = A(x) represents the attendance at a high school x weeks after a flu outbreak. The graph of the function is shown.
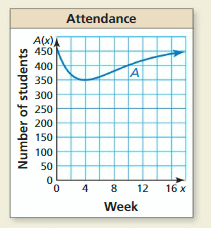
a. What happens to the school’s attendance after the flu outbreak?
Answer:
We can observe that after the flu outbreak, the school’s attendance first decreased and then again steadily increased
b. Estimate A(13) and explain its meaning.
Answer:
The function notation and the standard notations are similar
y = A (x)
y = A (13)
x = 13
To find the value of y or the given function, observe the graph for the value of y corresponding to the value of x i.e., 13
y = 430 [Approximately]
The estimation of A(13) is 430
c. Use the graph to estimate the solution(s) of the equation A(x) = 400. Explain the meaning of the solution(s).
Answer:
A (x) = 400
For the solution of the given equation i.e., the value of x,
Observe the location of 400 in the graph and its corresponding x-value
The value of x is 1
The solution of the given equation is 1
d. What was the least attendance? When did that occur?
Answer:
We can observe that there is deep depreciation in attendance i.e., least attendance of the students in a week
The least attendance of the students occurs in the 4th week
The least attendance of the students is 350
The week that has the least attendance is: 4th week
The students of the least attendance are 350 students
e. How many students do you think are enrolled at this high school? Explain your reasoning.
Answer:
We can observe that the y-axis represents the number of students enrolled in the high school
The highest number on the y-axis represents the total number of students enrolled in the high school
The total number of students in the high school is 450 students
Question 35.
INTERPRETING FUNCTION NOTATION
Let f be a function. Use each statement to find the coordinates of a point on the graph of f.
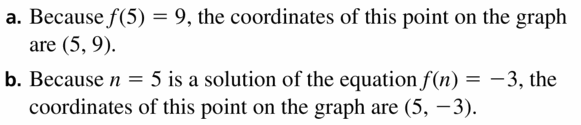
a. f(5) is equal to 9.
b. A solution of the equation f(n) = -3 is 5.
Answer:
Question 36.
REASONING
Given a function f, tell whether the statement f(a + b) = f(a) + f(b) is true or false for all inputs a and b. If it is false, explain why.
Answer:
f or f(x) = mx + c
Let,
a = 0 and b = 1
f( a + b ) = f (1)
f(1) = m + c
f(a) = f (0) = c
f (b) = f(1) = m + c
f (a + b) is not equal to f (a) + f(b)
Maintaining Mathematical Proficiency
Solve the inequality. Graph the solution. (Section 2.5)
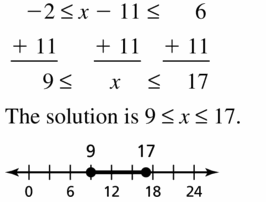
Question 37.
-2 ≤ x – 11 ≤ 6
Answer:
Question 38.
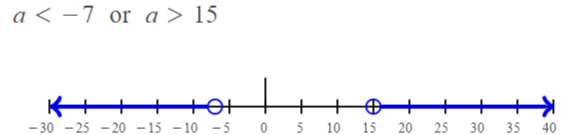
5a < -35 or a – 14 > 1
Answer:
5a < -35 or a – 14 > 1
a < -35 / 5 or a > 1 + 14
a < -7 or a > 15
The solutions of the given inequality are
a < -7 or a > 15
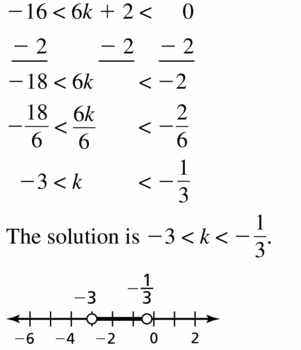
Question 39.
-16 < 6k + 2 < 0
Answer:
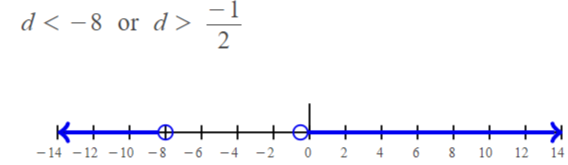
Question 40.
2d + 7 < -9 or 4d – 1 > -3
Answer:
2d + 7 < -9 or 4d – 1 > -3
2d < -9 – 7 or 4d > -3 + 1
2d < -16 or 4d > -2
d < -16 / 2 or d > -2 / 4
d < -8 or d > -1 / 2
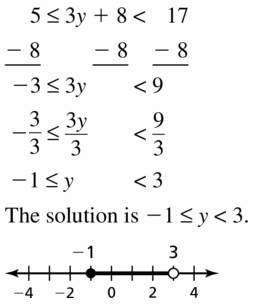
Question 41.
5 ≤ 3y + 8 < 17
Answer:
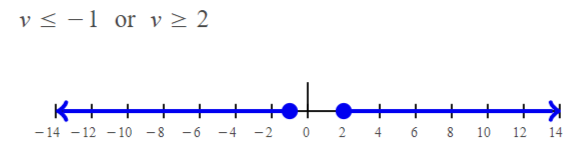
Question 42.
4v + 9 ≤ 5 or -3v ≥ -6
Answer:
4v + 9 ≤5 or -3v ≥ -6
4v ≤ 5 – 9 or 3v ≥ 6
4v ≤ -4 or v ≥ 6 / 3
v ≤ -4 / 4 or v ≥ 2
v ≤ -1 or v ≥ 2
Graphing Linear Functions Study Skills: Staying Focused During Class
Core Vocabulary
Core Concepts
Section 3.1
![]()
Section 3.2
![]()
Section 3.3
Using FunctionNotation, p. 122
Mathematical Practices
Question 1.
How can you use technology to confirm your answers in Exercises 40–43 on page 110?
Answer:
We know that,
| x | = x for x > 0
| x | = -x for x < 0
By using the above properties,
We can find the domain and the range of the given Exercises
We can confirm the answers in Exercises 40 – 43 on page 110
Question 2.
How can you use patterns to solve Exercise 43 on page 119?
Answer:
In Exercise 43 on page 119,
We can observe from the table that the difference between the values of x and y is constant
By using the above property, we can find the constant difference between the values of x and y to complete the pattern
Question 3.
How can you make sense of the quantities in the function in Exercise 21 on page 125?
Answer:
In Exercise 21 on page 125,
Compare the given function with the standard representation of the linear function y = mx + c
m is the cost of x tickets in dollars
c is the constant
f (x) or y is the function notation of Cost function
Study Skills
Staying Focused during Class
As soon as class starts, quickly review your notes from the previous class and start thinking about math.
Repeat what you are writing in your head.
When a particular topic is difficult, ask for another example.

Graphing Linear Functions 3.1 – 3.3 Quiz
Determine whether the relation is a function. Explain. (Section 3.1)
Question 1.
Answer:
Each input value has to match each output value
The given table is a function since each input value matches each output value
Question 2.
(-10, 2), (-8, 3), (-6, 5), (-8, 8), (-10, 6)
Answer:
(-10, 2), (-8, 3), (-6, 5), (-8, 8), (-10, 6)
A relation is said to be a function if each input matches with only 1 output
The input -8 comes 2 times
The given ordered pairs do not represent a function
Find the domain and range of the function represented by the graph. (Section 3.1)
Question 3.
Answer:
The domain is the set of all x-values
The range is the set of all y-values
The domain of the given graph is {0, 1, 2, 3, 4}
The range of the given graph is {1, -1, -3}
Question 4.

Answer:
The domain is the set of all x-values
The range is the set of all y-values
The domain of the given graph is {-1, -2, 1, 2}
The range of the given graph is {-2, -1, 0, 1, 2}
Question 5.
Answer:
The domain is the set of all x-values
The range is the set of all y-values
The domain of the given graph is {-3, -2, -1, 1, 2, 3}
The range of the given graph is {-1, 0, 1, 2, 3}
Determine whether the graph, table, or equation represents a linear or nonlinear function. Explain. (Section 3.2)
Question 6.
Answer:
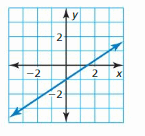
A linear function must always represent a straight line irrespective of whether the straight line passes through the origin or passes through any other point
The given graph is a linear function
Question 7.
Answer:
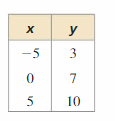
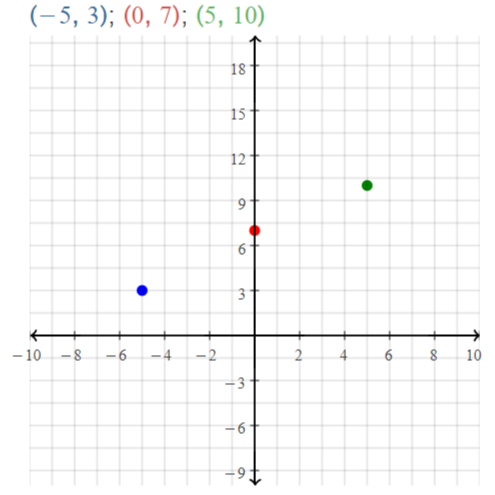
The representation of the values of x and y in the table in the form of ordered pairs is
(-5, 3), (0, 7), and (5, 10)
A linear function must always represent a straight line irrespective of whether the straight line passes through the origin or passes through any other point
The given table represents a linear function
Question 8.
y = x(2 – x)
Answer:
y = x (2 – x)
y = 2 (x) – x (x)
y = 2x – x²
The standard representation of the linear function is
y = mx + c
The given function is a non-linear function
Determine whether the domain is discrete or continuous. Explain. (Section 3.2)
Question 9.
Answer:
The values of x have specific values of y
The domain is defined as the set of all the values of x
The domain of the given table is discrete.
Question 10.
Answer:
The values of x have specific values of y
The domain is defined as the set of all the values of x
The domain of the given table is discrete
Question 11.
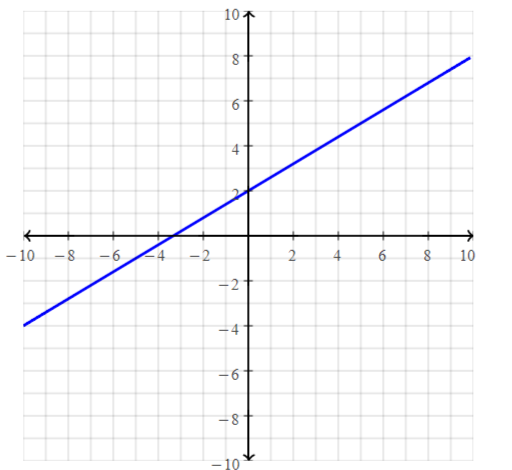
For w(x) = -2x + 7, find the value of x for which w(x) = -3. (Section 3.3)
Answer:
w (x) = -2x + 7 with w (x) = -3
-3 = -2x + 7
-2x = -3 – 7
-2x = -10
2x = 10
x = 10 / 5
x = 2
Graph the linear function. ( Section 3.3)
Question 12.
g(x) = x + 3
Answer:
g (x) = x + 3
put the values -2, -1, 0, 1, 2 in the place of x and find the values of f(x) to plot a graph
Question 13.
p(x) = -3x – 1
Answer:
p (x) = -3x – 1
put the values -2, -1, 0, 1, 2 in the place of x and find the values of f(x) to plot a graph
Question 14.
m(x) = \(\frac{2}{3}\)x
Answer:
m (x) = \(\frac{2}{3}\)x
put the values -2, -1, 0, 1, 2 in the place of x and find the values of f(x) to plot a graph
Question 15.
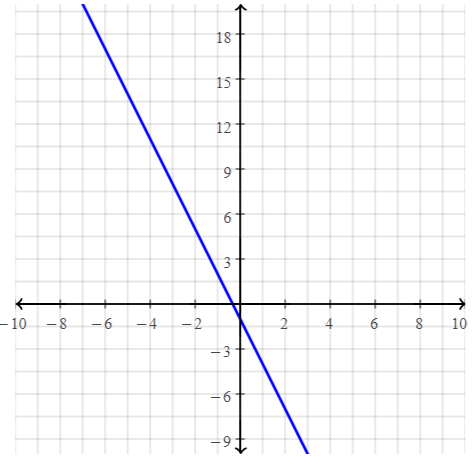
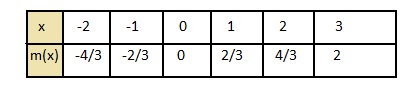
The function m = 30 – 3r represents the amount m (in dollars) of money you have after renting r video games. (Section 3.1 and Section 3.2)
a. Identify the independent and dependent variables.
Answer:
m = 30 – 3r
The independent variables are the values of x
The dependent variables are the values of y
y = mx + c
The independent variable of the given function is r
The dependent variable of the given function is m
b. Find the domain and range of the function. Is the domain discrete or continuous? Explain.
Answer:
m = 30 – 3r
put the values -2, -1, 0, 1, 2 in the place of x and find the values of f(x) to plot a graph
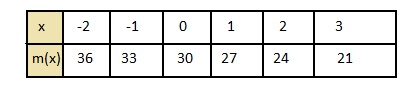
The domain is defined as the set of all the values of x
the range is defined as the set of all the values of y
The domain of the given function is {-2, -1, 0, 1, 2}
The range of the given function is {36, 33, 30, 27, 24, 21}
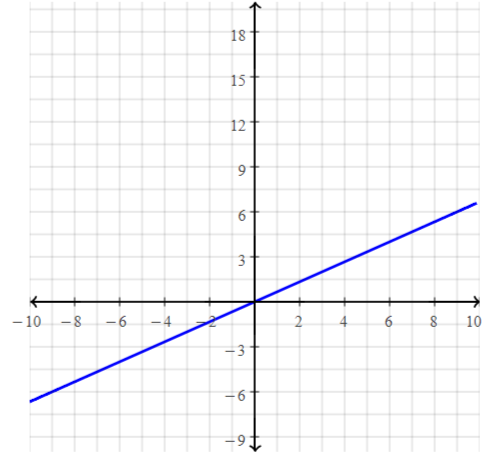
c. Graph the function using its domain.
Answer:
Question 16.
The function d(x) = 1375 – 110x represents the distance (in miles) a high-speed train is from its destination after x hours. (Section 3.3)
a. How far is the train from its destination after 8 hours?
Answer:
d (x) = 1375 – 110x
Where,
d (x) represents the distance (in miles)
x represents the time
d (x) = 1375 – 110 (8)
= 1375 – 880
= 495 miles
The distance traveled by train after 8 hours is 495 miles
b. How long does the train travel before reaching its destination?
Answer:
d (x) = 1375 – 110x
From part (a),
The distance traveled by train after 8 hours is 495 miles
495 = 1375 – 110x
110x = 1375 – 495
110x = 880
x = 880 /110
x = 8 hours
Lesson 3.4 Graphing Linear Equations in Standard Form
Essential Question
How can you describe the graph of the equation Ax + By = C?
Answer:
When A and B are not both zero,
The graph of Ax + By = C is always a line.
Divide both sides by B
Because the form Ax + By = C can describe any line,
It is called the standard form of an equation for a line.
EXPLORATION 1
Using a Table to Plot Points
Work with a partner. You sold a total of $16 worth of tickets to a fundraiser. You lost track of how many of each type of ticket you sold. Adult tickets are $4 each. Child tickets are $2 each.
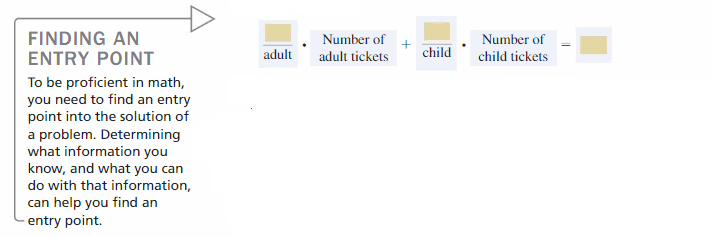
a. Let x represent the number of adult tickets. Let y represent the number of child tickets. Use the verbal model to write an equation that relates to x and y.
Answer:
Given,
You sold a total of $16 worth of tickets to a fundraiser. You lost track of how many of each type of ticket you sold. Adult tickets are $4 each.
Child tickets are $2 each.
Let x be the number of adult tickets
Let y be the number of child tickets
The total cost of tickets = (The cost of the child tickets + The cost of the adult tickets)
The total cost of tickets = (The number of children) × ( The cost of each child ticket ) + ( The numebr of adults ) × ( The cost of each adult ticket )
16 = 2x + 4y
2 (x + 2y) = 16
x + 2y = 16 / 2
x + 2y = 8
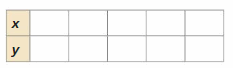
b. Copy and complete the table to show the different combinations of tickets you might have sold.
Answer:
x + 2y = 8
2y = 8 – x
y = \(\frac{8 – x}{2}\)
c. Plot the points from the table. Describe the pattern formed by the points.
Answer:
The completed table that shows the different combinations of tickets you might have sold is from part (b) is:
(1, 4), (2, 3), (3, 3), (4, 2), (5, 2)
The pattern drawn by the points is a straight line.
d. If you remember how many adult tickets you sold, can you determine how many child tickets you sold? Explain your reasoning.
Answer:
y = mx + c
Where,
y is the number of adult tickets
x is the number of child tickets
If we know the number of adult tickets you sold, i.e., the value of y, then we can find the number of child tickets, i.e., the value of x by putting the value of y in the equation
y = mx + c
If we know the number of adult tickets you sold, then we can find the number of child tickets you sold
EXPLORATION 2
Rewriting and Graphing an Equation
Work with a partner. You sold a total of $48 worth of cheese. You forgot how many pounds of each type of cheese you sold. Swiss cheese costs $8 per pound. Cheddar cheese costs $6 per pound.
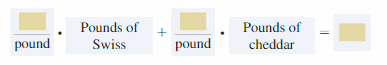
a. Let x represent the number of pounds of Swiss cheese. Let y represent the number of pounds of cheddar cheese. Use the verbal model to write an equation that relates to x and y.
Answer:
Given that you sold a total of $48 worth of cheese. You forgot how many pounds of each type of cheese you sold. Swiss cheese costs $8 per pound.
Cheddar cheese costs $6 per pound.
x represents the number of pounds of Swiss cheese
y represents the number of pounds of Cheddar cheese
The total cost = ( The cost of Swiss Cheese ) + ( The cost of Cheddar Cheese )
The total cost = ( The number of pounds of Swiss cheese ) × ( The cost of Swiss cheese ) + ( The number of pounds of Cheddar cheese ) × ( The cost of Cheddar cheese )
48 = 8x + 6y
8x + 6y = 48
2 (4x + 3y) = 48
4x + 3y = 48 / 4
4x + 3y = 12
b. Solve the equation for y. Then use a graphing calculator to graph the equation. Given the real-life context of the problem, find the domain and range of the function.
Answer:
4x + 3y = 12
3y = 12 – 4x
y = \(\frac{12 – 4x}{3}\)
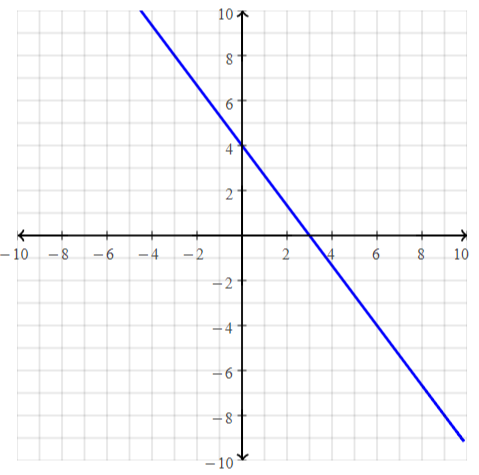
The domain is the set of all the values of x in the graph
The range is the set of all the values of y in the graph
The domain of the equation is { -4, -3, -2, -1, 0, 1, 2, 3 }
The range of the given equation is {-1, -2, -3, -4, -5, -6, -7, -8, -9, 5, 6, 7, 8, 9, 10}
c. The x-intercept of a graph is the x-coordinate of a point where the graph crosses the x-axis. The y-intercept of a graph is the y-coordinate of a point where the graph crosses the y-axis. Use the graph to determine the x- and y-intercepts.
Answer:
y = \(\frac{12 – 4x}{3}\)
Given that the x-intercept of a graph is the x-coordinate of a point where the graph crosses the x-axis. The y-intercept of a graph is the y-coordinate of a point where the graph crosses the y-axis.
The x-intercept is 3
The y-intercept is 4
d. How could you use the equation you found in part (a) to determine the x- and y-intercepts? Explain your reasoning.
Answer:
y = \(\frac{12 – 4x}{3}\)
We can obtain the x-intercept by making y term zero
We can obtain the y-intercept making x term zero
The x-intercept is
0 = \(\frac{12 – 4x}{3}\)
12 – 4x = 0
4x = 12
x = 12 / 4
x = 3
y = \(\frac{12 – 4(0)}{3}\)
y = 12 / 3
y = 4
e. Explain the meaning of the intercepts in the context of the problem.
Answer:
An intercept of any function is a point where the graph of the function crosses, or intercepts, the x-axis or y-axis. When the linear function is used to represent a real-world situation, the intercepts have significant meaning in the context of the problem.
Communicate Your Answer
Question 3.
How can you describe the graph of the equation Ax + By = C?
Answer:
When A and B are not both zero,
The graph of Ax + By = C is always a line.
Divide both sides by B
Because the form Ax + By = C can describe any line,
It is called the standard form of an equation for a line.
Question 4.
Write a real-life problem that is similar to those shown in Explorations 1 and 2.
Answer:
The age of A is twice the age of B and the sum of the twice the age of A and the age of B is 24
3.4 Lesson
Monitoring Progress
Question 1.
y = -2.5
Answer:
y = -2.5
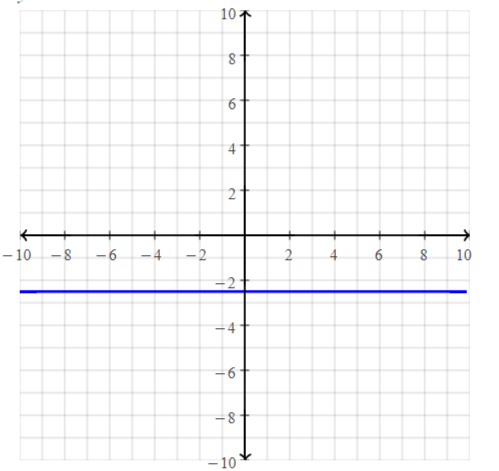
Question 2.
x = 5
Answer:
x = 5
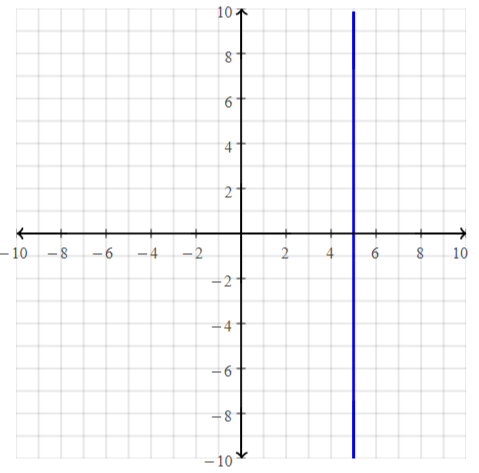
Use intercepts to graph the linear equation. Label the points corresponding to the intercepts.
Question 3.
2x – y = 4
Answer:
2x – y = 4
The standard form of the linear equation is
y = mx + c
y = 2x – 4
To find the value of the x-intercept, put y = 0
2x – 4 = 0
2x = 4
x = 4 / 2
x = 2
To find the value of the y-intercept, put x = 0
y = 2(0) – 4
y = -4
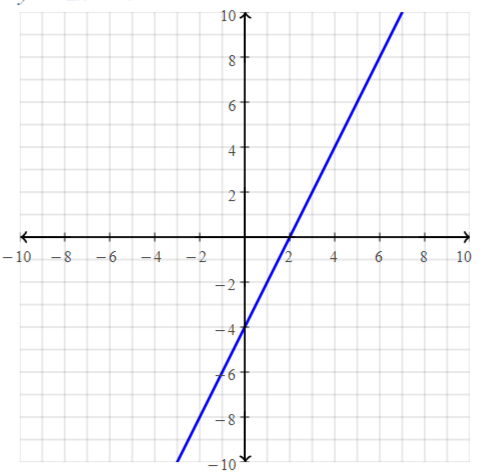
Question 4.
x + 3y = -9
Answer:
x + 3y = -9
The standard form of the linear equation is:
y = mx + c
3y = -9 – x
y = (-9 -x ) / 3
To find the value of x-intercept, put y = 0
-9 – x = 0
x = -9
To find the value of y-intercept, put x = 0
y = (-9 – 0) / 3
t = -9 / 3
y = -3
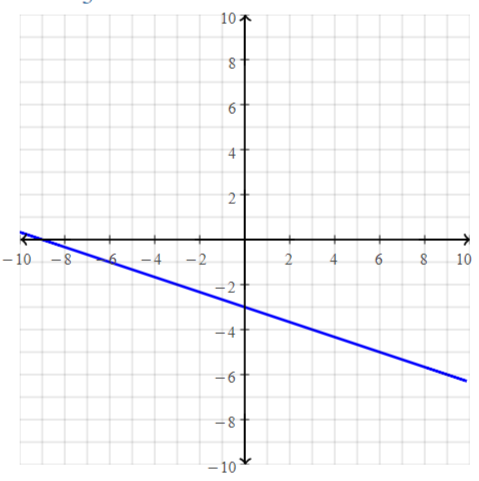
Question 5.
WHAT IF? You decide to rent tables from a different company. The situation can be modeled by the equation 4x + 6y = 180, where x is the number of small tables and y is the number of large tables. Graph the equation and interpret the intercepts.
Answer:
The given equation corresponding to the above situation is given as
4x + 6y = 180
Where,
x is the number of small tables
y is the number of large tables
The standard form of the linear equation is
y = mx + c
6y = 180 – 4x
y = (180 – 4x) / 6
To find the value of the x-intercept, put y = 0
180 – 4x = 0
4x = 180
x = 180 / 4
x = 45
To find the value of the y-intercept, put x = 0
y = (180 – 4(0) ) / 6
y = 180 / 6
y = 30
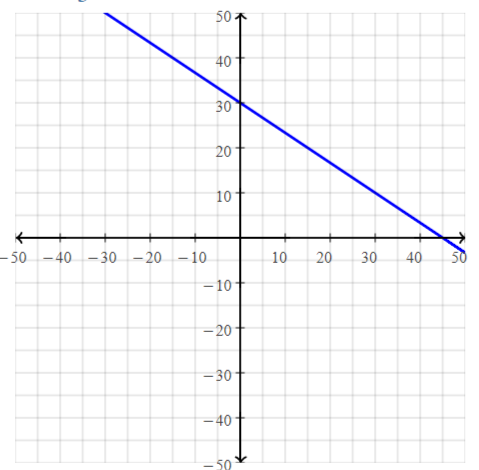
Graphing Linear Equations in Standard Form 3.4 Exercises
Vocabulary and Core Concept Check
Question 1.
WRITING
How are x-intercepts and y-intercepts alike? How are they different?
Answer:
Question 2.
WHICH ONE did DOESN’T BELONG?
Which point does not belong with the other three? Explain your reasoning.
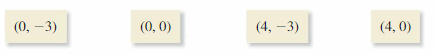
Answer:
(0, -3) belongs to the y-axis
(0, 0) belongs to the origin
(4, -3) does not belong either to the x-axis or y-axis
(4, 0) belongs to the x-axis
We can conclude that (4, -3) does not belong with the other three
Monitoring Progress and Modeling with Mathematics
In Exercises 3–6, graph the linear equation.
Question 3.
x = 4
Answer:
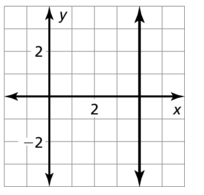
Question 4.
y = 2
Answer:
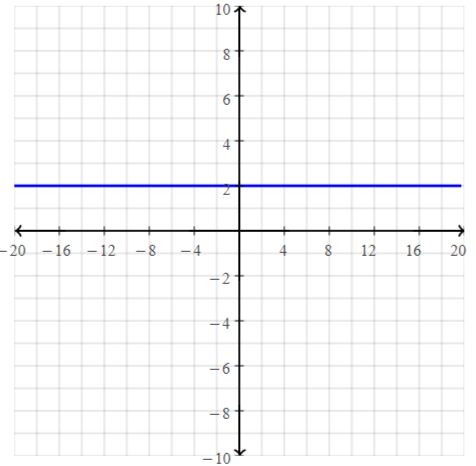
Question 5.
y = -3
Answer:
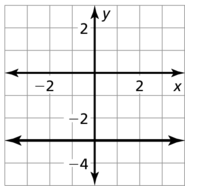
Question 6.
x = -1
Answer:
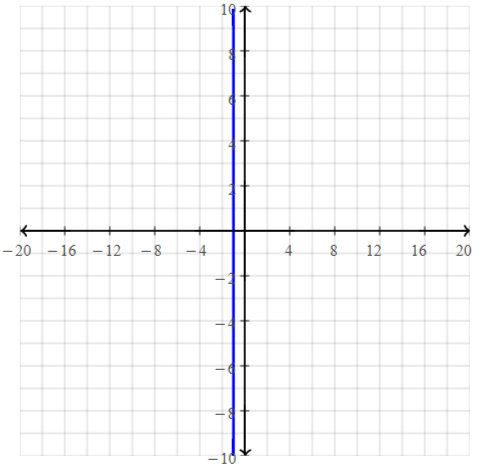
In Exercises 7–12, find the x- and y-intercepts of the graph of the linear equation.
Question 7.
2x + 3y = 12
Answer:
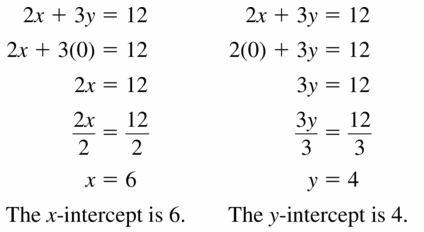
Question 8.
3x + 6y = 24
Answer:
3x + 6y = 24
To find the value of the x-intercept, put y = 0
3x + 0 = 24
3x = 24
x = 24 / 3
x = 8
To find the value of the y-intercept, put x = 0
0 + 6y = 24
6y = 24
y = 24 / 6
y = 4
The value of the x-intercept is: 8
The value of the y-intercept is: 4
Question 9.
-4x + 8y = -16
Answer:
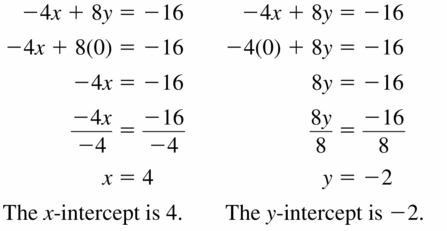
Question 10.
-6x + 9y = -18
Answer:
-6x + 9y = -18
To find the x-intercept, put y = 0
-6x + 0 = -18
-6x = -18
6x = 18
x = 18 / 6
x = 3
To find the y-intercept, put x = 0
0 + 9y = -18
9y = -18
y = -18 / 9
y = -2
The value of the x-intercept is 3
The value of the y-intercept is -2
Question 11.
3x – 6y = 2
Answer:
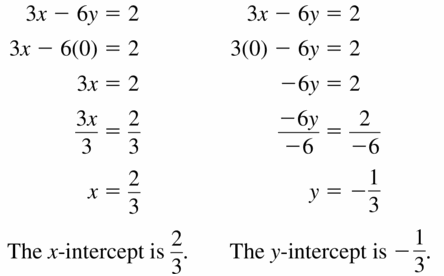
Question 12.
-x + 8y = 4
Answer:
-x + 8y = 4
To find the x-intercept, put y = 0
-x + 0 = 4
-x = 4
x = -4
To find the y-intercept, put x = 0
0 + 8y = 4
8y = 4
y = 4 / 8
y = 1 / 2
The value of the x-intercept is -4
The value of the y-intercept is 1/2
In Exercises 13–22, use intercepts to graph the linear equation. Label the points corresponding to the intercepts.
Question 13.
5x + 3y = 30
Answer:
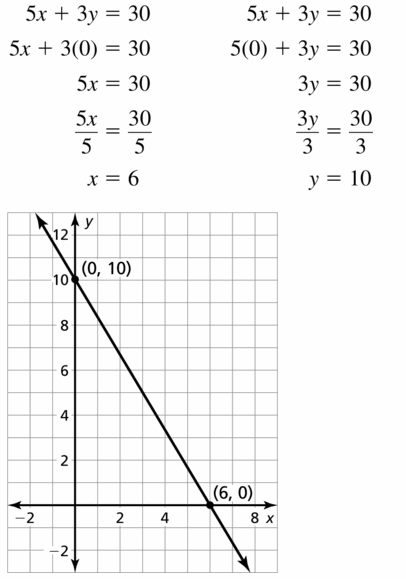
Question 14.
4x + 6y = 12
Answer:
4x + 6y = 12
To find the x-intercept, put y = 0
4x + 0 = 12
4x = 12
x = 12 / 4
x = 3
To find the y-intercept, put x = 0
0 + 6y = 12
6y = 12
y = 12 / 6
y = 2
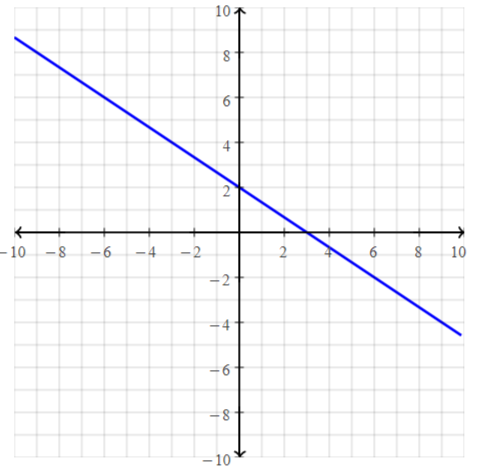
Question 15.
-12x + 3y = 24
Answer:
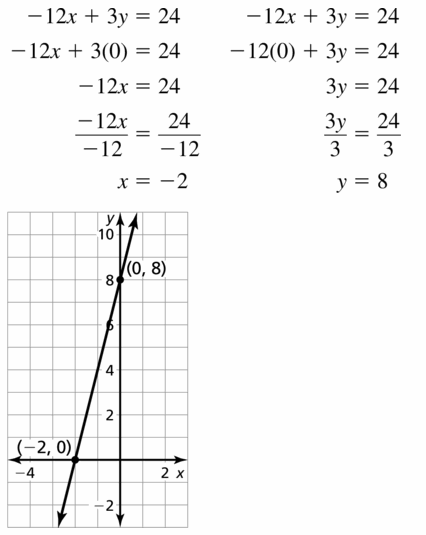
Question 16.
-2x + 6y = 18
Answer:
-2x + 6y = 18
To find the x-intercept, put y = 0
-2x + 0 = 18
-2x = 18
x = -18 / 2
x = -9
To find the y-intercept, put x = 0
0 + 6y = 18
6y = 18
y = 18 / 6
y = 3
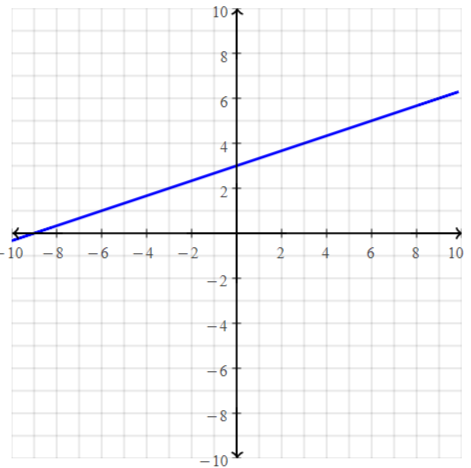
Question 17.
-4x + 3y = -30
Answer:
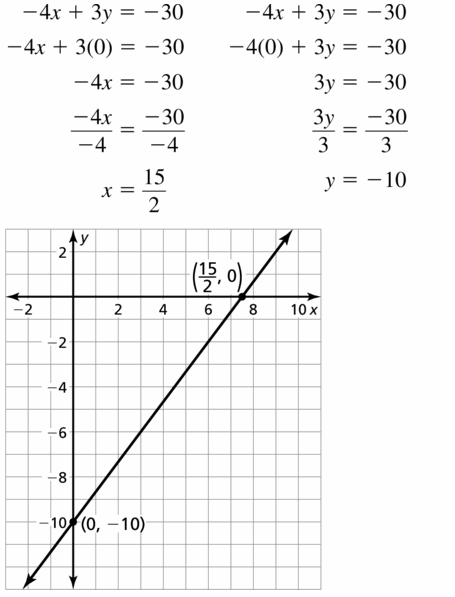
Question 18.
-2x + 7y = -21
Answer:
-2x + 7y = -21
To find the value of the x-intercept, put y = 0
-2x + 0 = -21
-2x = -21
2x = 21
x = 21/2
To find the value of the y-intercept, put x = 0
0 + 7y = -21
7y = -21
y = -21 / 7
y = -3
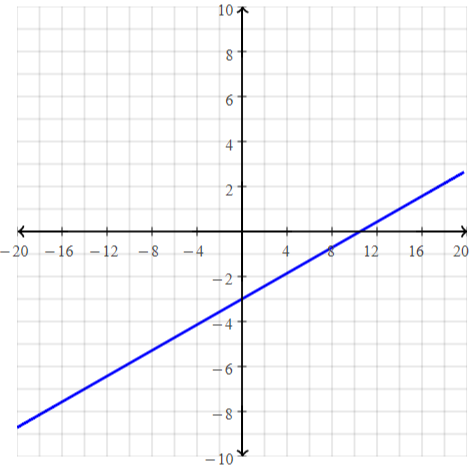
Question 19.
-x + 2y = 7
Answer:
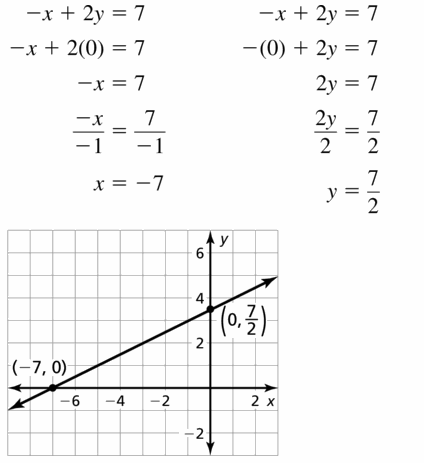
Question 20.
3x – y = -5
Answer:
3x – y = -5
To find the x-intercept, put y = 0
3x – 0 = -5
3x = -5
x = -5/3
To find the y-intercept, put x = 0
0 – y = -5
-y = -5
y = 5
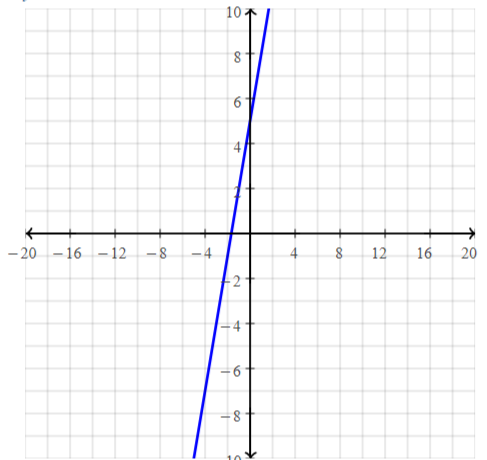
Question 21.
–\(\frac{5}{2}\)x + y = 10
Answer:
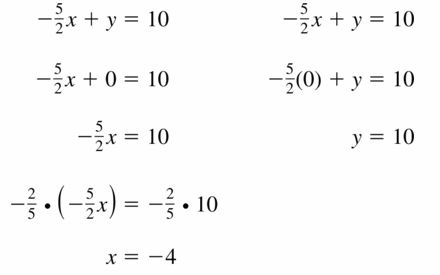
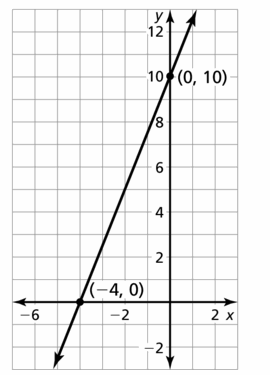
Question 22.
–\(\frac{1}{2}\)x + y = -4
Answer:
–\(\frac{1}{2}\)x + y = -4
To find the x-intercept, put y =0
–\(\frac{1}{2}\)x + 0 = -4
–\(\frac{1}{2}\)x = -4
-x = -4(2)
-x = -8
x = 8
To find the y-intercept, put x = 0
0 + y = -4
y = -4
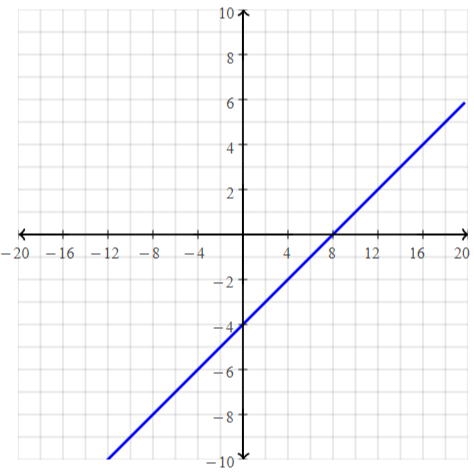
Question 23.
MODELING WITH MATHEMATICS
A football team has an away game, and the bus breaks down. The coaches decide to drive the players to the game in cars and vans. Four players can ride in each car. Six players can ride in each van. There are 48 players on the team. The equation 4x + 6y = 48 models this situation, where x is the number of cars and y is the number of vans.
a. Graph the equation. Interpret the intercepts.
b. Find four possible solutions in the context of the problem.
Answer:
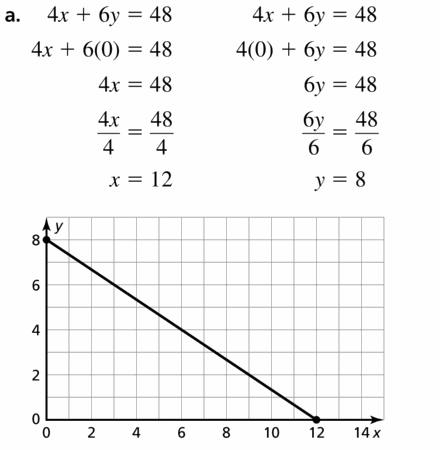
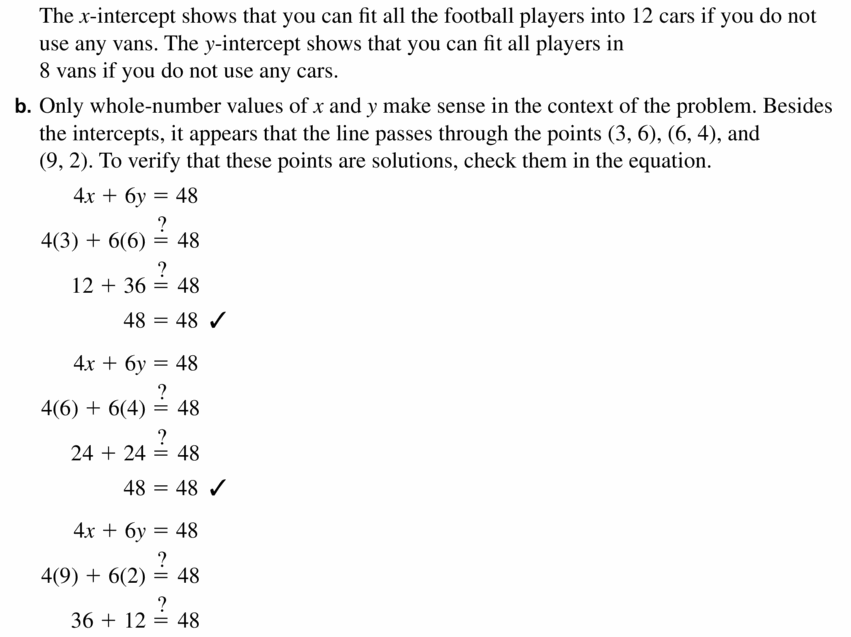
Question 24.
MODELING WITH MATHEMATICS
You are ordering shirts for the math club at your school. Short-sleeved shirts cost $10 each. Long-sleeved shirts cost $12 each. You have a budget of $300 for the shirts. The equation 10x + 12y = 300 models the total cost, where x is the number of short-sleeved shirts and y is the number of long-sleeved shirts.
a. Graph the equation. Interpret the intercepts.
Answer:
You are ordering shirts for the math club at your school. Short-sleeved shirts cost $10 each. Long-sleeved shirts cost $12 each. You have a budget of $300 for the shirts.
The equation 10x + 12y = 300 models the total cost, where x is the number of short-sleeved shirts and y is the number of long-sleeved shirts.
10x + 12y = 300
where,
x is the number of short-sleeved shirts
y is the number of long-sleeved shirts.
To find the x-intercept, put y =0
10x + 12 (0) = 300
10x = 300
x = 300 / 10
x = 30
To find the y-intercept, put x = 0
10 (0) + 12y = 300
12y = 300
y = 300 / 12
y = 25
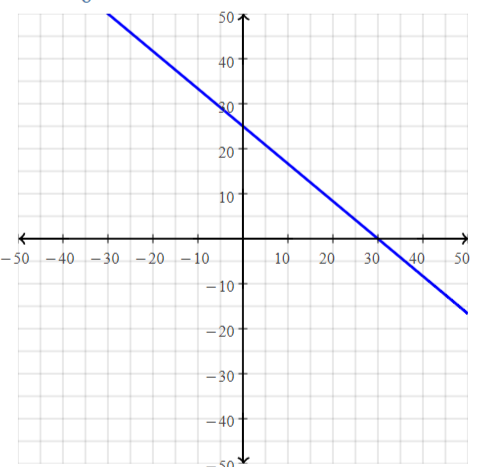
b. Twelve students decide they want short-sleeved shirts. How many long-sleeved shirts can you order?
Answer:
10x + 12y = 300
where,
x is the number of short-sleeved shirts
y is the number of long-sleeved shirts.
The number of short-sleeved shirts = 12
10 (12) + 12y = 300
120 + 12y = 300
12y = 300 – 120
12y = 180
y = 180 / 12
y = 15
ERROR ANALYSIS
In Exercises 25 and 26, describe and correct the error in finding the intercepts of the graph of the equation.
Question 25.
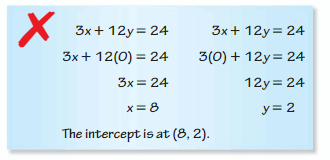
Answer:
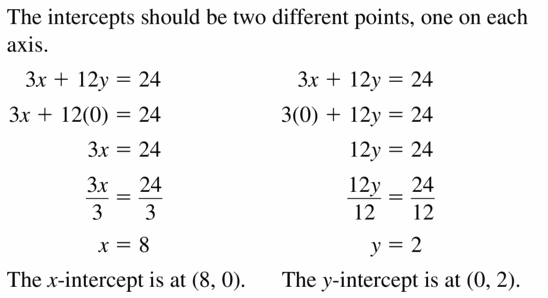
Question 26.
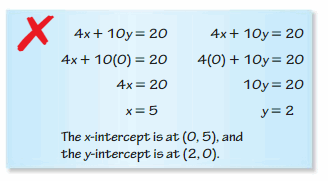
Answer:
4x + 10y = 20
To find the value of the x-intercept, put y = 0
4x + 10 (0) = 20
4x = 20
x = 20 / 4
x = 5
To find the value of the y-intercept, put x = 0
4 (0) + 10y = 20
10y = 20
y = 20 / 10
y = 2
The x-intercept is (5, 0)
The y-intercept is (0, 2)
Question 27.
MAKING AN ARGUMENT
You overhear your friend explaining how to find intercepts to a classmate. Your friend says, “When you want to find the x-intercept, just substitute 0 for x and continue to solve the equation.” Is your friend’s explanation correct? Explain.
Answer:
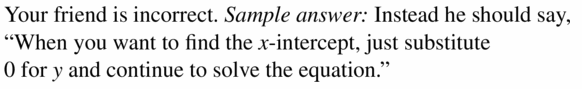
Question 28.
ANALYZING RELATIONSHIPS
You lose track of how many 2-point baskets and 3-point baskets a team makes in a basketball game. The team misses all the 1-point baskets and still scores 54 points. The equation 2x + 3y = 54 models the total points scored, where x is the number of 2-point baskets made and y is the number of 3-point baskets made.
a. Find and interpret the intercepts.
Answer:
You lose track of how many 2-point baskets and 3-point baskets a team makes in a basketball game.
The team misses all the 1-point baskets and still scores 54 points.
The equation 2x + 3y = 54 models the total points scored, where x is the number of 2-point baskets made and y is the number of 3-point baskets made.
2x + 3y = 54
where,
x is the number of 2-point baskets made
y is the number of 3-point baskets made.
To find the value of the x-intercept, put y = 0
2x = 54
x = 54 / 2
x = 27
To find the value of the y-intercept, put x = 0
3y = 54
y = 54 / 3
y = 18
The value of the x-intercept is 27
The value of the y-intercept is 18
b. Can the number of 3-point baskets made be odd? Explain your reasoning.
Answer:
The number of 3-point baskets can be represented as y
To make the 3-point baskets odd, the multiples of 3 must be odd
In this scenario, it is not possible
The number of 3-point baskets made not be odd
c. Graph the equation. Find two more possible solutions in the context of the problem.
Answer:
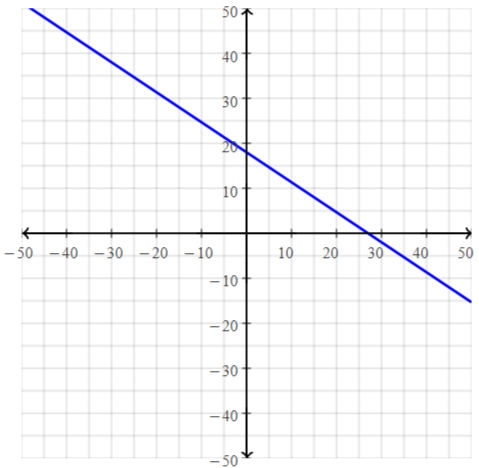
2x + 3y = 54
We can observe that there are many solutions like (3, 16), (6, 14), (10, 11),…
To satisfy the above equation, substitute the points we obtained from the graph
The solutions to the given equation are: (3, 16) and (6, 14)
MULTIPLE REPRESENTATIONS
In Exercises 29–32, match the equation with its graph.
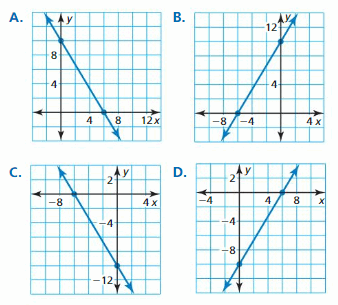
Question 29.
5x + 3y = 30
Answer:
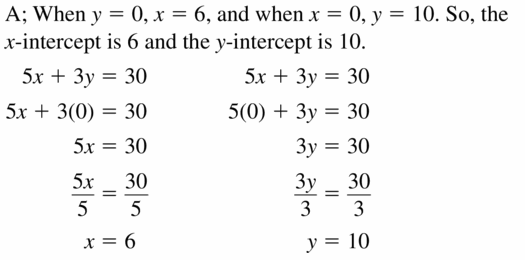
Question 30.
5x + 3y = -30
Answer:
5x + 3y = -30
To find the value of the x-intercept, put y = 0
5x = -30
x = -30 / 5
x = -6
To find the value of the y-intercept, put x = 0
3y = -30
y = -30 / 3
y = -10
The graph C) matches the given equation.
Question 31.
5x – 3y = 30
Answer:
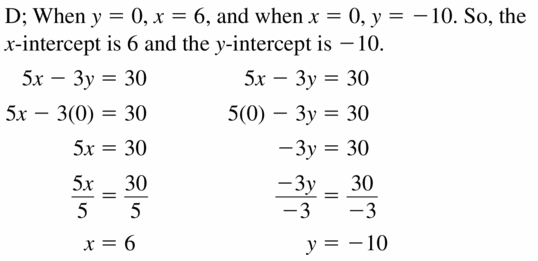
Question 32.
5x – 3y = -30
Answer:
5x – 3y = -30
To find the value of the x-intercept, put y = 0
5x = -30
x = -30 / 5
x = -6
To find the value of the y-intercept, put x = 0
-3y = -30
3y = 30
y = 30 / 3
y = 10
The graph B) matches the given equation
Question 33.
MATHEMATICAL CONNECTIONS
Graph the equations x = 5, x = 2, y = -2, and y = 1. What enclosed shape do the lines form? Explain your reasoning.
Answer:
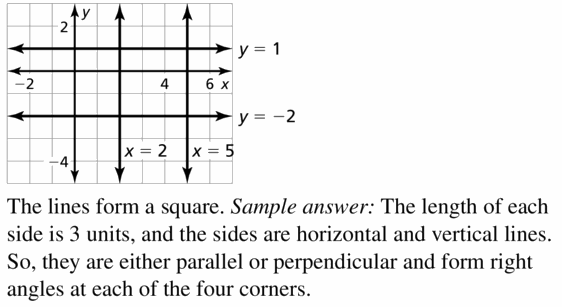
Question 34.
HOW DO YOU SEE IT? You are organizing a class trip to an amusement park. The cost to enter the park is $30. The cost to enter with a meal plan is $45. You have a budget of $2700 for the trip. The equation 30x + 45y = 2700 models the total cost for the class to go on the trip, where x is the number of students who do not choose the meal plan and y is the number of students who do choose the meal plan.
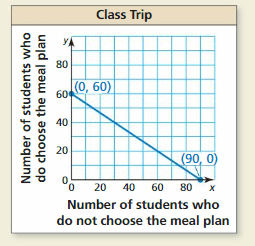
a. Interpret the intercepts of the graph.
Answer:
The x-intercept is the point that cuts the x-axis and y must be 0
The y-intercept is the point that cuts the y-axis and x must be 0
The x-intercept is (90, 0)
The y-intercept is (0, 60)
b. Describe the domain and range in the context of the problem.
Answer:
The domain is defined as the set of all the values of x
The range is defined as the set of all the values of y
The domain of the given function is {0, 10, 20, 30, 40, 50, 60, 70, 80, 90}
The range of the given function is {0, 10, 20, 30, 40, 50, 60}
Question 35.
REASONING
Use the values to fill in the equation ![]() so that the x-intercept of the graph is -10 and the y-intercept of the graph is 5.
so that the x-intercept of the graph is -10 and the y-intercept of the graph is 5.
![]()
Answer:
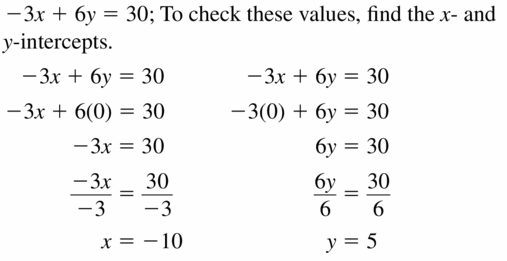
Question 36.
THOUGHT-PROVOKING
Write an equation in the standard form of a line whose intercepts are integers. Explain how you know the intercepts are integers.
Answer:
The equation in the standard form is
y = mx + c
To find the value of the x-intercept, put y = 0
mx = -c
x = –\(\frac{c}{m}\)
To find the value of the y-intercept, put x = 0
y = 0 + c
y = c
The x and y-intercepts integers, the values of the intercepts must be the multiples of the variable c
Question 37.
WRITING
Are the equations of horizontal and vertical lines written in standard form? Explain your reasoning.
Answer:
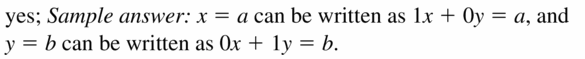
Question 38.
ABSTRACT REASONING
The x- and y-intercepts of the graph of the equation 3x + 5y = k are integers. Describe the values of k. Explain your reasoning.
Answer:
3x + 5y = k
To find the value of the x-intercept, put y = 0
3x = k
The values of k so that k become an integer is 0, 1, 2,…
To find the value of the y-intercept, put x = 0
5y = k
The values of k so that k becomes an integer are 0, 1, 2, and so on
The values of k so that the x and y-intercepts become integers are 0, 1, 2, and so on
Maintaining Mathematical Proficiency
Simplify the expression.
Question 39.
![]()
Answer:
Question 40.
![]()
Answer:
\(\frac{14 -18}{0 – 2}\)
= \(\frac{-4}{-2}\)
= \(\frac{4}{2}\)
= 2
Question 41.
![]()
Answer:
Question 42.
![]()
Answer:
\(\frac{12 – 17}{-5 – (-2)}\)
= \(\frac{12 – 17}{-5 + 2}\)
= \(\frac{-5}{-3}\)
= \(\frac{5}{3}\)
Lesson 3.5 Graphing Linear Equations in Slope-Intercept Form
EXPLORATION 1
Finding Slopes and y-Intercepts
Work with a partner. Find the slope and y-intercept of each line.
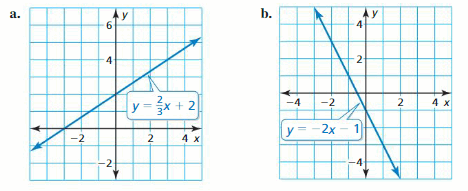
Answer:
The standard form of a linear equation is
y = mx + c
Where,
m is the slope
c is the y-intercept
a. y = \(\frac{2}{3}\)x + 2
Compare the given equation with the standard form of the linear equation
m = \(\frac{2}{3}\) and c = 2
b.
y = -2x – 1
The given equation with the standard form of the linear equation
m = -2 and c = -1
EXPLORATION 2
Writing a Conjecture
Work with a partner. Graph each equation. Then copy and complete the table. Use the completed table to write a conjecture about the relationship between the graph of y = mx + b and the values of m and b.
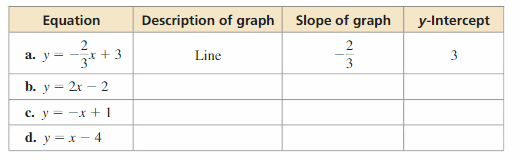
Answer:
a. y = –\(\frac{2}{3}\)x + 3
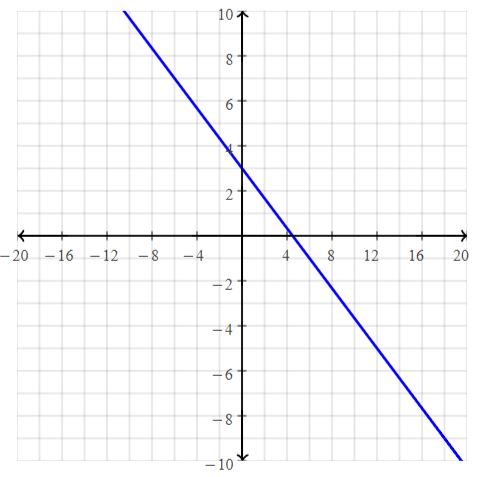
b. y = 2x – 2
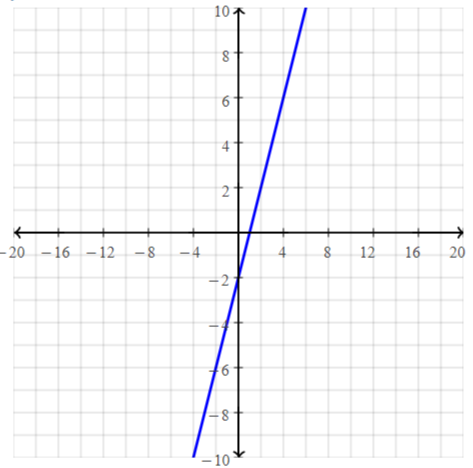
c.
y = -x + 1
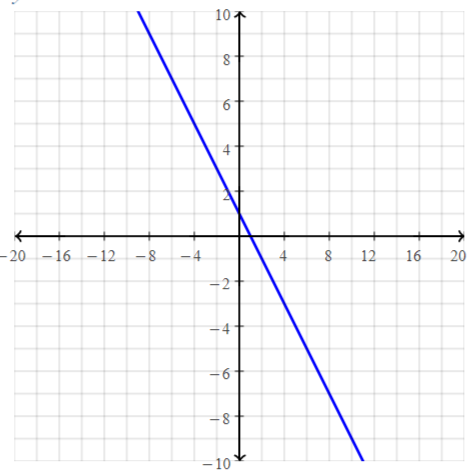
d. y = x – 4
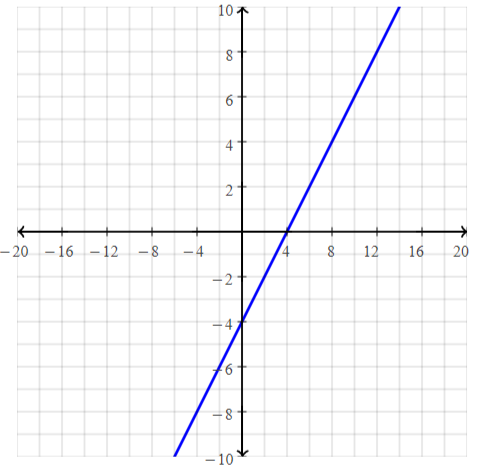
y = mx + b
m is the slope
b is the y-intercept
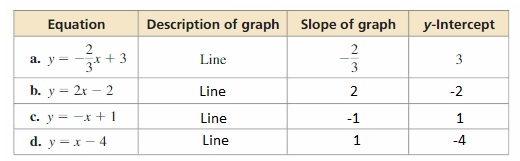
Communicate Your Answer
Question 3.
How can you describe the graph of the equation y = mx + b?
a. How does the value of m affect the graph of the equation?
b. How does the value of b affect the graph of the equation?
c. Check your answers to parts (a) and (b) by choosing one equation from Exploration 2 and (1) varying only m and (2) varying only b.
Answer:
a. The value of m affects the steepness of the line. It also describes the direction (positive or negative). The value of m defines the constant rate of change of variables
b. The value of b affects the line to where it should have the point of intersection with the y-axis
c. The examples of how m and b vary are as follows:
y =-3x – 3
y = 2x + 8
y = -3x + 6
The slopes and y-intercepts of the above equations are:
m = -3 and b = -3
m = 2 and b = 8
m = -3 and b = 6
3.5 Lesson
Monitoring Progress
Describe the slope of the line. Then find the slope.
Question 1.
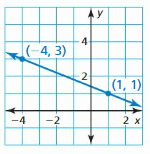
Answer:
(-4, 3), (1, 1)
The slope of the line when the two points are given is
m = \(\frac{y2 – y1}{x2 – x1}\)
The points are represented as (x, y)
The first point is represented as (x1, y1)
The second point is represented as (x2, y2)
(x1, y1) = (-4, 3) and (x2, y2) = (1, 1)
m = \(\frac{1 – 3}{1 – [-4]}\)
m = \(\frac{-2}{1 + 4}\)
m = \(\frac{-2}{5}\)
Question 2.
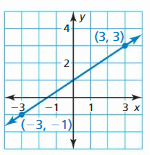
Answer:
(3, 3), (-3, 1)
The slope of the line when the two points are given is
m = \(\frac{y2 – y1}{x2 – x1}\)
The points are represented as (x, y)
The first point is represented as (x1, y1)
The second point is represented as (x2, y2)
(x1, y1) = (3, 3) and (x2, y2) = (-3, 1)
m = \(\frac{1 – 3}{-3 – 3}\)
m = \(\frac{-2}{6}\)
m = \(\frac{-1}{3}\)
Question 3.
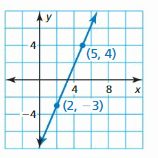
Answer:
(5, 4), (2, -3)
The slope of the line when the two points are given is
m = \(\frac{y2 – y1}{x2 – x1}\)
The points are represented as (x, y)
The first point is represented as (x1, y1)
The second point is represented as (x2, y2)
(x1, y1) = (5, 4) and (x2, y2) = (2, -3)
m = \(\frac{-3 – 4}{2 – 5}\)
m = \(\frac{-7}{-3}\)
m = \(\frac{7}{3}\)
Monitoring Progress
The points represented by the table lie on a line. How can you find the slope of the line from the table? What is the slope of the line?
Question 4.
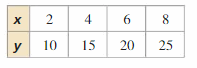
Answer:
The representations of the values of x and y in the form of ordered pairs are
(2, 10), (4, 15), (6, 20), (8, 25)
To find the slope of a line,
Take any 2 ordered pairs and find the slope
Let,
(x1, y1) = (2, 10) and (x2, y2) = (4, 15)
The slope of the line when the two points are given is
m = \(\frac{y2 – y1}{x2 – x1}\)
m = \(\frac{15 – 10}{4 – 2}\)
m = \(\frac{5}{2}\)
Question 5.
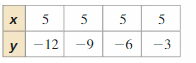
Answer:
The representations of the values of x and y in the form of ordered pairs are
(5, -12), (5, -9), (5, -6), (5, -3)
Take any 2 ordered pairs and find the slope
(x1, y1) = (5, -12) and (x2, y2) = (5, -9)
The slope of the line when the two points are given is
m = \(\frac{y2 – y1}{x2 – x1}\)
m = \(\frac{-9 – [-12]}{5 – 5}\)
m = \(\frac{3}{0}\) = undefined
Find the slope and the y-intercept of the graph of the linear equation.
Question 6.
y = -6x + 1
Answer:
y = -6x + 1
The standard representation of a linear equation is
y = mx + c
Where,
m is the slope
c is the y-intercept
The values of m and c are -6 and 1
Question 7.
y = 8
Answer:
y = 8
Rewrite the given equation as
y = 0x + 8
The standard representation of a linear equation is
y = mx + c
Where,
m is the slope
c is the y-intercept
The values of m and c are 0 and 8
Question 8.
x + 4y = -10
Answer:
x + 4y = -10
Rewrite the given equation as
4y = -10 – x
y = \(\frac{-10 – x}{4}\)
y = \(\frac{-x}{4}\) – \(\frac{10}{4}\)
The standard representation of a linear equation is
y = mx + c
Where,
m is the slope
c is the y-intercept
The values of m and ‘c’ are –\(\frac{1}{4}\) and –\(\frac{10}{4}\)
Graph the linear equation. Identify the x-intercept.
Question 9.
y = 4x – 4
Answer:
y = 4x – 4
To find the x-intercept, put y = 0
0 = 4x – 4
4x = 4
x = 4 / 4
x = 1
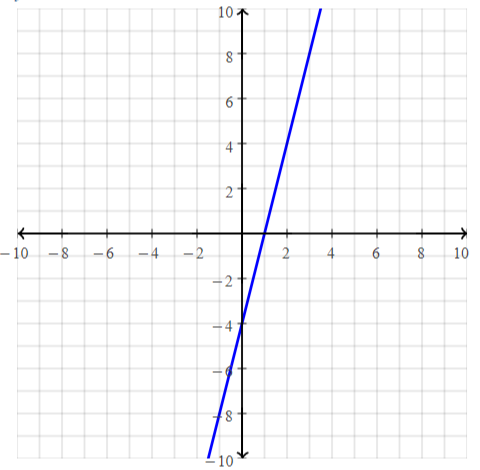
Question 10.
3x + y = -3
Answer:
3x + y = -3
To find the x-intercept, put y = 0
3x + 0 = -3
3x = -3
x = -3 / 3
x = -1
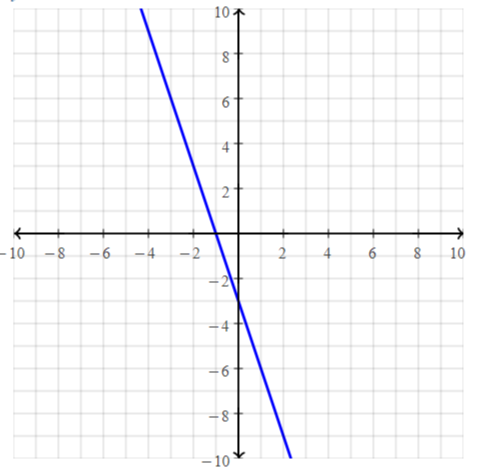
Question 11.
x + 2y = 6
Answer:
x + 2y = 6
To find the x-intercept, put y = 0
x + 0 = 6
x = 6
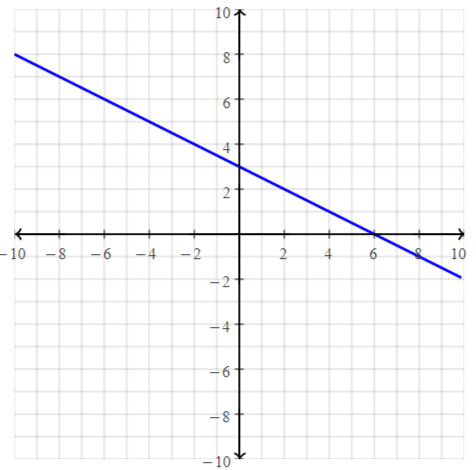
Question 12.
A linear function h models a relationship in which the dependent variable decreases 2 units for every 5 units the independent variable increases. Graph h when h(0) = 4. Identify the slope, y-intercept, and x-intercept of the graph.
Answer:
A linear function h models a relationship in which the dependent variable decreases 2 units for every 5 units the independent variable increases.
The independent variable is x
the dependent variable is y
x = -2 and y = +5
We can say that the slope is represented as
m = \(\frac{-2}{5}\)
h (0) = 2
y = 2 at x = 0
The y-intercept is (0, 2)
The representation of the equation in the standard form is:
y = mx + c
y = –\(\frac{2}{5}\)x + 2
The value of the x-intercept can be obtained by putting y = 0
0 = –\(\frac{2}{5}\)x + 2
–\(\frac{2}{5}\)x = -2
\(\frac{2}{5}\)x = 2
x = \(\frac{5 × 2}{2}\)
x = 5
The slope is –\(\frac{2}{5}\)
The x-intercept is (5, 0)
The y-intercept is (0, 2)
Question 13.
WHAT IF? The elevation of the submersible is modeled by h(t) = 500t – 10,000.
(a) Graph the function and identify its domain and range.
Answer:
h(t) = 500t – 10,000
There are no values for the domain since there are no values of x
The range of the given function is -20,000 ≤ t ≤ 20,000
(b) Interpret the slope and the intercepts of the graph.
Answer:
h (t) = 500t – 10,000
Compare the given equation with the standard linear equation y = mx + c
m = 500
c = -10,000
To find the x-intercept, put y = 0 or h (t) = 0
500t – 10,000 = 0
500t = 10,000
t = 10,000 / 500
t = 20 or x = 20
To find the y-intercept, put x = 0 or t = 0
h (t) = 500 (0) – 10,000
h (t) = -10,000
The slope is 500
The x-intercept is 20
The y-intercept is -10,000
Graphing Linear Equations in Slope-Intercept Form 3.5 Exercises
Vocabulary and Core Concept
Question 1.
COMPLETE THE SENTENCE
The ________ of a nonvertical line passing through two points is the ratio of the rise to the run.
Answer: The slope of a nonvertical line passing through two points is the ratio of the rise to the run.
Question 2.
VOCABULARY
What is a constant function? What is the slope of a constant function?
Answer:
A Constant function is a function where the output is the same for every input value.
The slope for a constant function will be 0.
Question 3.
WRITING
What is the slope-intercept form of a linear equation? Explain why this form is called the slope-intercept form.
Answer:
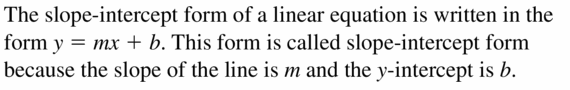
Question 4.
WHICH ONE did DOESN’T BELONG? Which equation does not belong with the other three? Explain your reasoning.
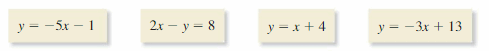
Answer:
a. y = -5x – 1
y = mx + c
m = -5 and c = -1
b. 2x – y = 8
y = 2x – 8
y = mx + c
m = 8 and c = -8
c. y = x + 4
y = mx + c
m = 1 and c = 4
d. y = -3x + 13
y = mx + c
m = -3 and c = 3
The equation (b) does not belong with the other three since the slope of equation (b) is even whereas all the other slops are odd
Monitoring Progress and Modeling with Mathematics
In Exercises 5–8, describe the slope of the line. Then find the slope.
Question 5.
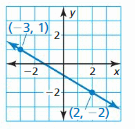
Answer:
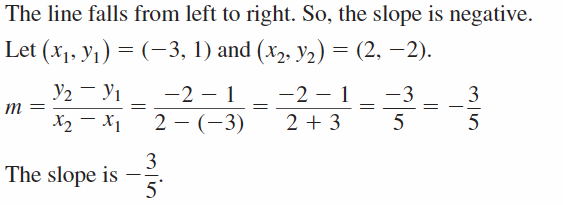
Question 6.
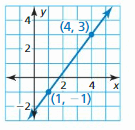
Answer:
The slope falls from right to left
The slope is positive
We have to represent the first pair as (x1, y1) and the second pair as (x2, y2)
(4, 3), (1, -1)
m = \(\frac{y2 – y1}{x2 – x1}\)
m = \(\frac{-1 – 3}{1 – 4}\)
m = \(\frac{-4}{-3}\)
m = \(\frac{4}{3}\)
Question 7.
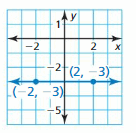
Answer:
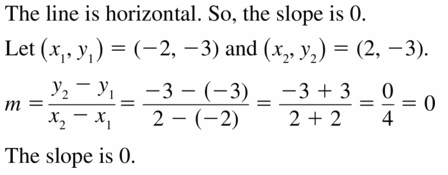
Question 8.
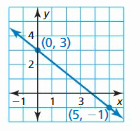
Answer:
The slope falls from left to right
The slope is negative
We have to represent the first pair as (x1, y1) and the second pair as (x2, y2)
(0, 3), (5, -1)
m = \(\frac{y2 – y1}{x2 – x1}\)
m = \(\frac{-1 – 3}{5 – 0}\)
m = \(\frac{-4}{5}\)
m = –\(\frac{4}{5}\)
In Exercises 9–12, the points represented by the table lie on a line. Find the slope of the line.
Question 9.
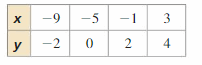
Answer:
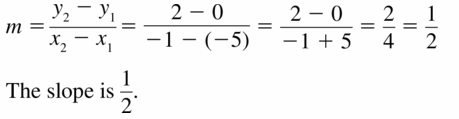
Question 10.
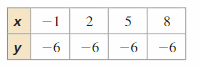
Answer:
(-1, -6), (2, -6)
m = \(\frac{y2 – y1}{x2 – x1}\)
m = \(\frac{-6 + 6}{2 + 1}\)
m = \(\frac{0}{3}\)
m = 0
Question 11.
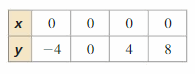
Answer:
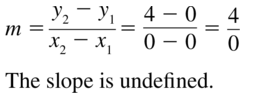
Question 12.
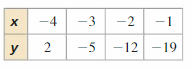
Answer:
(-4, 2), (-3, -5)
m = \(\frac{y2 – y1}{x2 – x1}\)
m = \(\frac{-5 – 2}{-3 – [-4]}\)
m = \(\frac{-7}{1}\)
m = -7
Question 13.
ANALYZING A GRAPH
The graph shows the distance y(in miles) that a bus travels in x hours. Find and interpret the slope of the line.
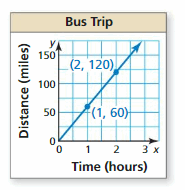
Answer:
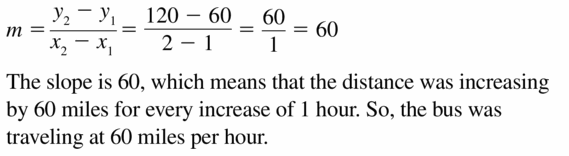
Question 14.
ANALYZING A TABLE
The table shows the amount x(in hours) of time you spend at a theme park and the admission fee y (in dollars) to the park. The points represented by the table lie on a line. Find and interpret the slope of the line.
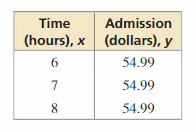
Answer:
Let (6, 54.99) and (7, 54.99) be the 2 ordered pairs
m = \(\frac{y2 – y1}{x2 – x1}\)
m = \(\frac{54.99 – 54.99}{7 – 6}\)
m = \(\frac{0}{1}\)
m = 0
In Exercises 15–22, find the slope and the y-intercept of the graph of the linear equation.
Question 15.
y = -3x + 2
Answer:
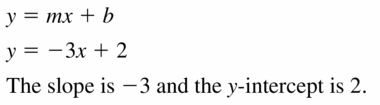
Question 16.
y = 4x – 7
Answer:
y = 4x – 7
y = mx + c
m = 4 and c = -7
Question 17.
y = 6x
Answer:
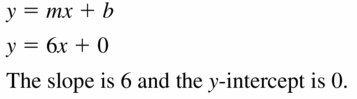
Question 18.
y = -1
Answer:
y = -1
y = mx + c
y = 0x – 1
y = mx + c
m = 0 and c = -1
Question 19.
-2x + y = 4
Answer:
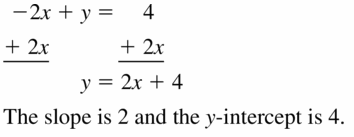
Question 20.
x + y = -6
Answer:
x + y = -6
y = mx + c
y = -x – 6
y = mx + c
m = -1 and c = -6
Question 21.
-5x = 8 – y
Answer:
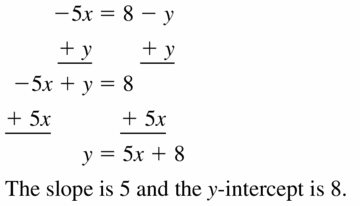
Question 22.
0 = 1 – 2y + 14x
Answer:
0 =1 – 2y + 14x
y = mx + c
2y = 14x + 1
y = (14 / 2)x + (1 / 2)
y = 7x + \(\frac{1}{2}\)
y = mx + c
m = 7 and c = \(\frac{1}{2}\)
ERROR ANALYSIS
In Exercises 23 and 24, describe and correct the error in finding the slope and the y-intercept of the graph of the equation.
Question 23.
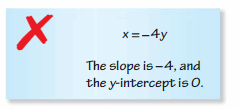
Answer:
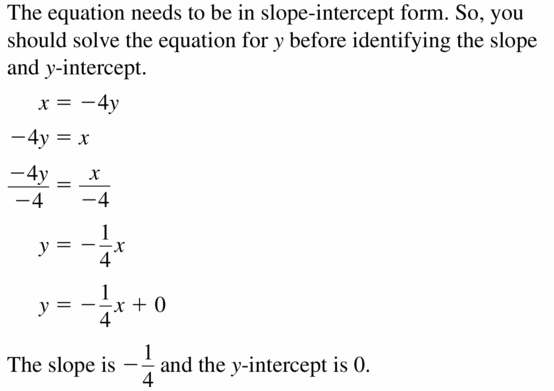
Question 24.
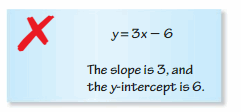
Answer:
y = 3x – 6
y = mx + c
m = 3 and c = -6
In Exercises 25–32, graph the linear equation. Identify the x-intercept.
Question 25.
y = -x + 7
Answer:
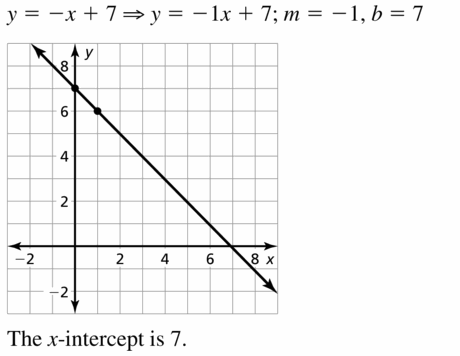
Question 26.
y = \(\frac{1}{2}\)x + 3
Answer:
y = \(\frac{1}{2}\)x + 3
To find the x-intercepy, put y = 0
0 = \(\frac{1}{2}\)x + 3
–\(\frac{1}{2}\)x = 3
x = 3 (-2)
x = -6
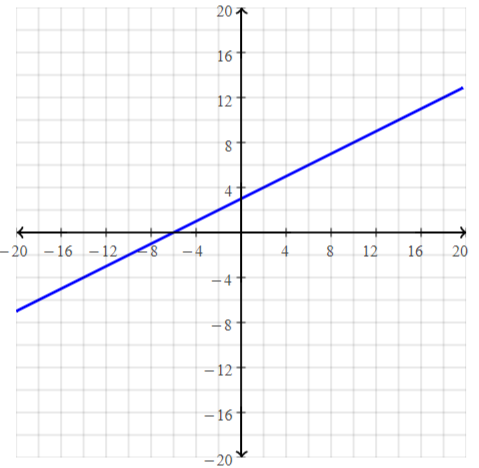
Question 27.
y = 2x
Answer:
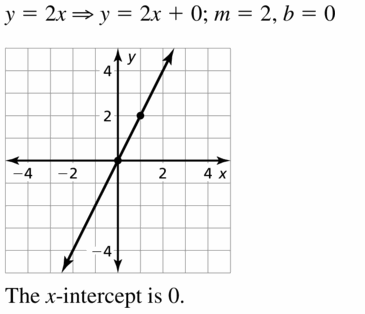
Question 28.
y = -x
Answer:
y = -x
y = mx + c
y = -x + 0
To find the x-intercept, put y = 0
0 = -x + 0
x = 0
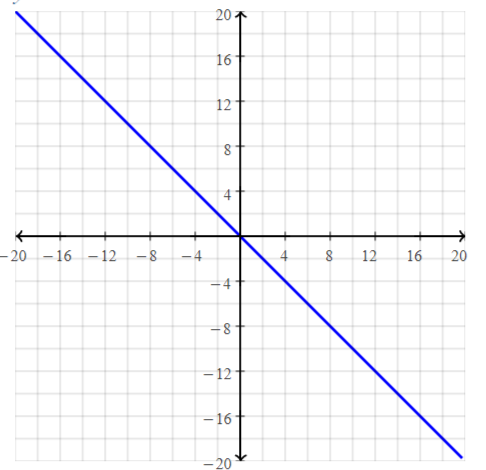
Question 29.
3x + y = -1
Answer:
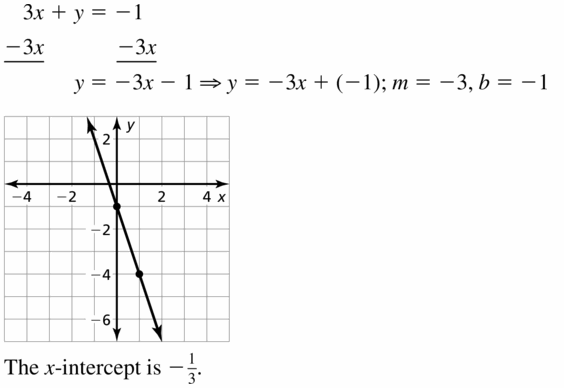
Question 30.
x + 4y = 8
Answer:
x + 4y = 8
4y = -x + 8
Divide by 4 into both sides
y = –\(\frac{1}{4}\)x + (8 / 4)
y = –\(\frac{1}{4}\)x + 2
To find the x-intercept, put y = 0
0 = –\(\frac{1}{4}\)x + 2
\(\frac{1}{4}\)x = 2
x = 2(4)
x = 8
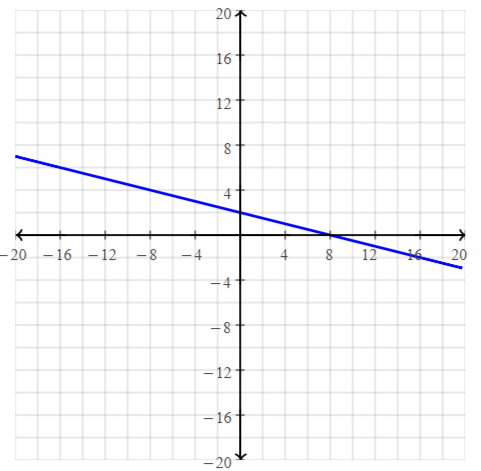
Question 31.
-y + 5x = 0
Answer:
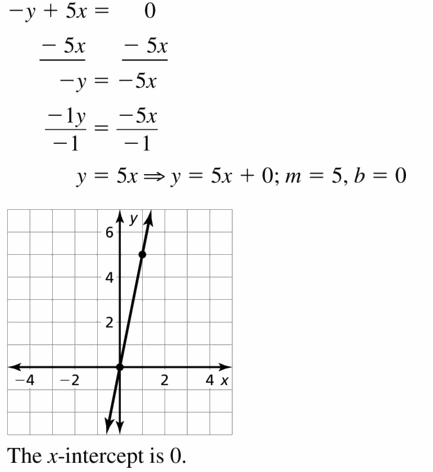
Question 32.
2x – y + 6 = 0
Answer:
2x – y + 6 = 0
y = 2x + 6
To find the x-intercept, put y = 0
0 = 2x + 6
-2x = 6
x = -6 / 2
x = -3
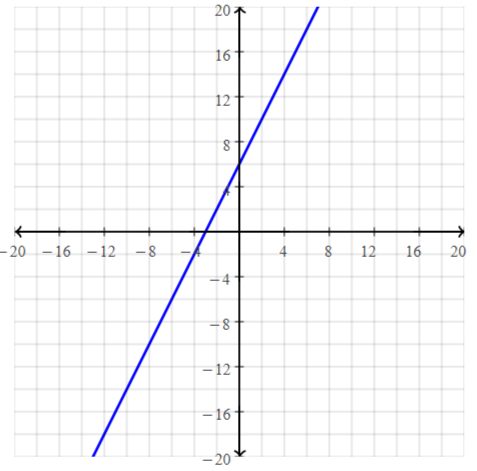
In Exercises 33 and 34, graph the function with the given description. Identify the slope, y-intercept, and x-intercept of the graph.
Question 33.
A linear function f models a relationship in which the dependent variable decreases 4 units for every 2 units the independent variable increases. The value of the function at 0 is -2.
Answer:
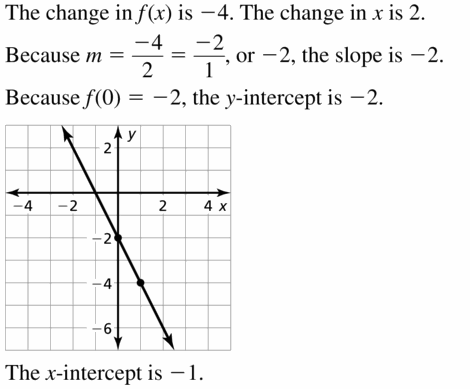
Question 34.
A linear function h models a relationship in which the dependent variable increases 1 unit for every 5 units the independent variable decreases. The value of the function at 0 is 3.
Answer:
The independent variable is x
The dependent variable is y
Slope (m) = y / x
m = 1 / (-5)
m = –\(\frac{1}{5}\)
It is given that the value of the function at 0 is 3
The value of y at x = 0 is 3
The y-intercept of the given function is: 3
y = mx + c
y = –\(\frac{1}{5}\)x + 3
To find the x-intercept, put y = 0
0 = –\(\frac{1}{5}\)x + 3
\(\frac{1}{5}\)x = 3
x = 3(5)
x = 15
To find the y-intercept, put x = 0
y = 3
The slope of the given function is –\(\frac{1}{5}\)
The x-intercept is: 15
The y-intercept is: 3
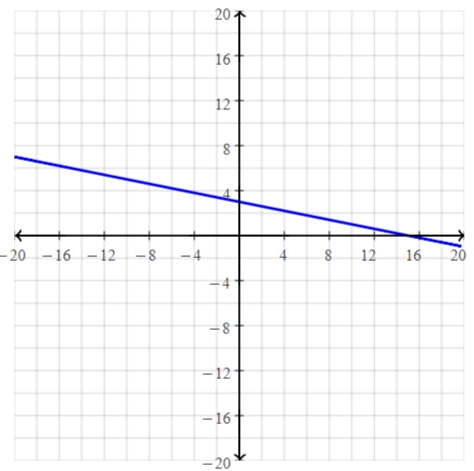
Question 35.
GRAPHING FROM A VERBAL DESCRIPTION
A linear function r models the growth of your right index fingernail. The length of the fingernail increases 0.7 millimeters every week. Graph r when r(0) = 12. Identify the slope and interpret the y-intercept of the graph.
Answer:
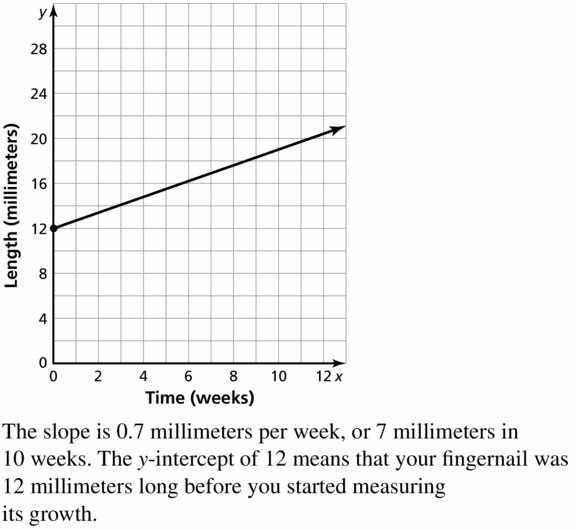
Question 36.
GRAPHING FROM A VERBAL DESCRIPTION
A linear function m models the amount of milk sold by a farm per month. The amount decreases 500 gallons for every $1 increase in price. Graph m when m(0) = 3000. Identify the slope and interpret the x- and y-intercepts of the graph.
Answer:
The amount of milk decreases 500 gallons for every $1 increase
The price is the independent variable
x represents the price
The amount of milk is the dependent variable
y represents the amount of milk
Slope = y / x
Slope = -500 / 1
Slope (m) = -500
m (0) = 3000
m (0) is the functional representation of y
y = 3000 when x = 0
The y-intercept is 3000
The representation of the slope and the y-intercept in the standard form of the linear equation is:
y = mx + c
y = -500x + 3000
To find the x-intercept, put y = 0
0 = -500x + 3000
500x = 3000
x = 3000 / 500
x = 6
To find the y-intercept, put x = 0
y = -500 (0) + 3000
y = 3000
Question 37.
MODELING WITH MATHEMATICS
The function shown models the depth d (in inches) of snow on the ground during the first 9 hours of a snowstorm, where t is the time (in hours) after the snowstorm begins.
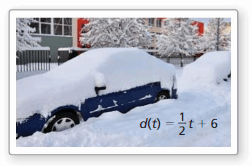
a. Graph the function and identify its domain and range.
b. Interpret the slope and the d-intercept of the graph.
Answer:
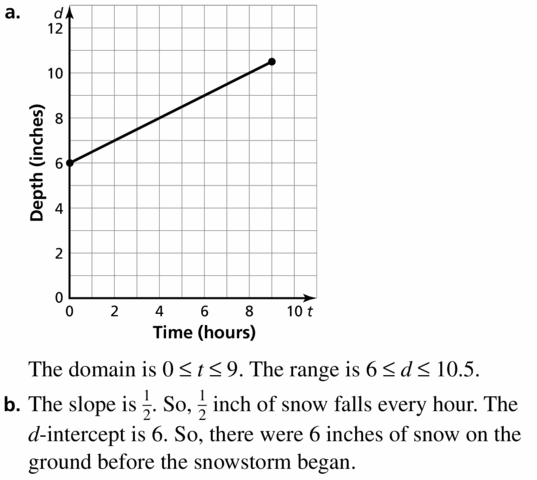
Question 38.
MODELING WITH MATHEMATICS
The function c(x) = 0.5x + 70 represents the cost c (in dollars) of renting a truck from a moving company, where x is the number of miles you drive the truck.
a. Graph the function and identify its domain and range.
Answer:
c (x) = 0.5x + 70
Where,
represents the cost c (in dollars) of renting a truck from a moving company,
x is the number of miles you drive the truck.
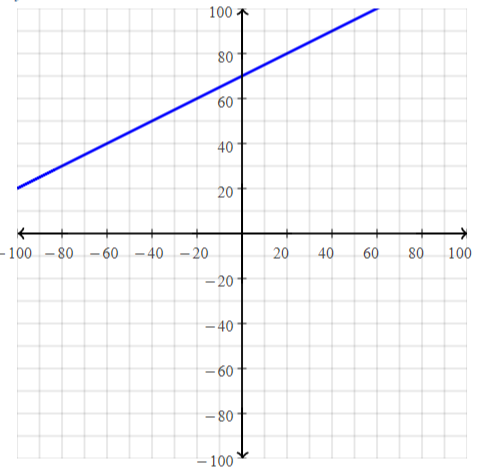
The domain is the set of all the values of x that hold the given equation’s true
The range is defined as the set of all the values of y that holds the given equation’s true
The domain of the given function is -100 ≤ x ≤ 60
The range of the given function is 20 ≤y ≤ 70
b. Interpret the slope and the c-intercept of the graph.
Answer:
c (x) = 0.5x + 70
y = mx + c
m = 0.5 and c = 70
Question 39.
COMPARING FUNCTIONS
A linear function models the cost of renting a truck from a moving company. The table shows the cost y (in dollars) when you drive the truck x miles. Graph the function and compare the slope and the y-intercept of the graph with the slope and the c-intercept of the graph in Exercise 38.
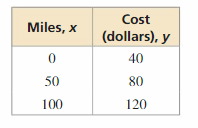
Answer:
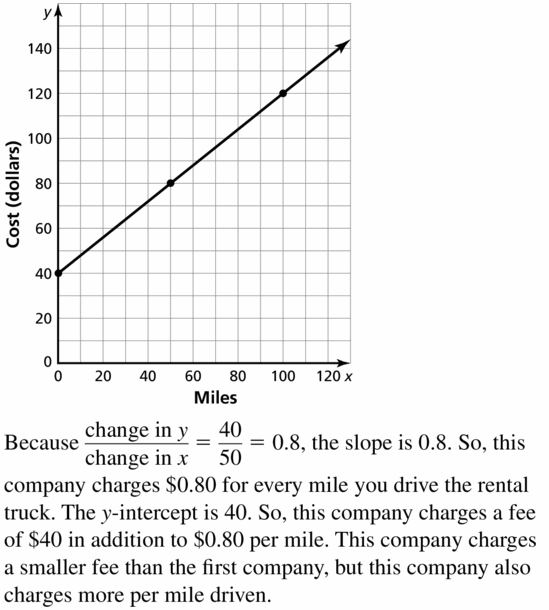
ERROR ANALYSIS
In Exercises 40 and 41, describe and correct the error in graphing the function.
Question 40.
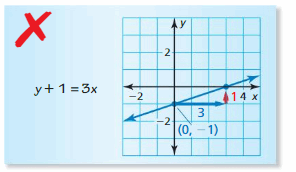
Answer:
y + 1 = 3x
y = mx + c
y = 3x – 1
y = mx + c
m = 3 and c = -1
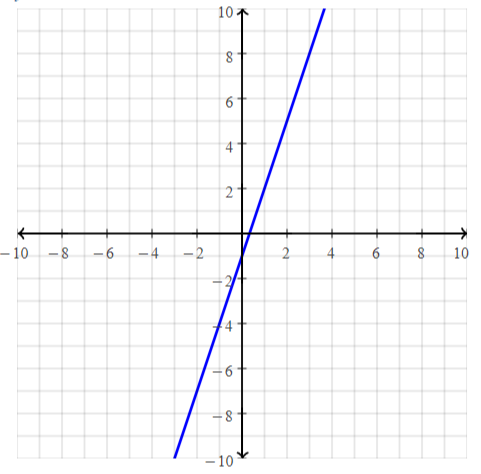
Question 41.
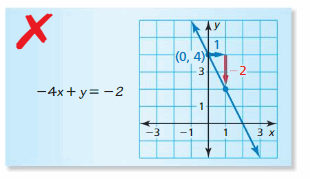
Answer:
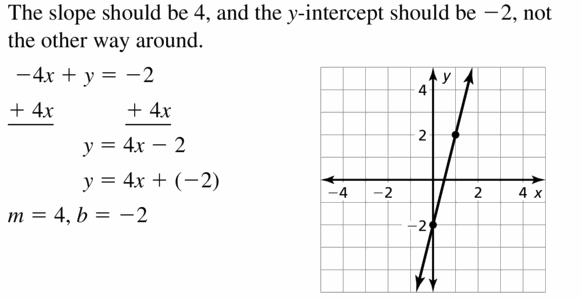
Question 42.
MATHEMATICAL CONNECTIONS
Graph the four equations in the same coordinate plane.
3y = -x – 3
2y – 14 = 4x
4x – 3 – y = 0
x – 12 = -3y
a. What enclosed shape do you think the lines form? Explain.
Answer:
a. 3y = -x – 3
y = –\(\frac{x}{3}\) – (3 / 3)
y = –\(\frac{1}{3}\)x – 1
b. 2y – 14 = 4x
y – (14 / 2) = 2x
y – 7 = 2x
y = 2x + 7
c. 4x – 3 – y = 0
y = 4x – 3
d. x – 12 = -3y
y = –\(\frac{x}[3]\) + (12 / 3)
y = –\(\frac{1}{3}\)x + 4
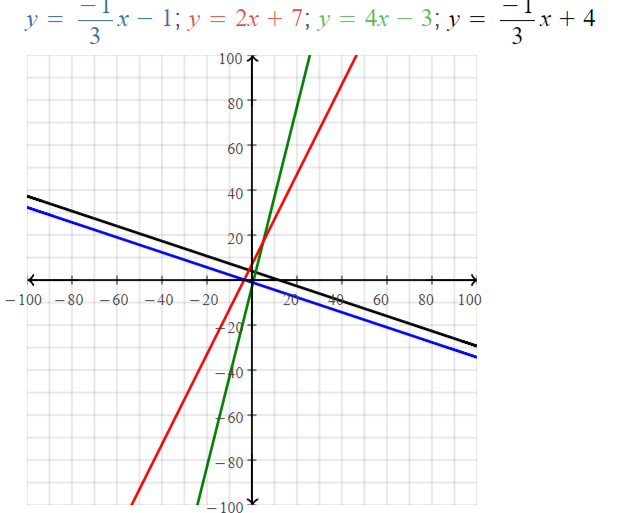
The enclosed lines in the graph form a rectangle
b. Write a conjecture about the equations of parallel lines.
Answer:
We can determine from their equations whether two lines are parallel by comparing their slopes.
If the slopes are the same and the y-intercepts are different, the lines are parallel.
If the slopes are different, the lines are not parallel.
Unlike parallel lines, perpendicular lines do intersect.
Question 43.
MATHEMATICAL CONNECTIONS The graph shows the relationship between the width y and the length x of a rectangle in inches. The perimeter of a second rectangle is 10 inches less than the perimeter of the first rectangle.
a. Graph the relationship between the width and length of the second rectangle.
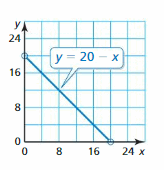
b. How does the graph in part (a) compare to the graph shown?
Answer:
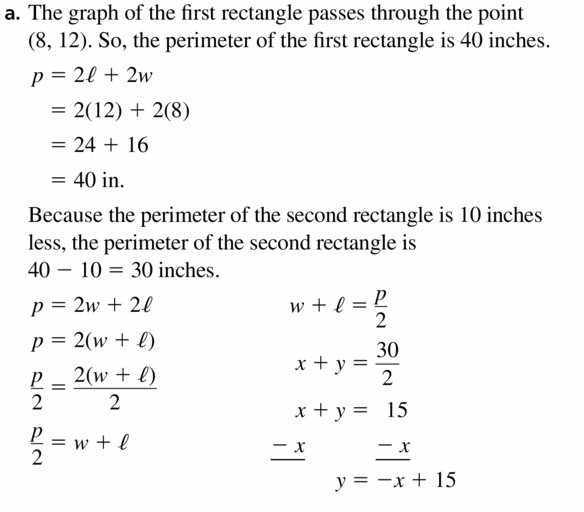
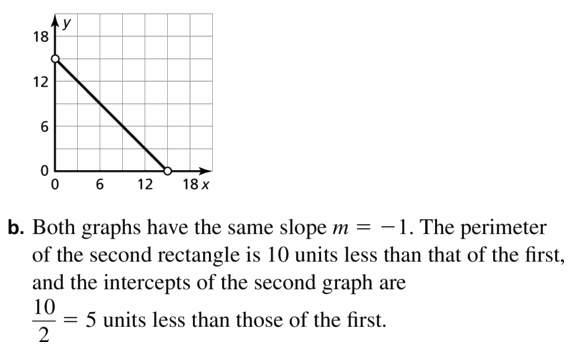
Question 44.
MATHEMATICAL CONNECTIONS
The graph shows the relationship between the base length x and the side length (of the two equal sides) y of an isosceles triangle in meters. The perimeter of a second isosceles triangle is 8 meters more than the perimeter of the first triangle.
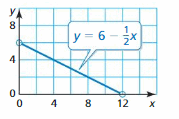
a. Graph the relationship between the base length and the side length of the second triangle.
The graph shows the relationship between the base length x and the side length (of the two equal sides) y of an isosceles triangle in meters. The perimeter of a second isosceles triangle is 8 meters more than the perimeter of the first triangle.
y = 6 – \(\frac{1}{2}\)x
2y = 6 (2) – x
2y = 12 – x
2y + x = 12
Where,
x is the base length
y is the side of equal length like the third side
It is also given that the perimeter of a second isosceles triangle is 8 meters more than the perimeter of the first triangle.
2y + x = 12 + 8
2y + x = 20
The above equation represents the perimeter of the second Isosceles triangle.
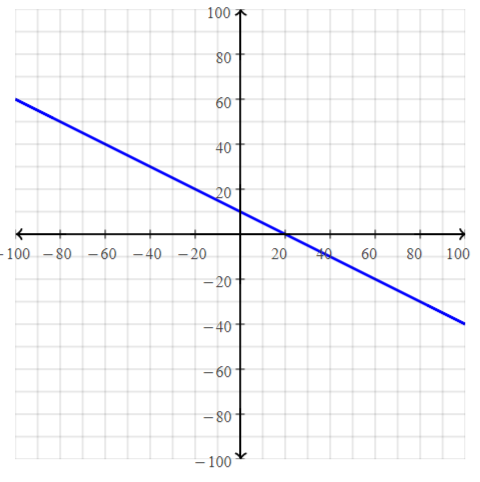
b. How does the graph in part (a) compare to the graph shown?
Answer:
The equation of the perimeter of the first isosceles triangle is
y = 6 – \(\frac{1}{2}\)x
The equation of the perimeter of the second isosceles triangle is
y = 10 – \(\frac{1}{2}\)x
From comparing the above 2 equations with the standard form of the linear equation
y = mx + c
The graphs of the perimeters of the first isosceles triangle and the second isosceles triangle are parallel
Question 45.
ANALYZING EQUATIONS
Determine which of the equations could be represented by each graph.
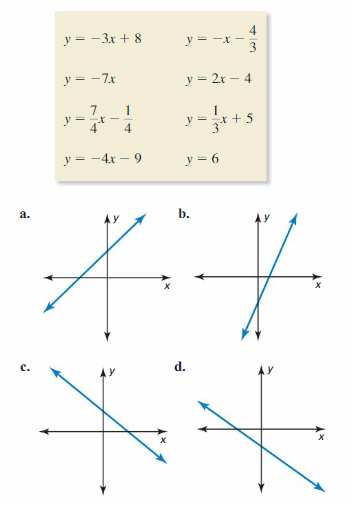
Answer:
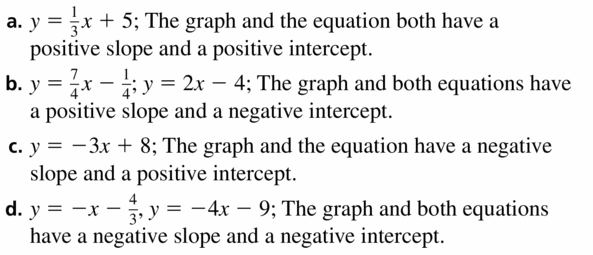
Question 46.
MAKING AN ARGUMENT
Your friend says that you can write the equation of any line in slope-intercept form. Is your friend correct? Explain your reasoning.
Answer:
We can write the equation in slope-intercept form only when that equation is in the linear form i.e., only x and y terms.
If there are exponential terms in an equation, then we can not write that equation in slope-intercept form
We can conclude that your friend is not correct
Question 47.
WRITING
Write the definition of the slope of a line in two different ways.
Answer:
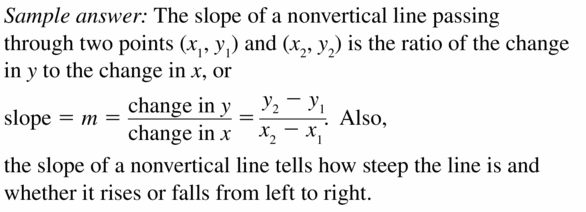
Question 48.
THOUGHT-PROVOKING
Your family goes on vacation to a beach 300 miles from your house. You reach your destination 6 hours after departing. Draw a graph that describes your trip. Explain what each part of your graph represents.
Answer:
Question 49.
ANALYZING A GRAPH
The graphs of the functions g(x) = 6x + a and h(x) = 2x + b, where a and b are constants, are shown. They intersect at the point (p, q).
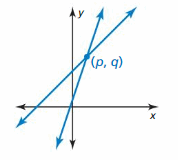
a. Label the graphs of g and h.
b. What do a and b represent?
c. Starting at the point (p, q), trace the graph of g until you get to the point with the x-coordinate p + 2. Mark this point C. Do the same with the graph of h. Mark this point D. How much greater is the y-coordinate of point C than the y-coordinate of point D?
Answer:
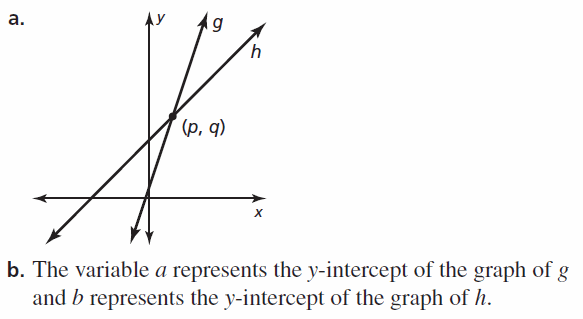
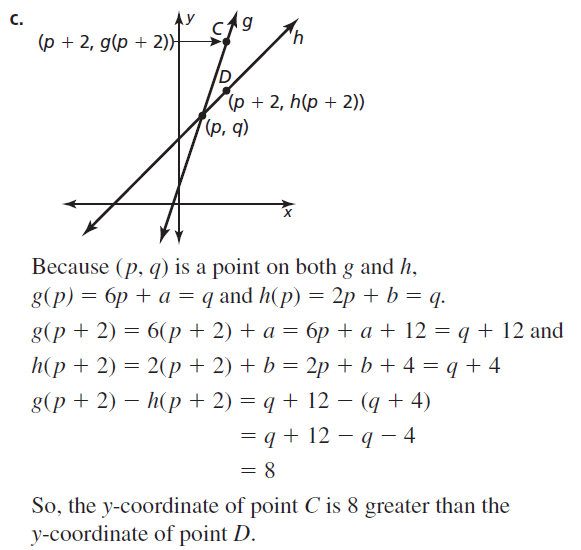
Question 50.
HOW DO YOU SEE IT? Your commute to school by walking and by riding a bus. The graph represents your commute.
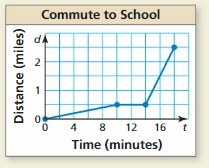
a. Describe your commute in words.
Answer:
From 0 to 10 seconds,
The distance you commuted gradually increases
From 10 to 14 seconds,
The distance you commuted is constant
From 14 to 18 seconds,
The distance you commuted abruptly increased
b. Calculate and interpret the slopes of the different parts of the graph.
Answer:
The x-axis represents the time
The y-axis represents the distance in miles
From 0 to 10 seconds,
The ordered pairs from the coordinate plane are:
(0, 0), (10, 0.5)
m = \(\frac{y2 – y1}{x2 – x1}\)
From 0 to 10 seconds,
m = \(\frac{0.5 – 0}{10 – 0}\)
m = \(\frac{0.5}{10}\)
m = \(\frac{5}{100}\)
m = 0.05
From 10 to 14 seconds,
The ordered pairs from the coordinate plane are:
(10, 0.5), (14, 0.5)
m = \(\frac{y2 – y1}{x2 – x1}\)
From 10 to 14 seconds,
m = \(\frac{0.5 – 0.5}{14 – 10}\)
m = \(\frac{0}{4}\)
m = 0
From 14 to 18 seconds,
The ordered pairs from the coordinate plane are:
(14, 0.5), (18, 2.5)
m = \(\frac{y2 – y1}{x2 – x1}\)
From 14 to 18 seconds,
m = \(\frac{2.5 – 0.5}{18 – 14}\)
m = \(\frac{2}{4}\)
m = \(\frac{1}{2}\)
m = 0.5
The slope from 0 to 10 seconds is: 0.05
The slope from 10 to 14 seconds is: 0
The slope from 14 to 18 seconds is: 0.5
PROBLEM-SOLVING
In Exercises 51 and 52, find the value of k so that the graph of the equation has the given slope or y-intercept.
Question 51.
y = 4kx – 5; m = \(\frac{1}{2}\)
Answer:
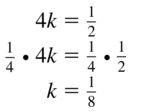
Question 52.
![]()
Answer:
y = –\(\frac{1}{3}\)x + \(\frac{5}{6}\)k
y = mx + b
m = –\(\frac{1}{3}\) and b = \(\frac{5}{6}\)k
The value of b is -10
\(\frac{5}{6}\)k = -10
5k = -10 × 6
k = \(\frac{-10 × 6}{5}\)
k = -12
Question 53.
ABSTRACT REASONING
To show that the slope of a line is constant, let (x1, y1) and (x2, y2) be any two points on the line y = mx + b. Use the equation of the line to express y1 in terms of x1 and y2 in terms of x2. Then use the slope formula to show that the slope between the points is m.
Answer:
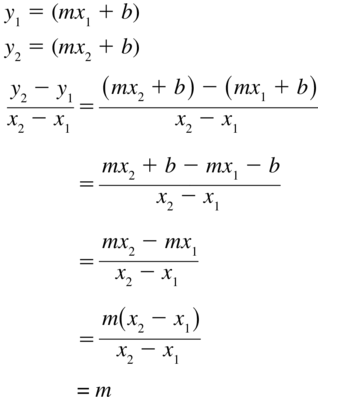
Maintaining Mathematical Proficiency
Find the coordinates of the figure after the transformation.
Question 54.
Translate the rectangle with 4 units left.
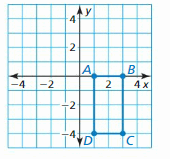
Answer:
The rectangle is covered up to 1 to 3 units at the x-axis and 0 to -4 units at the y-axis
When we move the rectangle 4 units left, i.e., move the 1 and 3 units left for 4 units and move the 0 and -4 units left for 4 units
At the x-axis:
1 – 4 = -3
3 – 4 = -1
At the y-axis:
0 – 4 = -4
-4 – 4 = -8
The new rectangle is formed at (-1, -3) at the x-axis and at (-4, -8) at the y-axis
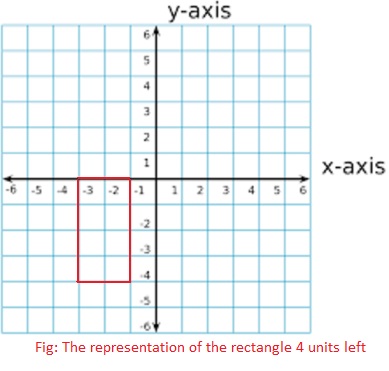
Question 55.
Dilate the triangle with respect to the origin using a scale factor of 2.
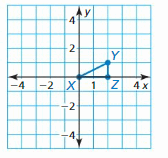
Answer:
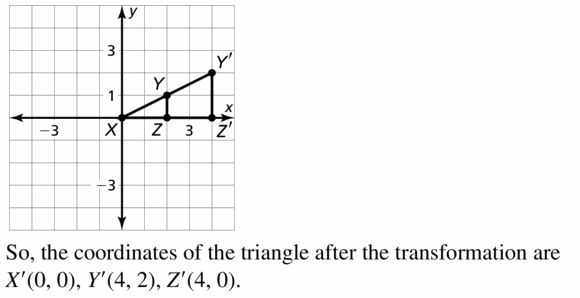
Question 56.
Reflect the trapezoid in the y-axis.
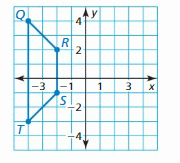
Answer:
Determine whether the equation represents a linear or nonlinear function. Explain.
Question 57.
y – 9 = \(\frac{2}{x}\)
Answer:
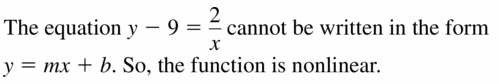
Question 58.
x = 3 + 15y
Answer:
x = 3 + 15y
y = mx + c
15y = 3 – x
y = \(\frac{3 – x}{15}\)
y = \(\frac{3}{15}\) – \(\frac{1}{15}\)x
y = mx + c
The given function is linear
Question 59.
\(\frac{x}{4}\) + \(\frac{y}{12}\) = 1
Answer:
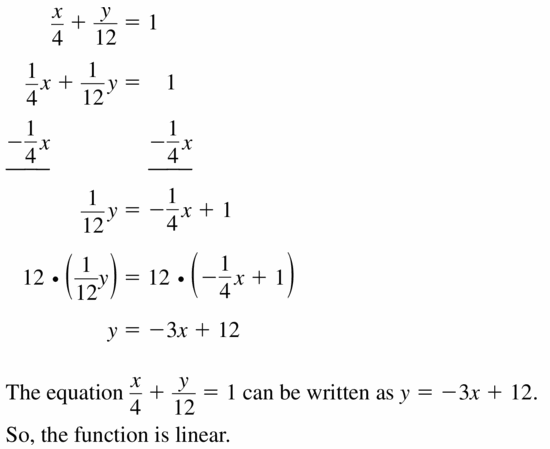
Question 60.
y = 3x4 – 6
Answer:
y = 3x4 – 6
y = mx + c
The given function is non-linear
Lesson 3.6 Transformations of Graphs of Linear Functions
Essential Question
How does the graph of the linear function f(x) = x compare to the graphs of g(x) = f(x) + c and h(x) = f(cx)? Comparing Graphs of Functions
Answer:
f (x) = x
The graph corresponding to the above function will be the vertical line
The given functions are
g (x) = f (x) + c and h (x) = f (cx)
The graph of g (x) will be the vertical line translated i.e., addition or subtraction by c units
The graph of h (x) will be the graph of the function f(x) stretched or compressed by 1/c units
EXPLORATION 1
Comparing Graphs of Functions
Work with a partner. The graph of f(x) = x is shown. Sketch the graph of each function, along with f, on the same set of coordinate axes. Use a graphing calculator to check your results. What can you conclude?
a. g(x) = x + 4
b. g(x) = x + 2
c. g(x) = x – 2
d. g(x) = x – 4

Answer:
a.
g (x) = x + 4
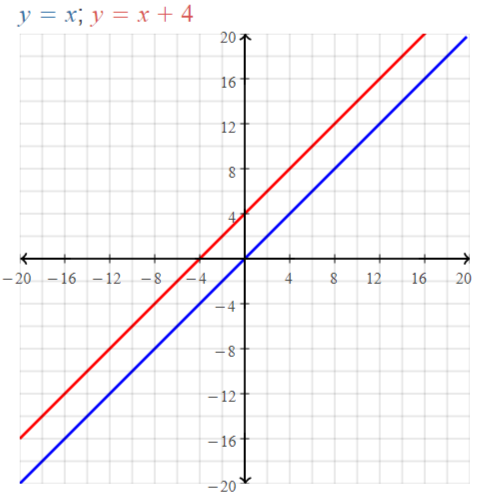
g (x) translated 4 units away from f(x) to the left side i.e., towards the positive y-axis
b. g (x) = x + 2
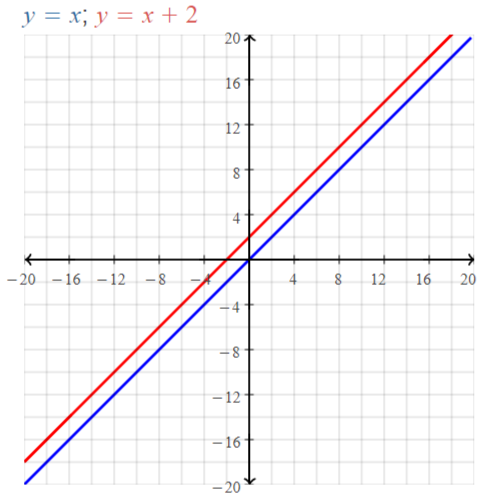
g (x) translated 2 units away from f(x) to the left side i.e., towards the positive y-axis
c. g (x) = x – 2
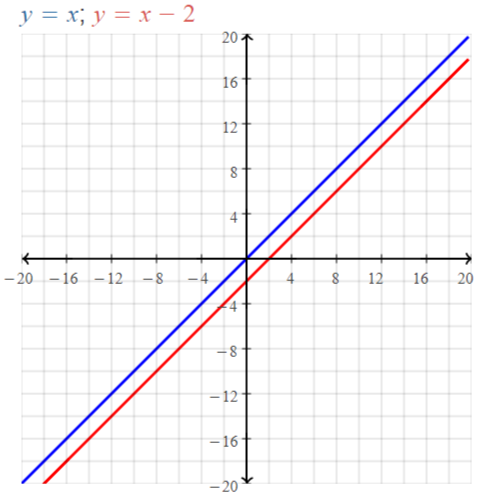
g (x) translated 2 units away from f(x) to the right side i.e., towards the negative y-axis
d.) g (x) = x – 4
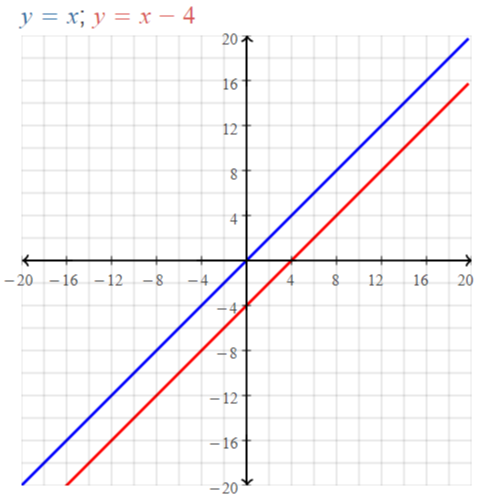
g (x) translated 4 units away from f(x) to the right side i.e., towards the negative y-axis
EXPLORATION 2
Comparing Graphs of Functions
Work with a partner. Sketch the graph of each function, along with f(x) = x, on the same set of coordinate axes. Use a graphing calculator to check your results. What can you conclude?
a. h(x) = \(\frac{1}{2}\)x
b. h(x) = 2x
c. h(x) = –\(\frac{1}{2}\)x
d. h(x) = -2x
Answer:
a. h(x) = \(\frac{1}{2}\)x
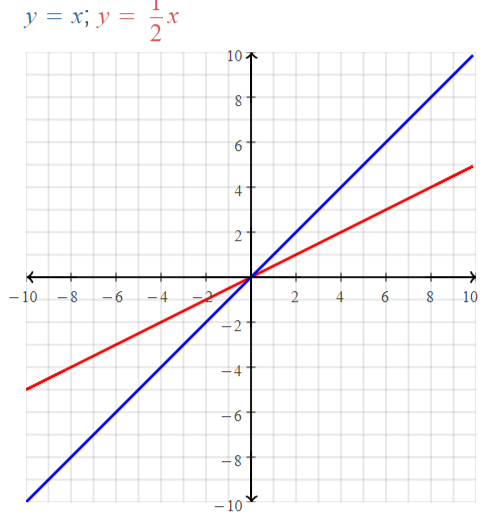
We can conclude that h (x) and f (x) pass through the origin and h (x) is steeper than f (x)
b. h(x) = 2x
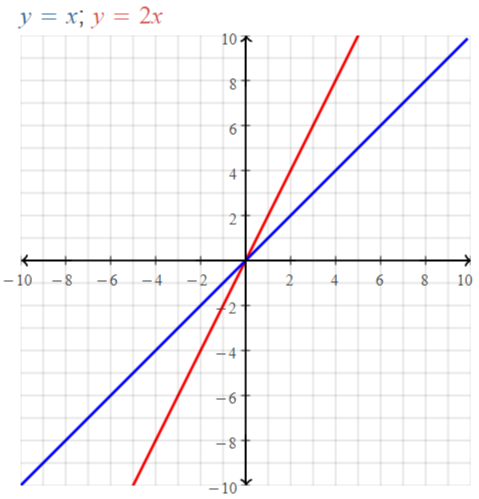
We can conclude that h(x) and f(x) pass through the origin and f (x) is steeper than h (x)
c. h(x) = –\(\frac{1}{2}\)x
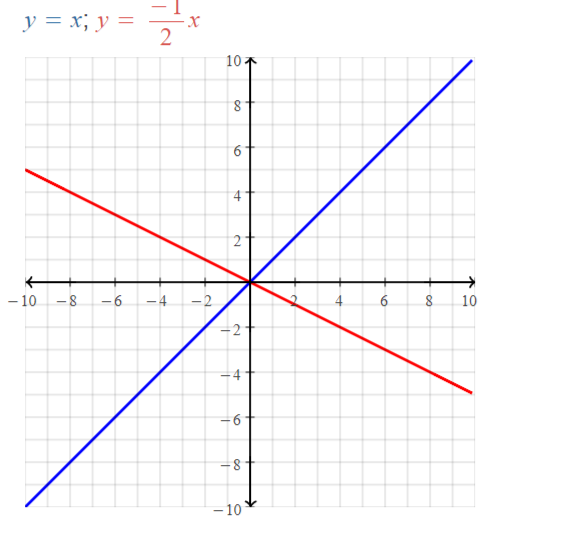
We can conclude that h (x) and f (x) are on opposite axes
d. h(x) = -2x
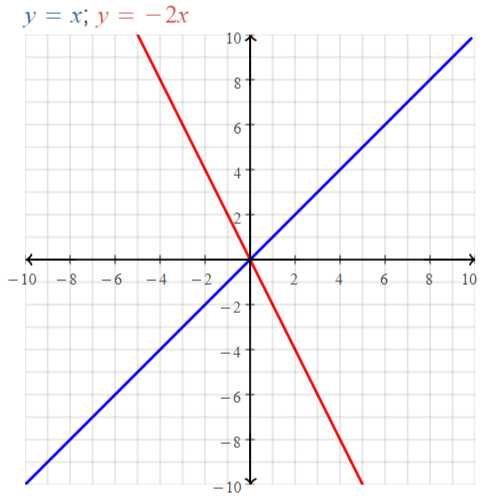
We can conclude that f (x) and h (x) are in the opposite axes
EXPLORATION 3
Matching Functions with Their Graphs
Work with a partner. Match each function with its graph. Use a graphing calculator to check your results. Then use the results of Explorations 1 and 2 to compare the graph of k to the graph of f(x) = x.
a. k(x) = 2x – 4
b. k(x) = -2x + 2
c. k(x) = –\(\frac{1}{2}\)x + 4
d. k(x) = –\(\frac{1}{2}\)x — 2
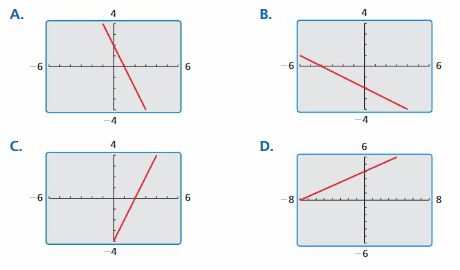
Answer:
a. k(x) = 2x – 4
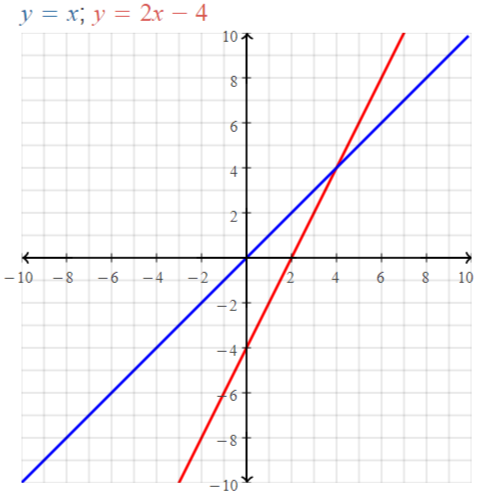
We can conclude that graph C) matches k (x)
By comparing f (x) and k (x),
We can say that k (x) translates 2 units from f (x) towards the positive x-axis
b. k(x) = -2x + 2
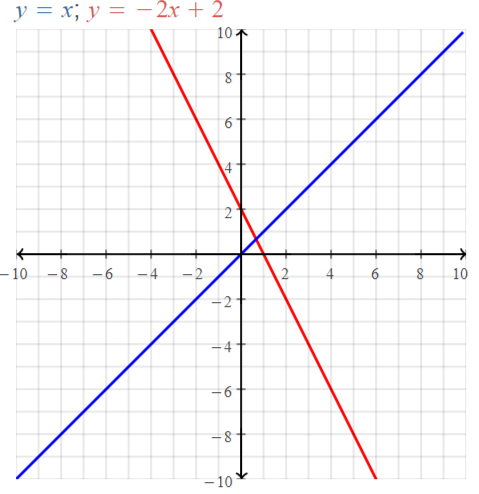
We can conclude that graph A) matches k (x)
By comparing f (x) and k (x),
We can say that k (x) and f (x) are on the opposite axes
c. k(x) = –\(\frac{1}{2}\)x + 4
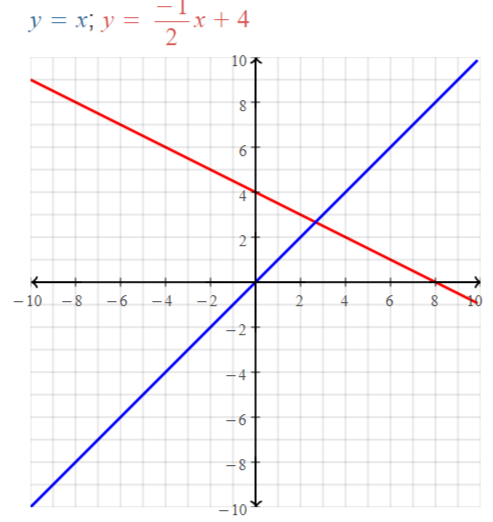
We can conclude that graph D) matches k (x)
By comparing f (x) and k (x),
We can say that k (x) and f (x) are on opposite axes and k (x) only translates through only the positive and negative x-axes
d. k(x) = –\(\frac{1}{2}\)x — 2
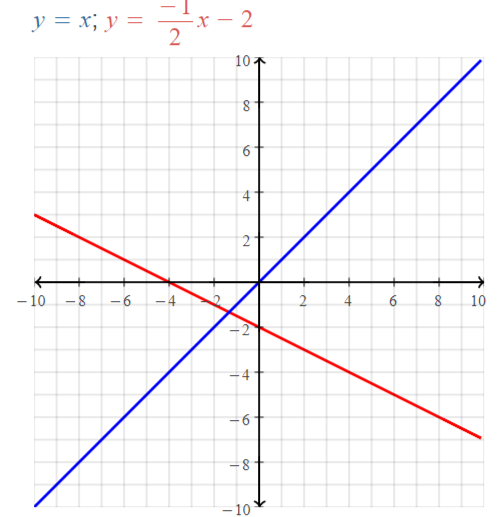
We can conclude that graph B) matches k (x)
By comparing f (x) and k (x),
We can say that k (x) and f(x) are on the opposite axes and k (x) translates through only the negative x-axis and the negative y-axis
Communicate Your Answer
Question 4.
How does the graph of the linear function f(x) = x compare to the graphs of g(x) = f(x) + c and h(x) = f(cx)?
Answer:
Given,
f (x) = x
The graph corresponding to the above function will be the vertical line
g (x) = f (x) + c and h (x) = f (cx)
The graph of g (x) will be the vertical line translated.
The graph of h (x) will be the graph of the function f(x) stretched or compressed by 1/c units
3.6 Lesson
Monitoring Progress
Using f, graph (a) g and (b) h. Describe the transformations from the graph of f to the graphs of g and h.
Question 1.
f(x) = 3x + 1; g(x) = f(x) – 2; h(x) = f(x – 2)
Answer:
f (x) = 3x + 1; g (x) = f (x) – 2 and h (x) = f (x – 2)
g (x) = f (x) – 2
g (x) = 3x + 1 – 2
g (x) = 3x – 1
h (x) = f (x – 2)
h (x) = 3 (x – 2) + 1
h (x) = 3 (x) + 3 (2) + 1
h (x) = 3x + 6 + 1
h (x) = 3x + 7
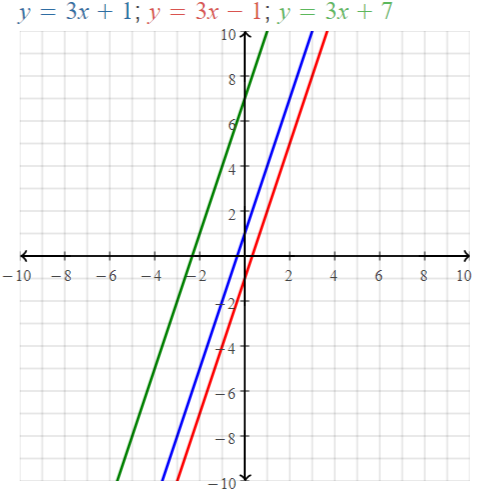
g (x) is translated 2 units away from f (x) toward the positive x-axis and h (x) is translated 5 units away from f (x) toward the positive y-axis
Question 2.
f(x) = -4x – 2; g(x) = -f(x); h(x) = f(-x)
Answer:
f (x) = -4x – 2; g (x) = -f (x) and h (x) = f (-x)
g (x) = -f (x)
g (x) = – (-4x – 2)
g (x) = 4x + 2
h (x) = f (-x)
h (x) = -4 (-x) – 2
h (x) = 4x – 2
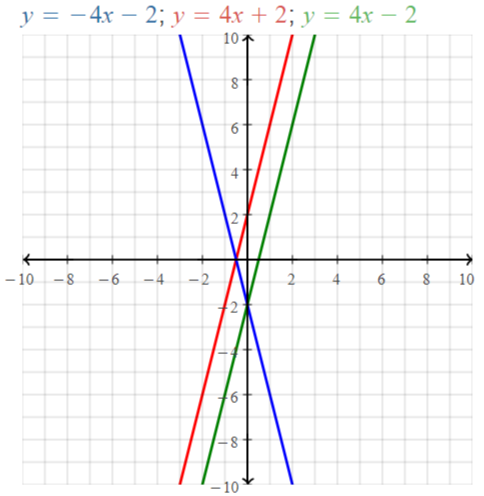
g (x) is translated 2.5 units away from f (x) toward the positive y-axis and h (x) is translated 1 unit away from f (x) toward the positive x-axis
Using f, graph (a) g and (b) h. Describe the transformations from the graph of f to the graphs of g and h.
Question 3.
f(x) = 4x – 2; g(x) = f (\(\frac{1}{2}\)x ); h(x) = 2f(x)
Answer:
f (x) = 4x – 2; g (x) = f (\(\frac{1}{2}\)x ) and h (x) = 2f (x)
g (x) = f (\(\frac{1}{2}\)x )
g (x) = 4 ( f (\(\frac{1}{2}\)x ) – 2
g (x) = 2x – 2
h (x) = 2f (x)
h (x) = 2 (4x – 2)
h (x) = 2 (4x) – 2(2)
h (x) = 8x – 4
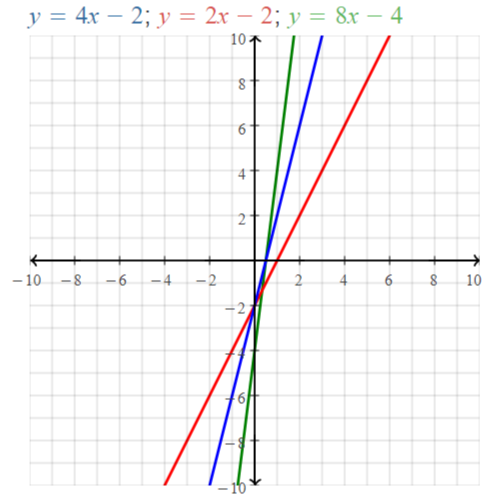
g (x) is translated 0.5 units away from f (x) toward the positive x-axis and h (x) is translated 0 units away from f (x) toward the origin
Question 4.
f(x) = -3x + 4; g(x) = f(2x); h(x) = \(\frac{1}{2}\)f(x)
Answer:
f (x) = -3x + 4; g (x) = f (2x) and h (x) = \(\frac{1}{2}\)f(x)
g (x) = f (2x)
g (x) = -3 (2x) + 4
g (x) = -6x + 4
h (x) = \(\frac{1}{2}\)f(x)
h (x) = \(\frac{1}{2}\) (3x + 4)
h (x) = \(\frac{3}{2}\)x + \(\frac{4}{2}\)
h (x) = \(\frac{3}{2}\)x + 2
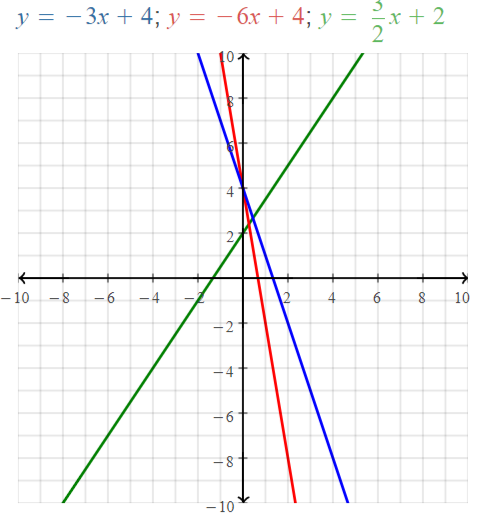
g (x) and f (x) are on the same axis and h (x) and f (x) are on the opposite axis
Question 5.
Graph f(x) = x and h(x) = \(\frac{1}{2}\)x – 2. Describe the transformations from the graph of f to the graph of h.
Answer:
f (x) = x and h (x) = \(\frac{1}{2}\)x – 2
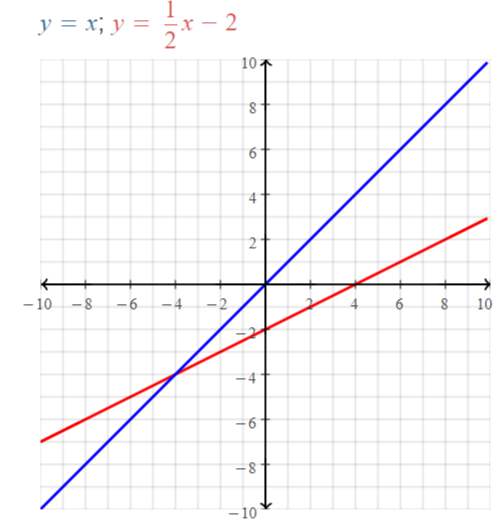
We can conclude that h (x) translated 4 units away from f (x) towards the positive x-axis
Transformations of Graphs of Linear Functions 3.6 Exercises
Vocabulary and Core Concept Check
Question 1.
WRITING
Describe the relationship between f(x) = x and all other nonconstant linear functions.
Answer:
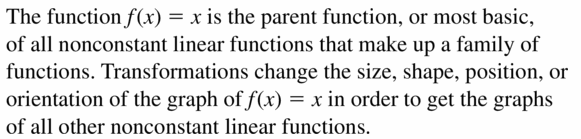
Question 2.
VOCABULARY
Name four types of transformations. Give an example of each and describe how it affects the graph of a function.
Answer:
The four types of transformations that affect the graph of a function are
1. Translation
Example:
f (x) = x and g (x) = 2 f(x)
2. Rotation
Example:
f (x) = 3x + 2 and g (x) = 3x – 2
3. Reflection
Example:
f (x) =x and g (x) =-f (x)
4. Dilation
Example:
f (x) = 3x + 6 and g (x) = f (2x)
Question 3.
WRITING
How does the value of a in the equation y = f(ax) affect the graph of y = f(x)? How does the value of a in the equation y = af(x) affect the graph of y = f(x)?
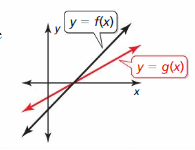
Answer:
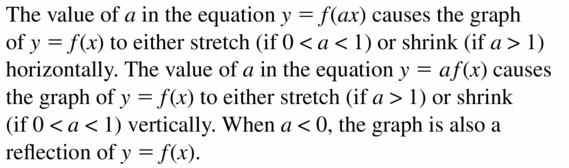
Question 4.
REASONING
The functions f and g are linear functions. The graph of g is a vertical shrink of the graph of f. What can you say about the x-intercepts of the graphs of f and g? Is this always true? Explain.
Answer:
f can be written as f (x)
g can be written as g (x)
It is also given that the graph of g is a vertical shrink of the graph of f.
Since the graph of g shrinks, then the x-intercept of g will also shrink if we observe the functions of f and g
We can conclude that the x-intercept of g will shrink and this is always true
In Exercises 5–10, use the graphs of f and g to describe the transformation from the graph of f to the graph of g.
Question 5.
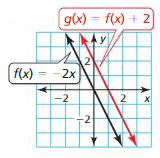
Answer:
Question 6.
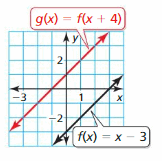
Answer:
f (x) = x – 3
g (x) = f (x + 4)
g (x) = (x + 4) – 3
g (x) = x + 1
When we observe f (x) and g (x), we can say that
g (x) shrinks by 2 units of f (x)
Question 7.
f(x) = \(\frac{1}{3}\)x + 3; g(x) = f(x) = -3
Answer:
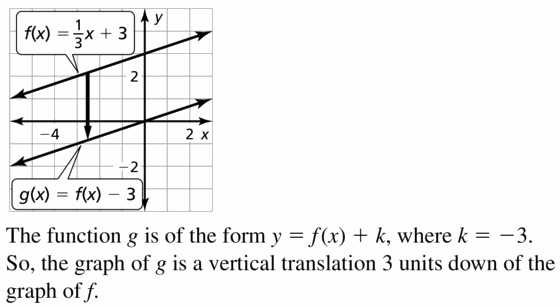
Question 8.
f(x) = -3x + 4; g(x) = f(x) + 1
Answer:
f (x) = -3x + 4
g (x) = f (x) + 1
g (x) = -3x + 4 + 1
g (x) = -3x + 5
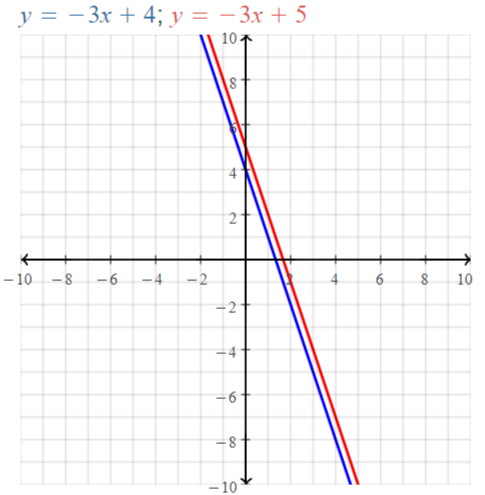
We can conclude that g (x) translates 1 unit away from f (x)
Question 9.
f(x) = -x – 2; g(x) = f(x + 5)
Answer:
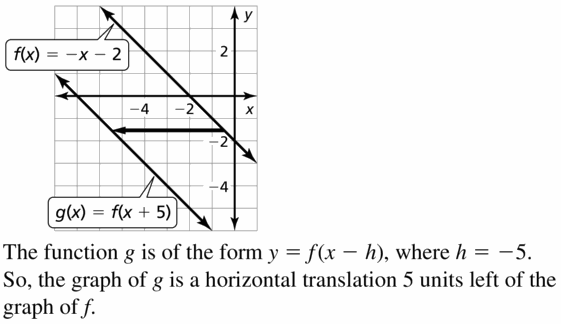
Question 10.
f(x) = \(\frac{1}{2}\)x – 5; g(x) = f(x – 3)
Answer:
f (x) = \(\frac{1}{2}\)x – 5
g (x) = f (x – 3)
g (x) = \(\frac{1}{2}\) ( x – 3 ) – 5
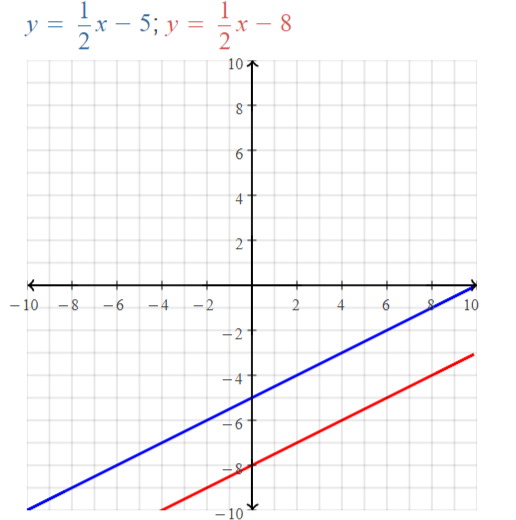
We can conclude that g (x) is dilated from f (x)
Question 11.
MODELING WITH MATHEMATICS
You and a friend start biking from the same location. Your distance d (in miles) after t minutes is given by the function d(t) = \(\frac{1}{5}\)t. Your friend starts biking 5 minutes after you. Your friend’s distance f is given by the function f(t) = d(t – 5). Describe the transformation from the graph of d to the graph of f.

Answer:
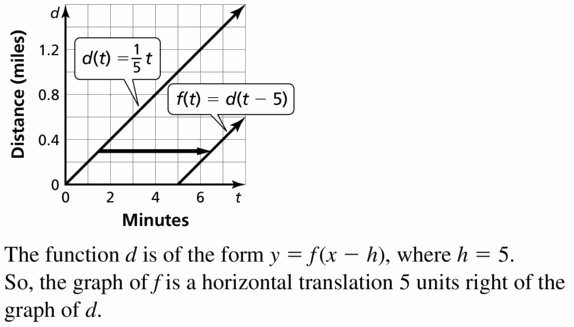
Question 12.
MODELING WITH MATHEMATICS
The total cost C (in dollars) to cater an event with p people is given by the function C(p) = 18p + 50. The set-up fee increases by $25. The new total cost T is given by the function T(p) = C(p) + 25. Describe the transformation from the graph of C to the graph of T.

Answer:
The total cost C (in dollars) to cater an event with p people is given by the function
C(p) = 18p + 50
It is also given that the set-up fee increases by $25.
The new total cost T is given by the function
T(p) = C(p) + 25
T (p) = 18p + 50 + 25
T (p) = 18p + 75
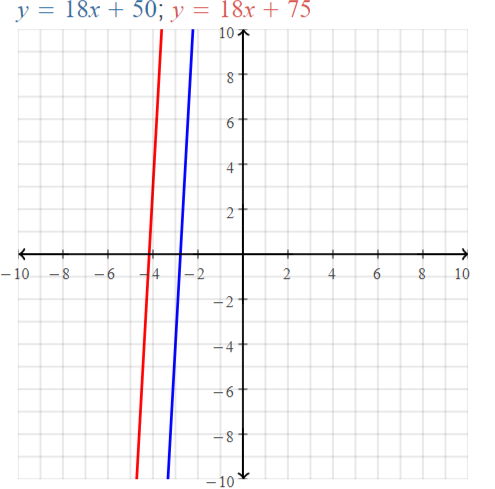
We can conclude that T (p) translated 25 units away from C (p)
In Exercises 13–16, use the graphs of f and h to describe the transformation from the graph of f to the graph of h.
Question 13.
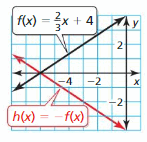
Answer:
![]()
Question 14.
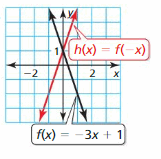
Answer:
f (x) = -3x + 1
h (x) = f (-x)
h (x) = -3 (-x) + 1
h (x) = 3x + 1
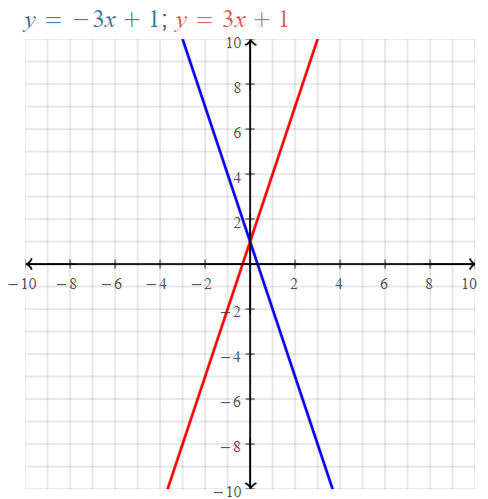
We can conclude that f (x) and h (x) are perpendicular lines
Question 15.
f(x) = -5 – x; h(x) = f(-x)
Answer:
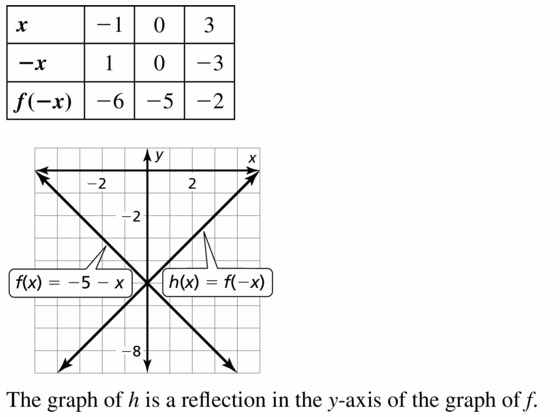
Question 16.
f(x) = \(\frac{1}{4}\)x – 2; h(x) = -f(x)
Answer:
f (x) = \(\frac{1}{4}\)x – 2
h (x) = – f(x)
h (x) = – (\(\frac{1}{4}\)x – 2)
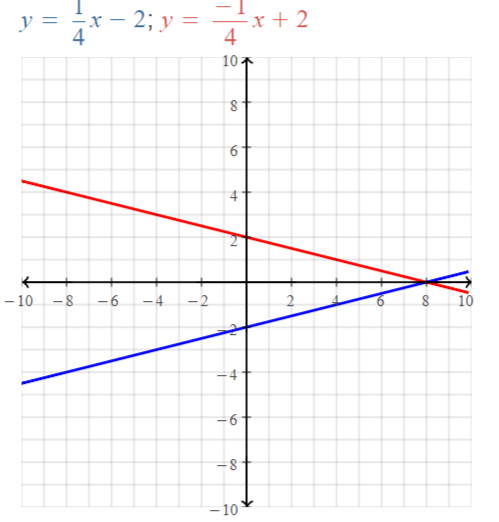
We can conclude that h (x) is a reflection of f (x) on the y-axis
In Exercises 17–22, use the graphs of f and r to describe the transformation from the graph of f to the graph of r.
Question 17.
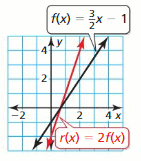
Answer:
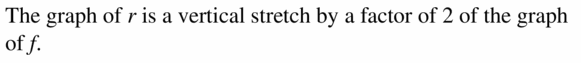
Question 18.
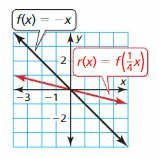
Answer:
f (x) = -x
r (x) = f (\(\frac{1}{4}\) x)
r (x) = –\(\frac{1}{4}\)x
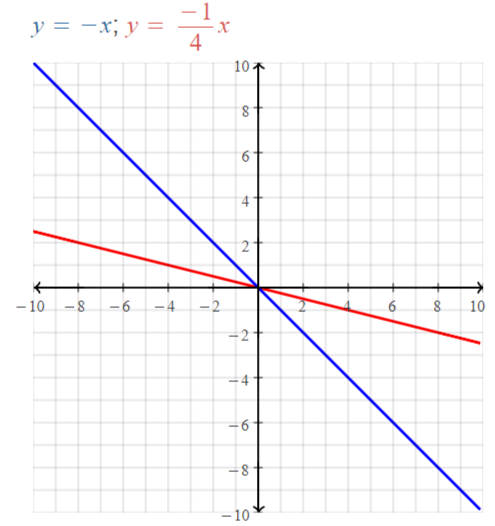
We can conclude that r (x) shrinks by \(\frac{1}{4}\) of f (x)
Question 19.
f(x) = -2x – 4; r(x) = f(\(\frac{1}{2}\)x )
Answer:
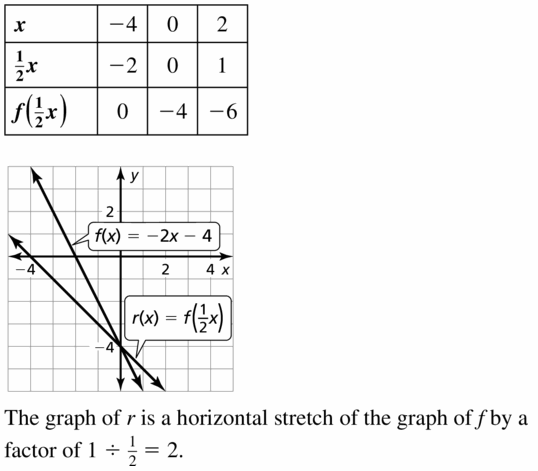
Question 20.
f(x) = 3x + 5; r(x) = f (\(\frac{1}{3}\)x)
Answer:
f (x) = 3x + 5
r (x) = f (\(\frac{1}{3}\)x)
r (x) = 3 ( \(\frac{1}{3}\) x ) + 5
r (x) = x + 5
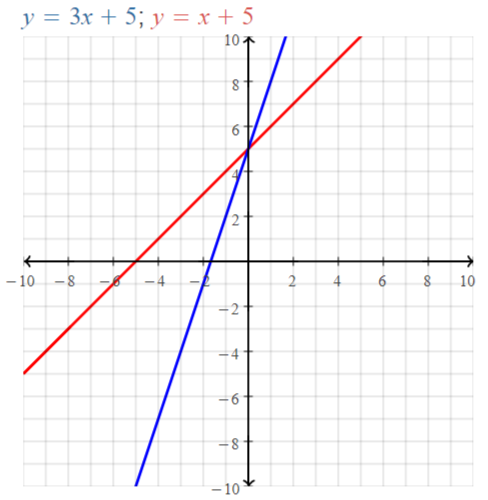
We can conclude that r (x) shrinks by 1 unit of f (x)
Question 21.
f(x) = \(\frac{2}{3}\)x + 1; r(x) = 3f(x)
Answer:
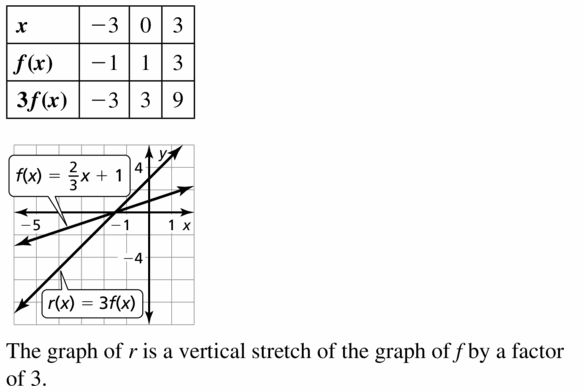
Question 22.
f(x) = –\(\frac{1}{4}\)x – 2; r(x) = 4f(x)
Answer:
f (x) = –\(\frac{1}{4}\)x – 2
r (x) = 4 f (x)
r (x) = 4 [-\(\frac{1}{4}\)x – 2]
r (x) = -x – 8
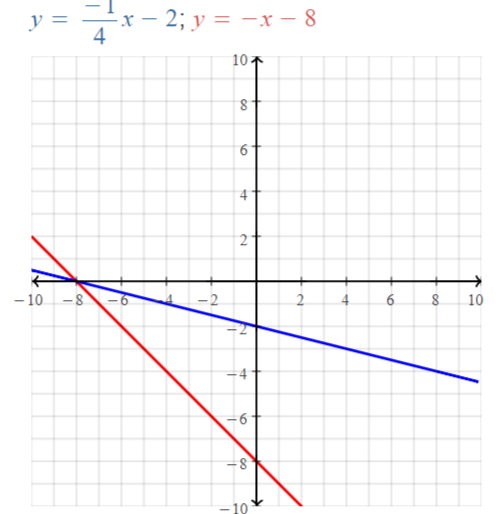
We can conclude that r (x) translates 4 units away from f (x)
In Exercises 23–28, use the graphs of f and h to describe the transformation from the graph of f to the graph of h.
Question 23.
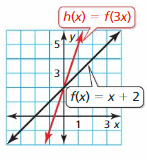
Answer:
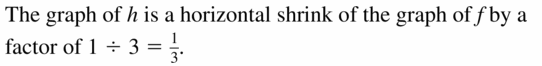
Question 24.
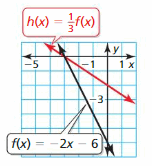
Answer:
f (x) = -2x – 6
h (x) = \(\frac{1}{3}\) f(x)
h (x) = –\(\frac{1}{3}\) (2x + 6)
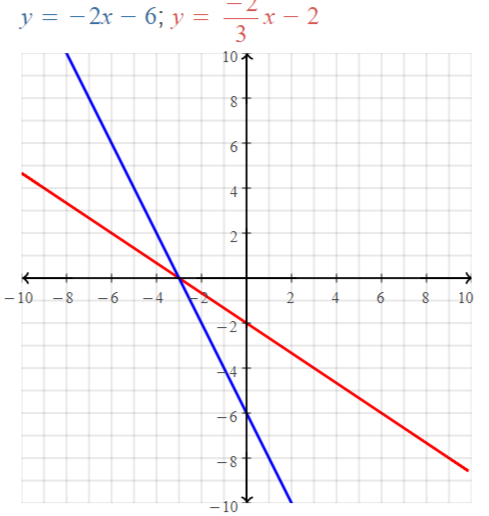
We can conclude that h (x) stretches by \(\frac{1}{3}\) of f (x)
Question 25.
f(x) = 3x – 12; h(x) = \(\frac{1}{6}\)f(x)
Answer:
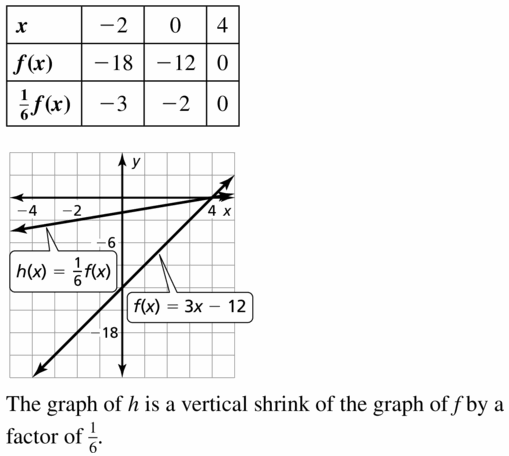
Question 26.
f(x) = -x + 1; h(x) = f(2x)
Answer:
f (x) = -x + 1
h (x) = f (2x)
h (x) = -(2x) + 1
h (x) = -2x + 1
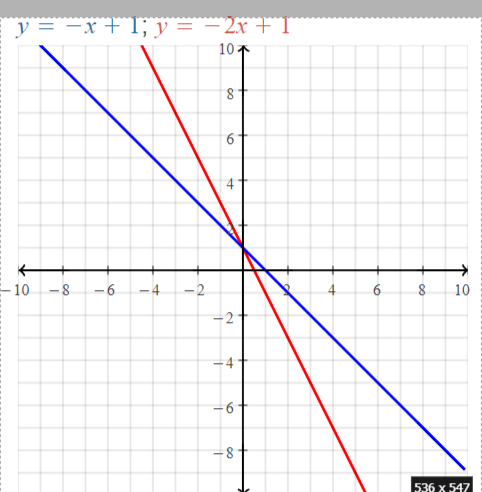
We can conclude that h (x) stretches by 1 unit from f (x)
Question 27.
f(x) = -2x – 2; h(x) = f(5x)
Answer:
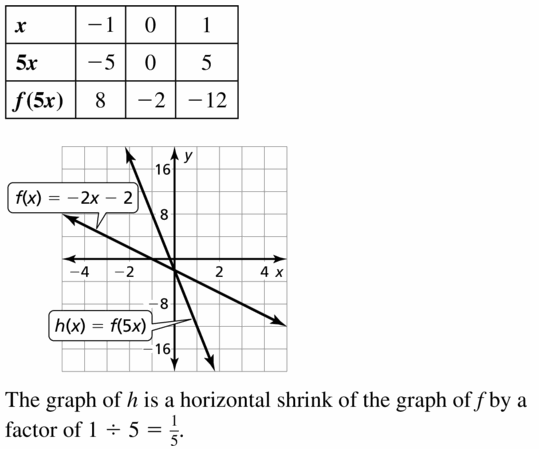
Question 28.
f(x) = 4x + 8; h(x) = \(\frac{3}{4}\)f(x)
Answer:
f (x) = 4x + 8
h (x) = \(\frac{3}{4}\) f (x)
h (x) = \(\frac{3}{4}\) (4x + 8)
h (x) = \(\frac{3}{4}\) (4x) + \(\frac{3}{4}\) (8)
h (x) = 3x + 6
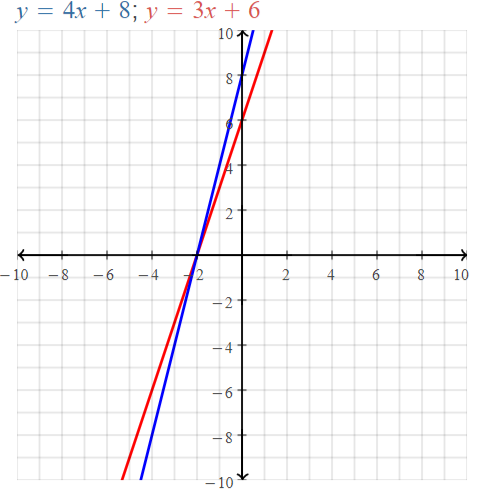
We can conclude that h (x) shrinks by 2 units from f (x)
In Exercises 29–34, use the graphs of f and g to describe the transformation from the graph of f to the graph of g.
Question 29.
f(x) = x – 2; g(x) = \(\frac{1}{4}\)f(x)
Answer:
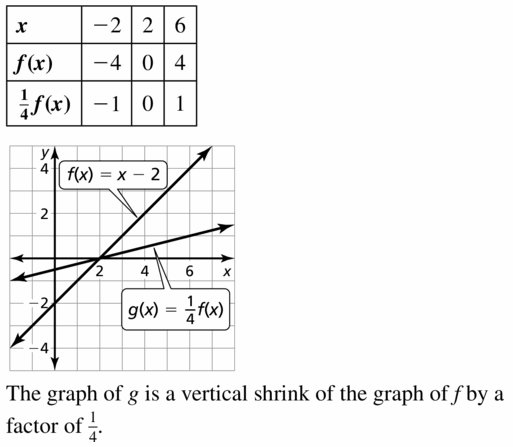
Question 30.
f(x) = -4x + 8; g(x) = -f(x)
Answer:
f (x) = -4x + 8
g (x) = -f (x)
g (x) = -4 (-x) + 8
g (x) = 4x + 8
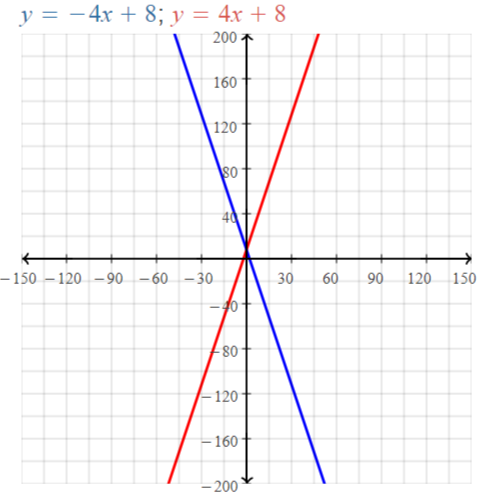
We can conclude that g (x) is a reflection of f (x)
Question 31.
f(x) = -2x – 7; g(x) = f(x – 2)
Answer:
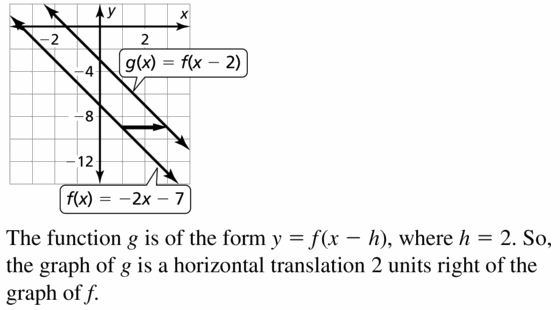
Question 32.
f(x) = 3x + 8; g(x) = f(\(\frac{2}{3}\)x)
Answer:
f (x) = 3x + 8
g (x) = f (\(\frac{2}{3}\)x)
g (x) = 3 ( \(\frac{2}{3}\) ) x + 8
g (x) = 2x + 8
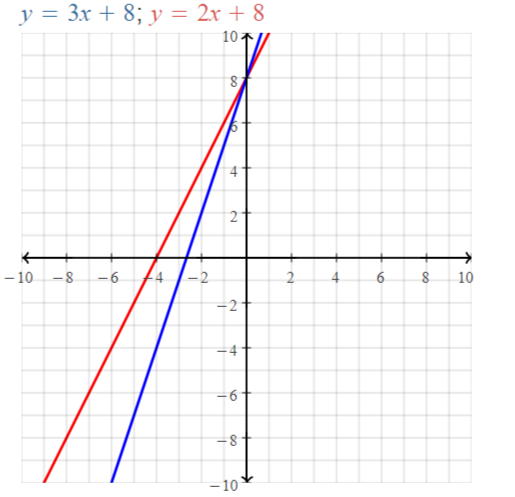
We can conclude that g (x) shrink by 1 unit of the graph of f (x)
Question 33.
f(x) = x – 6; g(x) = 6f(x)
Answer:
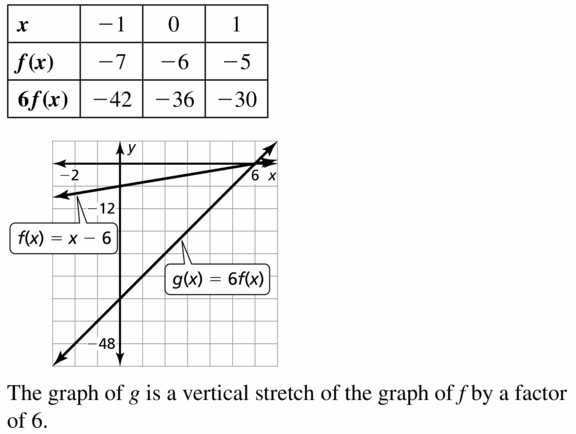
Question 34.
f(x) = -x; g(x) = f(x) -3
Answer:
f (x) = -x
g (x) = f (x) – 3
g (x) = -x – 3
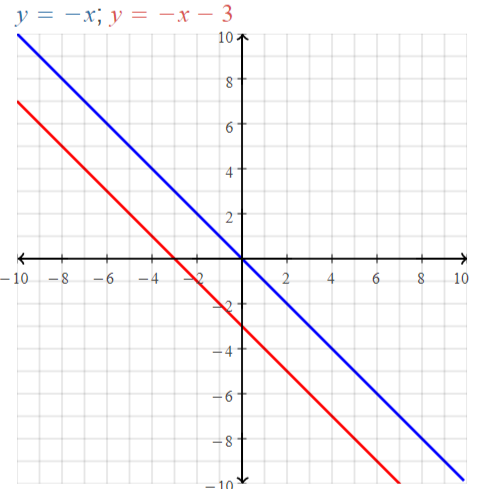
We can conclude that g (x) is translated by 3 units away from f (x)
In Exercises 35–38, write a function g in terms of f so that the statement is true.
Question 35.
The graph of g is a horizontal translation 2 units right of the graph of f.
Answer:
![]()
Question 36.
The graph of g is a reflection in the y-axis of the graph of f.
Answer:
The graph of g is a reflection of f(x) in the y-axis of the graph of f (x)
Reflection in the y-axis means if f (x) is +ve, then the reflection of f (x) will be -ve and vice-versa
The representation of the given statement in terms of f(x) is
g (x) = f (-x)
Question 37.
The graph of g is a vertical stretch by a factor of 4 of the graph of f.
Answer:
![]()
Question 38.
The graph of g is a horizontal shrink by a factor of \(\frac{1}{5}\) of the graph of f.
Answer:
The graph of g is a horizontal shrink by a factor of \(\frac{1}{5}\) of the graph
“Shrink” is represented by ‘-‘
“Stretch” is represented by ‘+’
The representation of the given statement in terms of f (x) is
g (x) = – \(\frac{1}{5}\) f (x)
ERROR ANALYSIS In Exercises 39 and 40, describe and correct the error in graphing g.
Question 39.
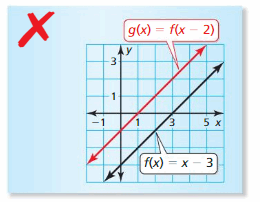
Answer:
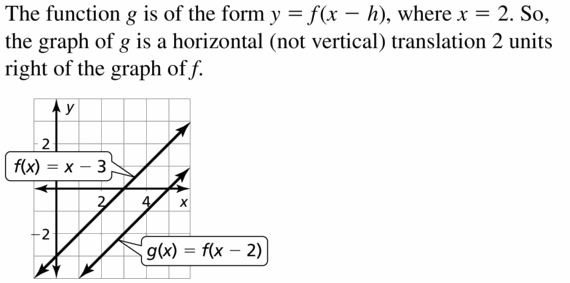
Question 40.
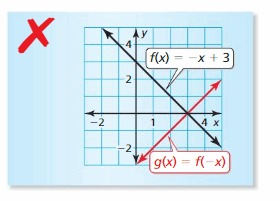
Answer:
f (x) = -x + 3 and g (x) = f (-x)
g (x) = -[-x] + 3
g (x) = x + 3
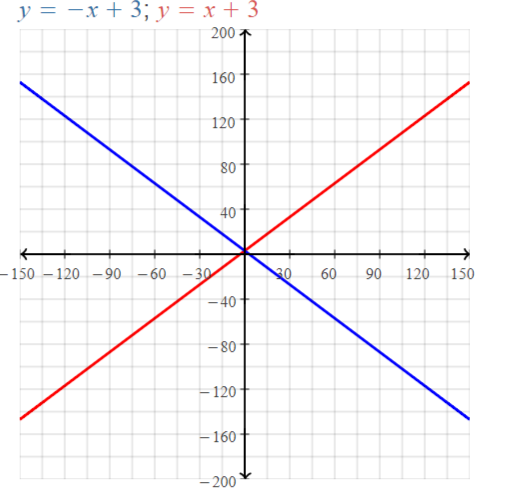
We can conclude that f (x) and g (x) are perpendicular lines from the graph
In Exercises 41–46, graph f and h. Describe the transformations from the graph of f to the graph of h.
Question 41.
f(x) = x; h(x) = \(\frac{1}{3}\)x + 1
Answer:
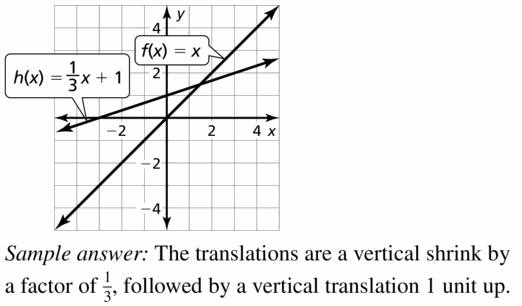
Question 42.
f(x) = x; h(x) = 4x – 2
Answer:
f (x) = x and h (x) = 4x – 2
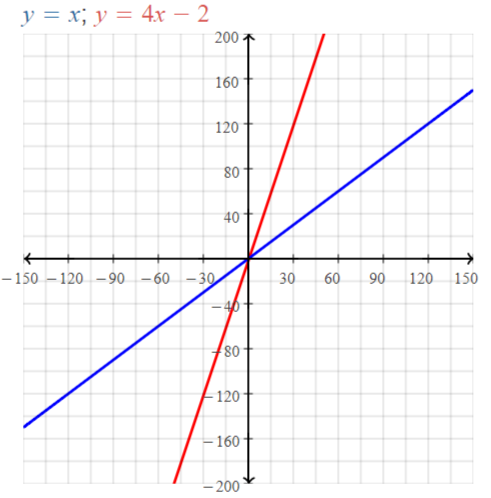
We can conclude that the transformations are a vertical stretch by a factor of 4 followed by a vertical translation of 2 units down
Question 43.
f(x) = x; h(x) = -3x – 4
Answer:
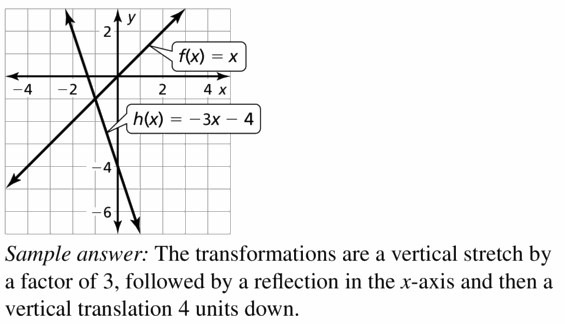
Question 44.
f(x) = x; h(x) = –\(\frac{1}{2}\)x + 3
Answer:
f (x) = x and h (x) = –\(\frac{1}{2}\)x + 3
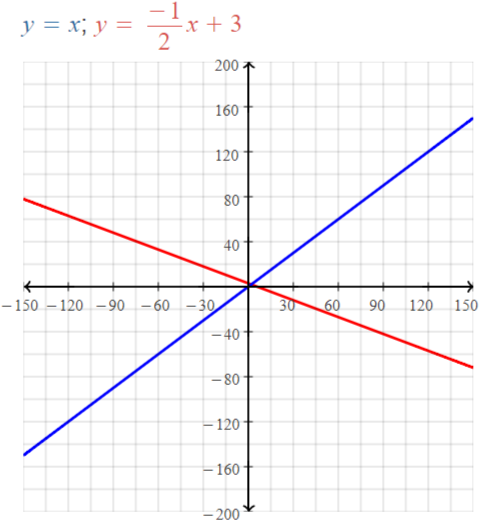
We can conclude that the transformations are a vertical shrink by a factor of \(\frac{1}{2}\) followed by a vertical translation of 3 units up
Question 45.
f(x) = 2x; h(x) = 6x – 5
Answer:
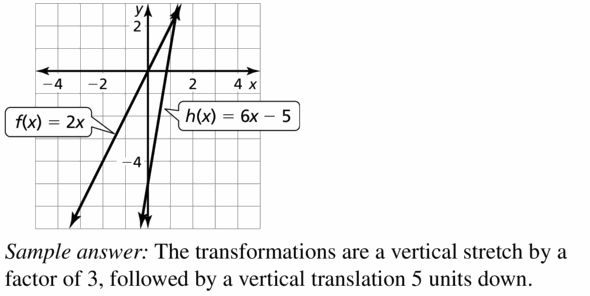
Question 46.
f(x) = 3x; h(x) = -3x – 7
Answer:
f (x) = 3x and h (x) = -3x – 7
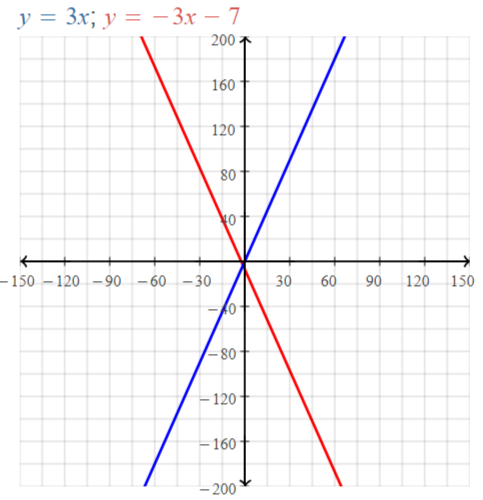
We can conclude that the transformations are a vertical shrink by a factor of 3 followed by a vertical translation of 7 units down
Question 47.
MODELING WITH MATHEMATICS
The function t(x) = -4x +72 represents the temperature from 5 P.M. to 11 P.M., where x is the number of hours after 5 P.M. The function d(x) = 4x + 72 represents the temperature from 10 A.M. to 4 P.M., where x is the number of hours after 10 A.M. Describe the transformation from the graph of t to the graph of d.
Answer:
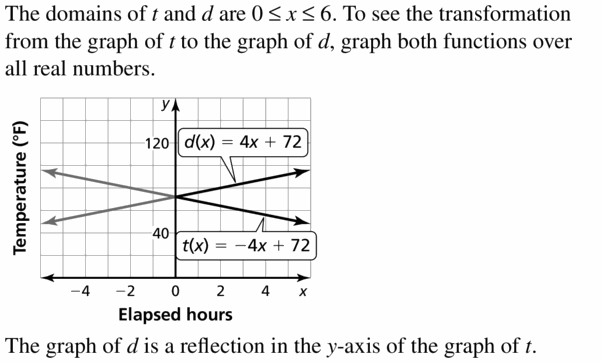
Question 48.
MODELING WITH MATHEMATICS
A school sells T-shirts to promote school spirit. The school’s profit is given by the function P(x) = 8x – 150, where x is the number of T-shirts sold. During the playoffs, the school increases the price of the T-shirts. The school’s profit during the play-offs is given by the function Q(x) = 16x – 200, where x is the number of T-shirts sold. Describe the transformations from the graph of P to the graph of Q.

Answer:
A school sells T-shirts to promote school spirit.
The school’s profit is given by the function
P(x) =8x- 150
where,
x is the number of T-shirts sold
Q(x) = 16x – 200
where,
x is the number of T-shirts sold.
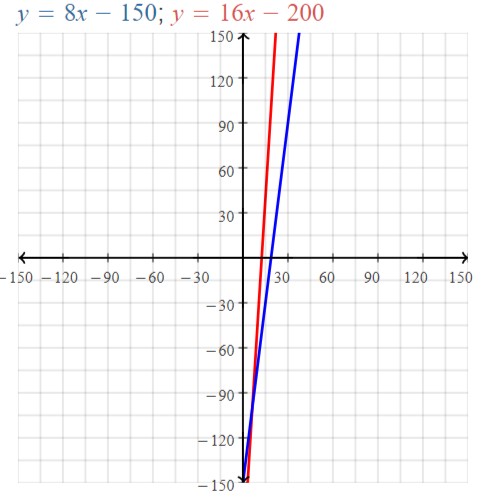
The x-axis shrink by a factor of 2
The y-axis shrink by 50
Question 49.
USING STRUCTURE
The graph of g(x) = a • f(x – b) + c is a transformation of the graph of the linear function f. Select the word or value that makes each statement true.
a. The graph of g is a vertical ______ of the graph of f when a = 4, b = 0, and c = 0.
b. The graph of g is a horizontal translation ______ of the graph of f when a = 1, b = 2, and c = 0.
c. The graph of g is a vertical translation 1 unit up of the graph of f when a = 1, b = 0, and c = ____.
Answer:
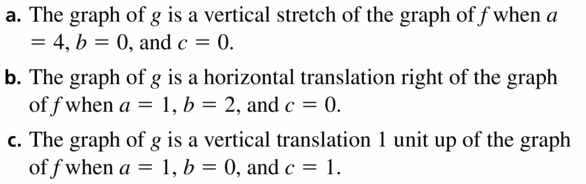
Question 50.
USING STRUCTURE
The graph of h(x) = a • f(bx – c) + d is a transformation of the graph of the linear function f. Select the word or value that makes each statement true.
a. The graph of h is a ______ shrink of the graph of f when a = \(\frac{1}{3}\), b = 1, c = 0, and d = 0.
b. The graph of h is a reflection in the ______ of the graph of f when a = 1, b = -1, c = 0, and d = 0.
c. The graph of h is a horizontal stretch of the graph of f by a factor of 5 when a = 1, b = _____, c = 0, and d = 0.
Answer:
a. a = \(\frac{1}{3}\),
b = 1
c = 0
d = 0
h (x) = \(\frac{1}{3}\)f (1 (x) – 0) + 0
h (x) = \(\frac{1}{3}\) f (x)
h (x) = \(\frac{1}{3}\)x
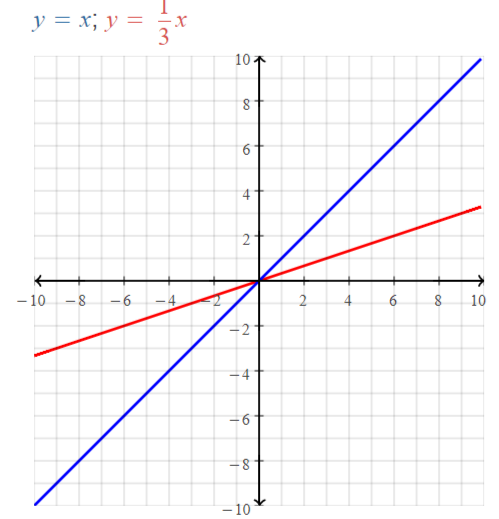
The graph of h is a vertical shrink of the graph of f when a = \(\frac{1}{3}\), b = 1, c = 0, and d = 0.
b. a = 1
b = -1
c = 0
d = 0
h (x) = 1f (-1 (x) – 0) + 0
h (x) = f (-x)
h (x) = -x
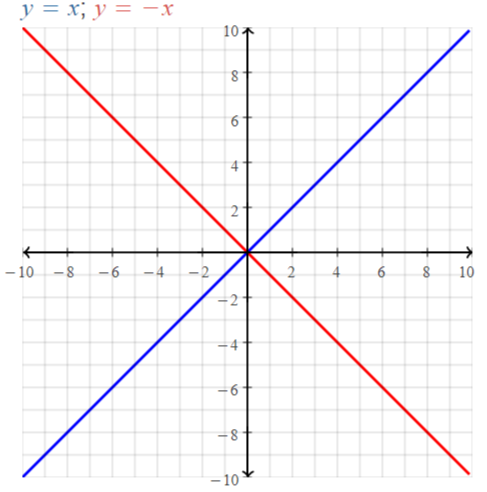
The graph of h is a reflection in the y-axis of the graph of f when a = 1, b = -1, c = 0, and d = 0
c. a = 1
b = p
c = 0
d = 0
h (x) = 1f (p (x) – 0) + 0
h (x) = f (px)
h (x) = px
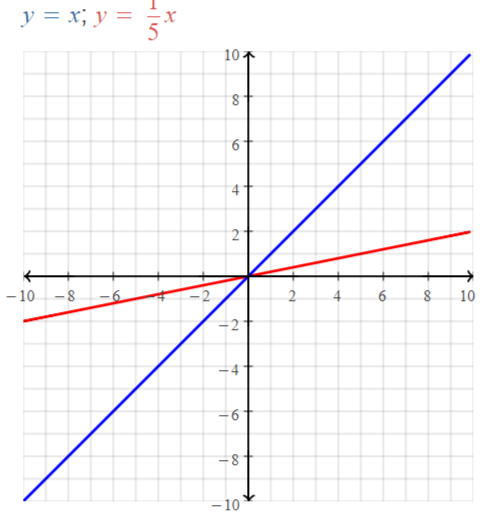
The graph of h is a horizontal stretch of the graph of f by a factor of 5 when a = 1, b = \(\frac{1}{5}\), c = 0, and d = 0
Question 51.
ANALYZING GRAPHS
Which of the graphs are related by only a translation? Explain.
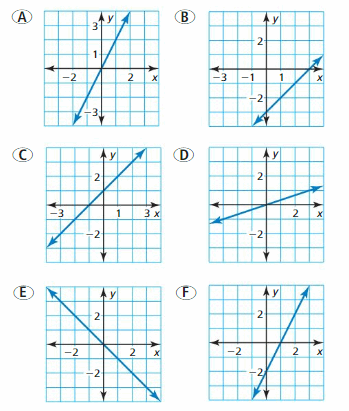
Answer:
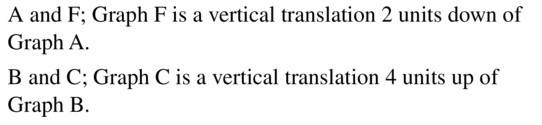
Question 52.
ANALYZING RELATIONSHIPS
A swimming pool is filled with water by a hose at a rate of 1020 gallons per hour. The amount v (in gallons) of water in the pool after t hours is given by the function v(t) = 1020t. How does the graph of v change in each situation?
a. A larger hose is found. Then the pool is filled at a rate of 1360 gallons per hour.
Answer:
A swimming pool is filled with water by a hose at a rate of 1020 gallons per hour.
The amount v (in gallons) of water in the pool after t hours is given by the function
v(t) = 1020t
A pool is filled at a rate of 1360 gallons per hour
The overall rate change = 1340 / 1020
= 440 / 330
= 4 / 3
f (t) = (4 / 3) v (t)
The representation of the graph of v using the functions v (t) = 1020t and v (t) = 1360t is:
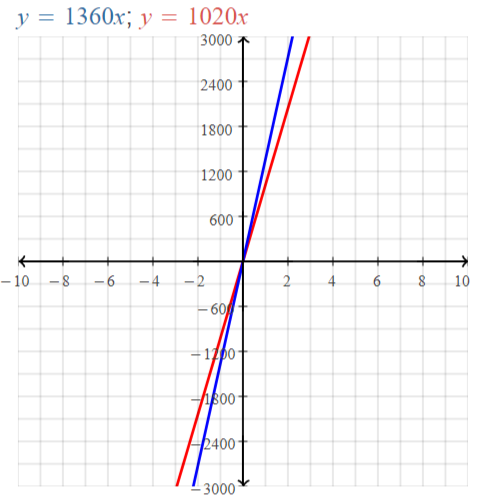
b. Before filling up the pool with a hose, a water truck adds 2000 gallons of water to the pool.
Answer:
v (t) = 1020t
Before filling up the pool with a hose, a water truck adds 2000 gallons of water to the pool
v (t) = 1020t + 2000
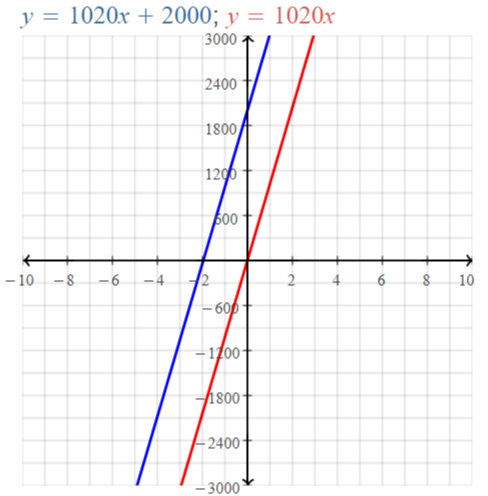
Question 53.
ANALYZING RELATIONSHIPS
You have $50 to spend on fabric for a blanket. The amount m (in dollars) of money you have after buying y yards of fabric is given by the function m(y) = -9.98y + 50. How does the graph of m change in each situation?

a. You receive an additional $10 to spend on the fabric.
b. The fabric goes on sale, and each yard now costs $4.99.
Answer:
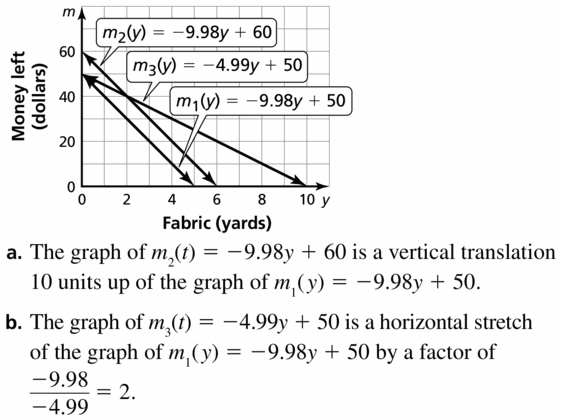
Question 54.
THOUGHT-PROVOKING
Write a function g whose graph passes through the point (4, 2) and is a transformation of the graph of f(x) = x.
Answer:
A function g whose graph passes through the point (4, 2) and is a transformation of the graph of f(x) = x
y = f(x – h) + k
From (4, 2)
As the translation between the values of x and y in the given point is 2,
We can make the value of ‘h’ as -2
We can make the value of k as -4
The equation that passes through (4, 2) is
y = (x + 2 ) – 4
y = x – 2
The function that passes through (4, 2) is
g (x) = x – 2
In Exercises 55–60, graph f and g. Write g in terms of f. Describe the transformation from the graph of f to the graph of g.
Question 55.
f(x) = 2x – 5; g(x) = 2x – 8
Answer:
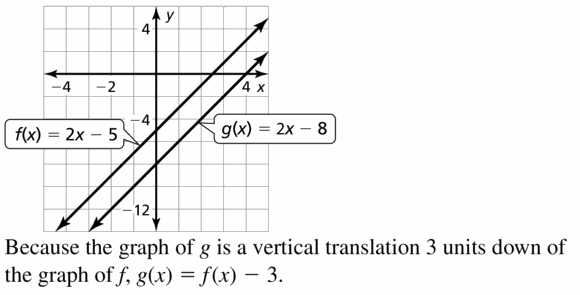
Question 56.
f(x) = 4x + 1; g(x) = -4x – 1
Answer:
f (x) = 4x + 1
g (x) = -4x – 1
g (x) = – (4x + 1)
g (x) = -f (x)
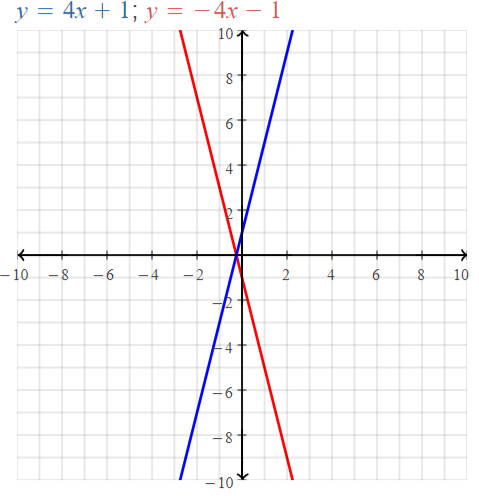
We can conclude that f (x) and g (x) are on the opposite quadrants
Question 57.
f(x) = 3x + 9; g(x) = 3x + 15
Answer:
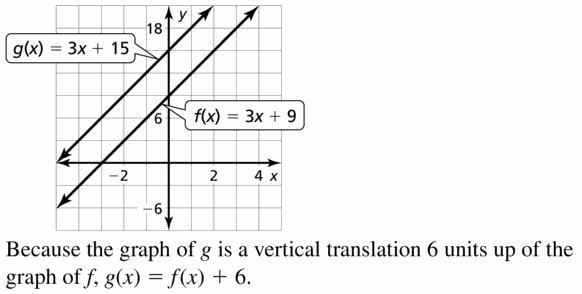
Question 58.
f(x) = -x – 4 ; g(x) = x – 4
Answer:
f (x) = -x – 4
g (x) = x – 4
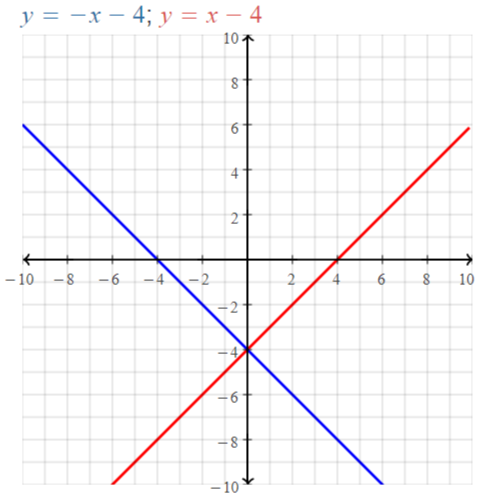
We can conclude that f (x) and g (x) are perpendicular lines since only the slopes vary and the y-intercepts are the same
Question 59.
f(x) = x + 2; g(x) = \(\frac{2}{3}\)x + 2
Answer:
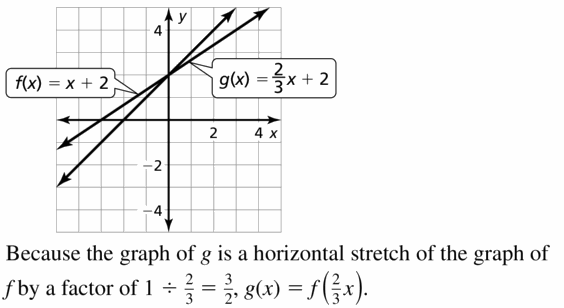
Question 60.
f(x) = x – 1; g(x) = 3x – 3
Answer:
f (x) = x – 1
g (x) = 3x – 3
g (x) = 3 (x – 1)
g (x) = 3 f (x)
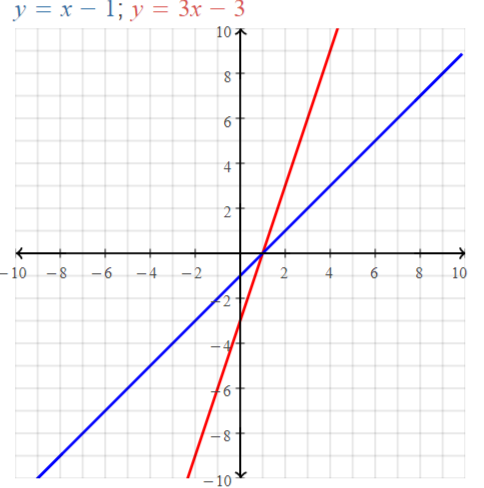
We can conclude that g (x) translates 3 units away from f (x)
Question 61.
REASONING
The graph of f(x) = x + 5 is a vertical translation 5 units up of the graph of f(x) = x. How can you obtain the graph of f(x) = x + 5 from the graph of f(x) = x using a horizontal translation?
Answer:
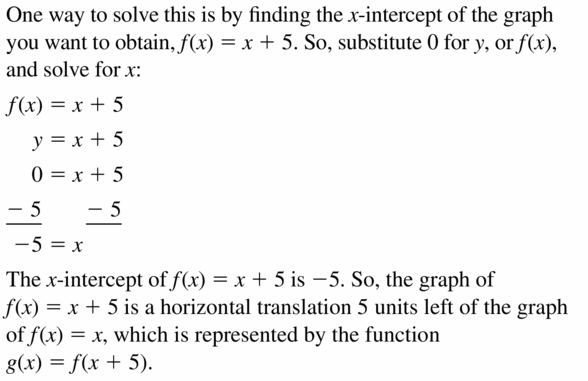
Question 62.
HOW DO YOU SEE IT? Match each function with its graph. Explain your reasoning.
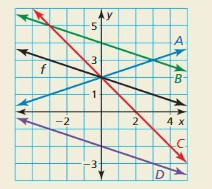
a. a(x) = f(-x)
b. g(x) = f(x) – 4
c. h(x) = f(x) + 2
d. k(x) = f(3x)
Answer:
REASONING
In Exercises 63–66, find the value of r.
Question 63.
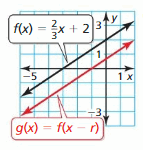
Answer:
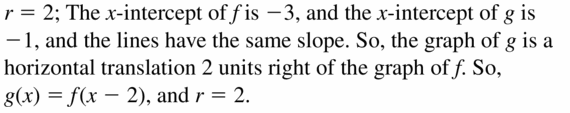
Question 64.
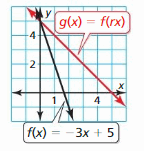
Answer:
f (x) = -3x + 5
g (x) = f (rx)
g (x) = -3 (rx) + 5
Where,
r is the transformational factor
The x-intercept of g(x) is 5
To find the x-intercept, put y = 0
0 = -3 (rx) + 5
3 (rx) = 5
3r (5) = 5
3r = 5 / 5
3r = 1
r = \(\frac{1}{3}\)
We can conclude that the value of r is \(\frac{1}{3}\)
Question 65.
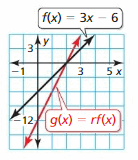
Answer:
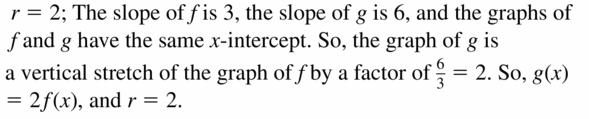
Question 66.
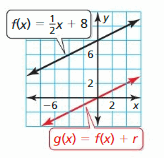
Answer:
f (x) = \(\frac{1}{2}\)x + 8
g (x) = f (x) + r
g (x) = \(\frac{1}{2}\)x + 8 + r
We can observe that f (x) and g (x) are both the parallel lines
The slopes of f (x) and g (x) are the same and only the y-intercepts differ in f (x) and g (x)
We can observe that the y-intercept of g (x) is 0
g (x) = \(\frac{1}{2}\)x + 8 + 0
We can conclude that the value of r is 0
Question 67.
CRITICAL THINKING
When is the graph of y = f(x) + w the same as the graph of y = f(x + w) for linear functions? Explain your reasoning.
Answer:
Maintaining Mathematical Proficiency
Solve the formula for the indicated variable.(Section 1.5)
Question 68.
Solve for h.
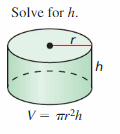
Answer:
V = πr²h
Divide by πr² into both sides
\(\frac{V}{πr²}\) = h
We can conclude that the formula for ‘h’ is
h = \(\frac{V}{πr²}\)
Question 69.
Solve for w.
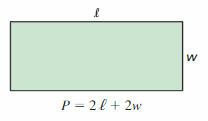
Answer:
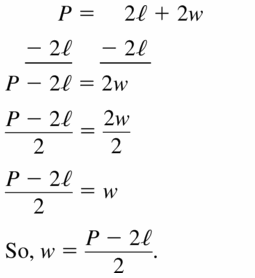
Solve the inequality. Graph the solution, if possible. (Section 2.6)
Question 70.
| x – 3 | ≤ 14
Answer:
| x + 3 | ≤ 14
| x | = x for x > 0
| x | = -x for x < 0
x + 3 ≤ 14 and x + 3 ≥ -14
x ≤ 14 – 3 and x ≥ -14 – 3
x ≤ 11 and x ≥ -17
We can conclude that the solutions to the given absolute value inequality are
x ≤11 and x ≥ -17
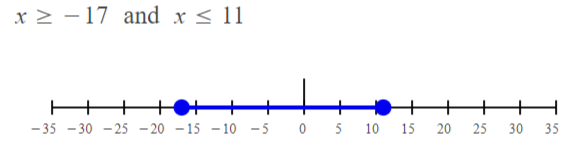
Question 71.
| 2x + 4 | > 16
Answer:
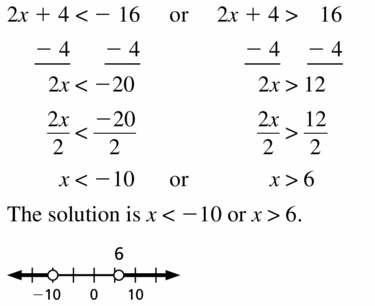
Question 72.
5 | x + 7 | < 25
Answer:
5 | x + 7 | < 25
| x + 7 | < 25 / 5
| x + 7 | < 5
| x | = x for x > 0
| x | = -x for x < 0
x + 7 < 5 and x + 7 > -5
x < 5 – 7 and x > -5 – 7
x < -2 and x > -12
We can conclude that the solutions of the given absolute value inequality are:
x < -2 and x > -12
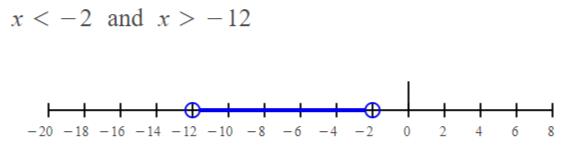
Question 73.
-2 | x + 1 | ≥ 18
Answer:
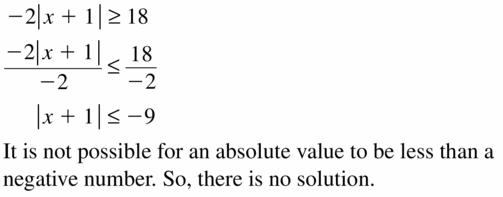
Lesson 3.7 Graphing Absolute Value Functions
Essential Question
How do the values of a, h, and k affect the graph of the absolute value function g(x) = a | x – h | + k? The parent absolute value function is f(x) = | x | Parent absolute value function
The graph of f is V-shaped.
Answer:
g (x) = a | x – h | + k
The parent function for the given absolute value function is:
f (x) = | x |
The graph of f is v-shaped
The given absolute value function has the constants a, x, h, and k
“x – h” represents the translation of the x-axis where h is the translation value
Example:
x – h =x – 3
Where,
x is the original function and h is the translation factor of x
“k” represents the y-intercept of the given absolute value function
The value of k affects the graph of the given absolute value function to translate on the y-axis up and down or shrink and stretch
EXPLORATION 1
Identifying Graphs of Absolute Value Functions
Work with a partner. Match each absolute value function with its graph. Then use a graphing calculator to verify your answers.
a. g(x) = | x – 2 |
b. g(x) = | x – 2 | + 2
c. g(x) = | x + 2 | + 2
d. g(x) = – | x + 2 | + 2
e. g(x) = 2 | x – 2 |
f. g(x) = – | x + 2 | + 2
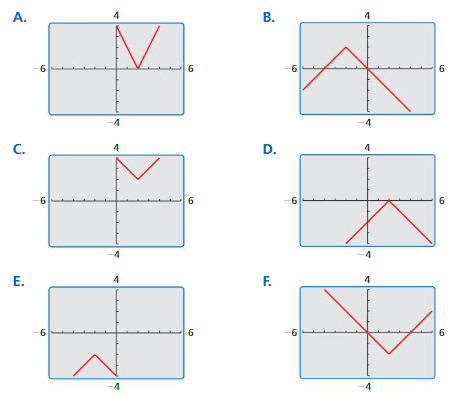
Answer:
a. g(x) = | x – 2 |
g (x) = x – 2 or g (x) = – (x – 2)
g (x) = x – 2 or g (x) = 2 – x
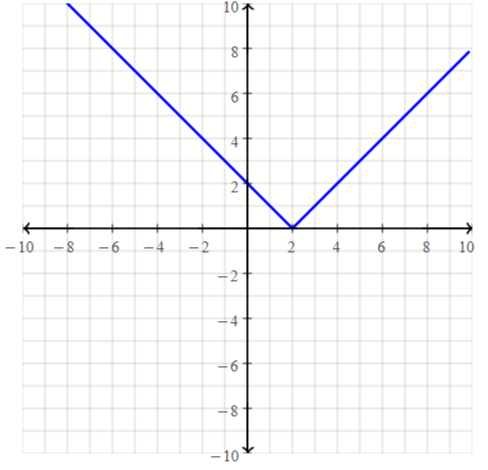
We can conclude that graph F) matches the given absolute value function
b. g(x) = | x – 2 | + 2
g (x) = x – 2 + 2 or g (x) = – (x – 2) + 2
g (x) = x or g (x) = 2 – x + 2
g (x) = x or g (x) = 4 – x
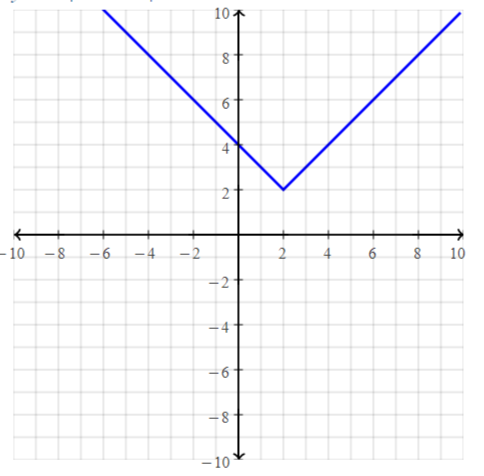
We can conclude that graph C) matches the given absolute value function
c. g(x) = | x + 2 | + 2
g (x) = x + 2 + 2 or g (x) = – (x + 2 ) + 2
g (x) = x + 4 or g (x) = -x – 2 + 2
g (x) = x + 4 or g (x) = -x
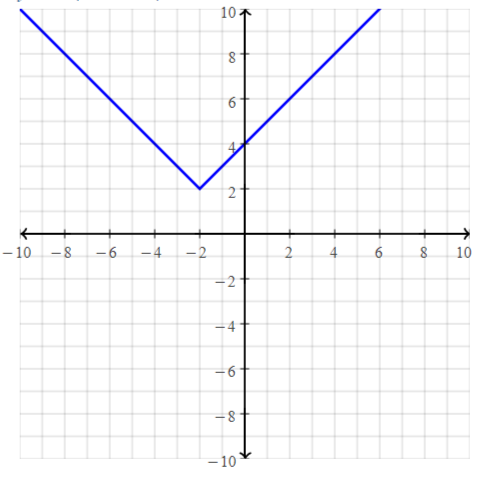
We can conclude that graph C) matches the given absolute value function
d. g(x) = – | x + 2 | + 2
g (x) = – (x + 2 ) + 2 or g (x) = – [- (x + 2 ) ] + 2
g (x) = -x – 2 + 2 or g (x) = x + 2 + 2
g (x) = x or g (x) =x + 4
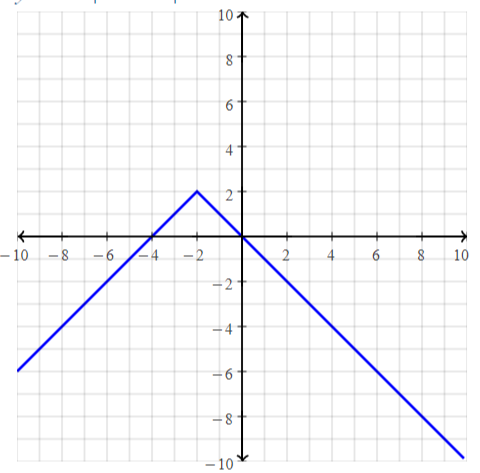
We can conclude that graph B) matches the given absolute value function
e. g(x) = 2 | x – 2 |
g (x) = 2 (x – 2) or g (x) = 2 ( – (x – 2) )
g (x) = 2x – 4 or g (x) = 2 (-x + 2 )
g (x)= 2x – 4 or g (x) = -2x + 4
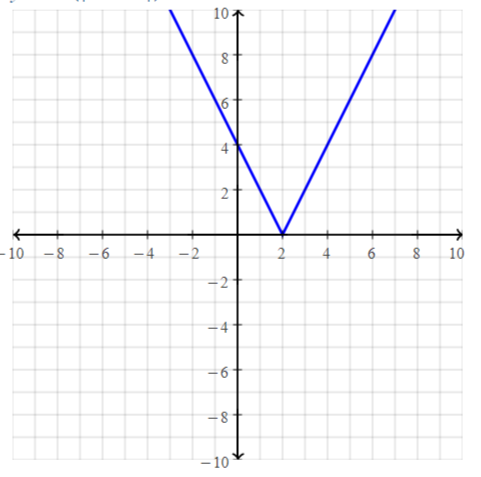
We can conclude that graph A) matches the given absolute value function
f. g(x) = – | x + 2 | + 2
g (x) = – (x + 2) + 2 or g (x) = – [- (x – 2} ] + 7
g (x) = x + 4 or g (x) = 2 – x + 7
g (x) = x + 4 or g (x) = -x + 9
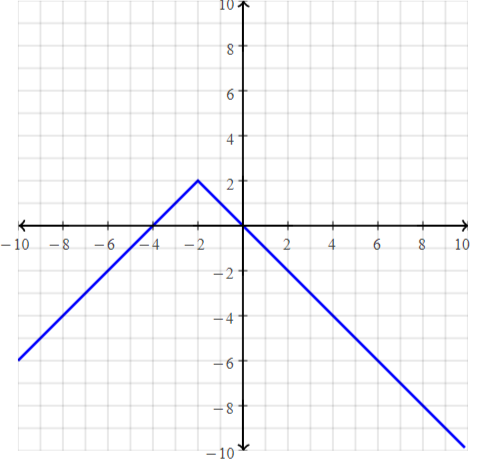
We can conclude that graph E) matches the given absolute value function
Communicate Your Answer
Question 2.
How do the values of a, h, and k affect the graph of the absolute value function g(x) = a | x – h | + k?
Answer:
g (x) = a | x – h | + k
From the above absolute value function,
a, h and k are constants
Now,
“a” represents the constant to multiply g (x)
“h” represents the translation factor on the x-axis
“k” represents the y-intercept of the given function
The value of “h” and “k” affect the graph in such a way that the graph can move anywhere in the graph
Question 3.
Write the equation of the absolute value function whose graph is shown. Use a graphing calculator to verify your equation.
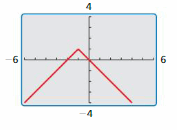
Answer:
We can observe that the plot is in a downward direction i.e., the absolute value function is negative and the plot passes through 2 in the x-axis
The absolute value function representing the given graph is f (x) = -| x + 1 | + 2
3.7 Lesson
Monitoring Progress
Graph the function. Compare the graph to the graph of f(x) = | x |. Describe the domain and range.
Question 1.
h(x) = | x | – 1
Answer:
f (x) = | x |
h (x) = | x | – 1
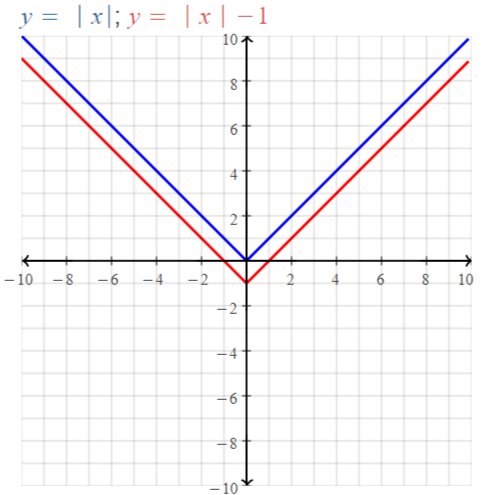
h (x) is translated vertically away from f (x) on the y-axis by 1 unit
The domain of the given functions are -10 ≤ x ≤ 10
The range of the given functions are -1 ≤ y ≤ 10
Question 2.
n(x) = | x + 4 |
Answer:
f (x) = | x |
h (x) = | x + 4 |
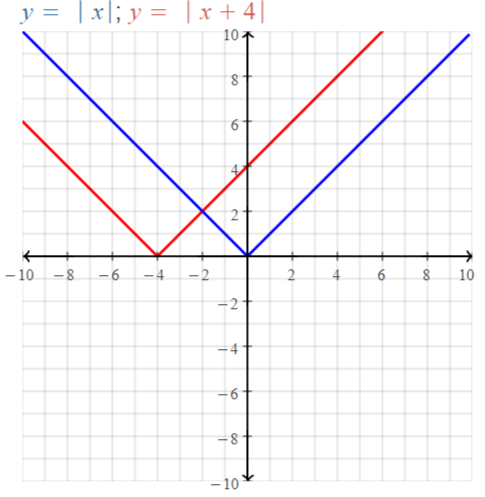
h (x) is translated from f (x) 4 units away on the x-axis
The domain of f (x) is -10 ≤ x ≤ 10
The domain of h (x) is -10 ≤ x ≤6
The range of f (x) is 0 ≤ y ≤ 10
The range of h (x) is 0 ≤y ≤ 6
Graph the function. Compare the graph to the graph of f(x) = | x |. Describe the domain and range.
Question 3.
t(x) = -3| x |
Answer:
f (x) = | x |
t (x) = -3 | x |
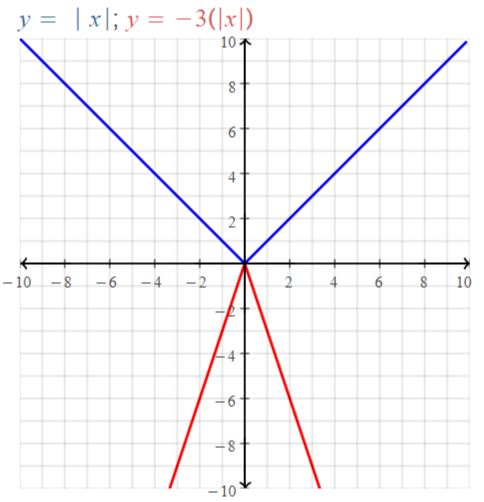
t (x) is shrunk by 3units and rotated by 90° on the y-axis
The domain of f (x) is -10 ≤ x ≤ 10
The domain of t (x) is -3 ≤x ≤ 3
The range of f (x) is 0 ≤ y ≤ 10
The range of t (x) is -10 ≤ y ≤ 0
Question 4.
v(x) = \(\frac{1}{4}\)| x |
Answer:
f (x) = | x |
v (x) = \(\frac{1}{4}\)| | x |
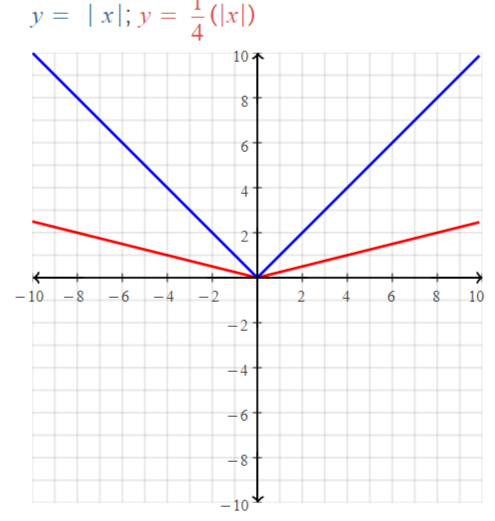
t (x) translates \(\frac{1}{4}\)| units of f (x) on the y-axis
The domain of the given functions are -10 ≤ x ≤ 10
The range of f (x) is 0 ≤ y ≤ 10
The range of t (x) is 0 ≤ y ≤ 2.5
Question 5.
Graph f(x) = | x – 1 | and g(x) = | \(\frac{1}{2}\)x – 1 |.
Compare the graph of g to the graph of f.
Answer:
f (x) = | x – 1 |
g (x) = | \(\frac{1}{2}\)x – 1 |
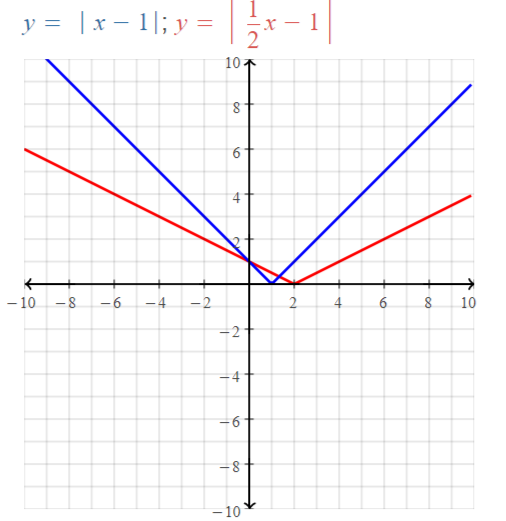
g (x) translates 1 unit away from f (x) on the x-axis
The domain of f (x) is -8 ≤ x ≤ 10
The domain of g (x) is -10 ≤ x ≤ 10
The range of f (x) is 0 ≤ y ≤ 10
The range of g (x) is 0 ≤ y ≤ 6
Question 6.
Graph f(x) = | x + 2 | + 2 and g(x) = | -4x + 2 | + 2.
Compare the graph of g to the graph of f.
Answer:
f (x) = | x + 2 | + 2
g (x) = | -4x + 2 | + 2
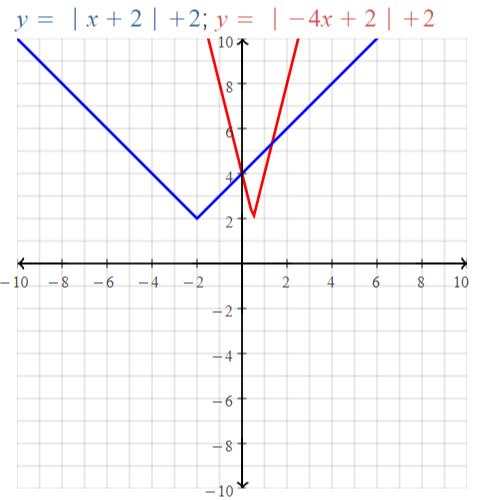
g (x) translates \(\frac{3}{2}\) units away from f (x) on the x-axis
The domain of f (x) is -10 ≤ x ≤ 6
The domain of g (x) is -1.5 ≤ x ≤ 2.5
The range of f (x) is 0 ≤ y ≤ 10
The range of g (x) is 2 ≤y ≤ 10
Question 7.
Let g(x) = | –\(\frac{1}{2}\)x + 2 | + 1.
(a) Describe the transformations from the graph of f(x) = | x | to the graph of g.
(b) Graph g.
Answer:
a. The given functions are:
f (x) = | x |
g (x) = | –\(\frac{1}{2}\)x + 2 | + 1
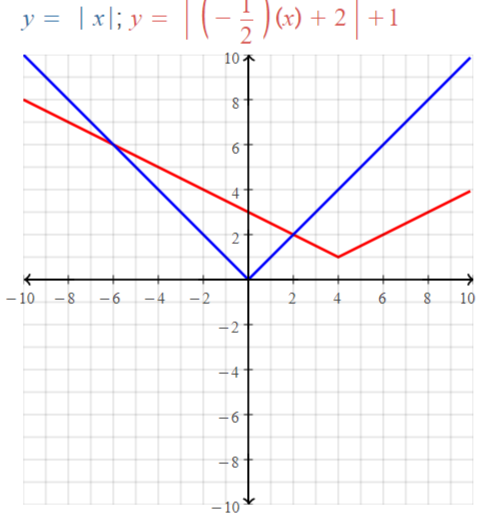
g (x) translates 4 units away from f (x) on the positive x-axis
g (x) translates 2 units away from f (x) on the negative x-axis
b. | –\(\frac{1}{2}\)x + 2 | + 1
g can be written as g (x)
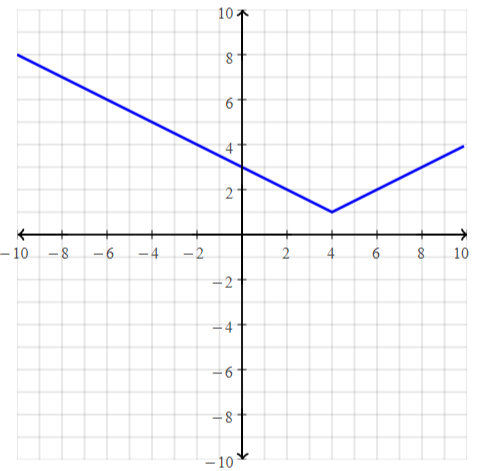
Graphing Absolute Value Functions 3.7 Exercises
Vocabulary and Core Concept Check
Question 1.
COMPLETE THE SENTENCE
The point (1, -4) is the _______ of the graph of f(x) = -3 | x – 1 | – 4.
Answer:
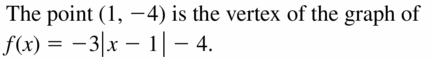
Question 2.
USING STRUCTURE
How do you know whether the graph of f(x) = a | x – h | + k is a vertical stretch or a vertical shrink of the graph of f(x) = | x | ?
Answer:
f (x) = a | x – h | + k
a is the vertical stretch or vertical shrink
h is the horizontal translation
k is the vertical shift
‘a’ will be the vertical stretch if the value of a is an integer
‘a’ will be the vertical shrink if the value of ‘a’ is a fraction
The given function is a vertical stretch
Question 3.
WRITING
Describe three different types of transformations of the graph of an absolute value function.
Answer:
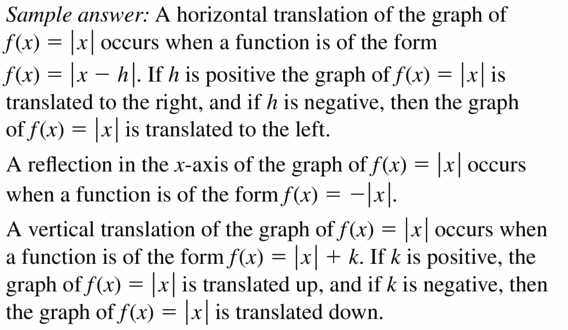
Question 4.
REASONING
The graph of which function has the same y-intercept as the graph of f(x) = | x – 2 | + 5? Explain.
![]()
Answer:
a. f (x) = | x – 2 | + 5
f (x) = x – 2 + 5 or f (x) = -(x – 2) + 5
f (x) = x + 3 or f (x) = -x + 2 + 5
f (x) = x + 3 or f (x) = -x + 7
b. g (x) = | 3x – 2 | + 5
g (x) = 3x – 2 + 5 or g (x) = – (3x – 2 ) + 5
g (x) = 3x + 3 or g (x) = -3x + 2 + 5
g (x) = 3x + 3 or g (x) = -3x + 7
c. h (x) = 3 | x – 2 | + 5
h (x) = 3 (x – 2) + 5 or h (x) = -3 (x – 2) + 5
h (x) = 3x – 6 + 5 or h (x) = -3x + 6 + 5
h (x) = 3x – 1 or h (x) = -3x + 11
Compare the solutions of the given absolute value functions with
f (x) = mx + c
Where,
m is the slope
c is the y-intercept
We can conclude that a) and b ) have the same y-intercepts
Monitoring Progress and Modeling with Mathematics
In Exercises 5–12, graph the function. Compare the graph to the graph of f(x) = | x |. Describe the domain and range.
Question 5.
d(x) = | x | – 4
Answer:
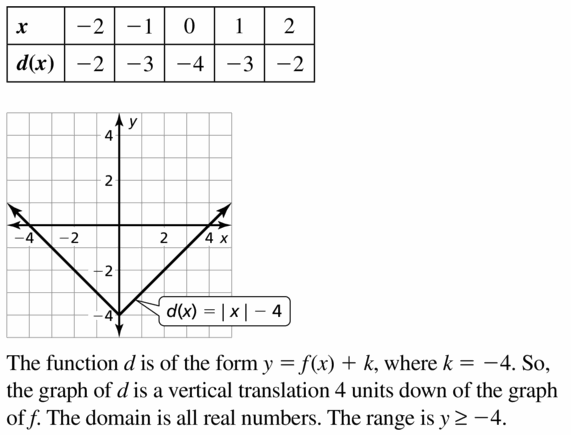
Question 6.
r(x) = | x | + 5
Answer:
f (x) = | x |
r (x) = | x | + 5
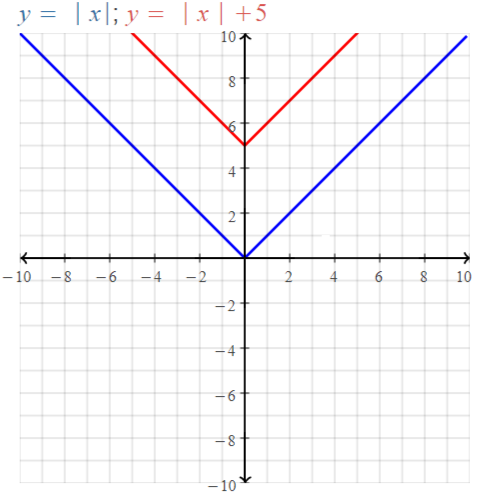
We can conclude that r (x) is 5 units away from f (x)
The domain of the given absolute value function is -5 ≤ x ≤ 5
The range of the given absolute value function is 5 ≤y ≤10
Question 7.
m(x) = | x + 1 |
Answer:
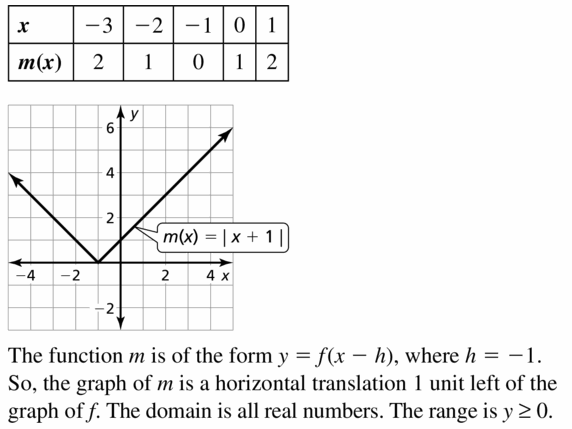
Question 8.
v(x) = | x – 3 |
Answer:
f (x) = | x |
v (x) = | x – 3 |
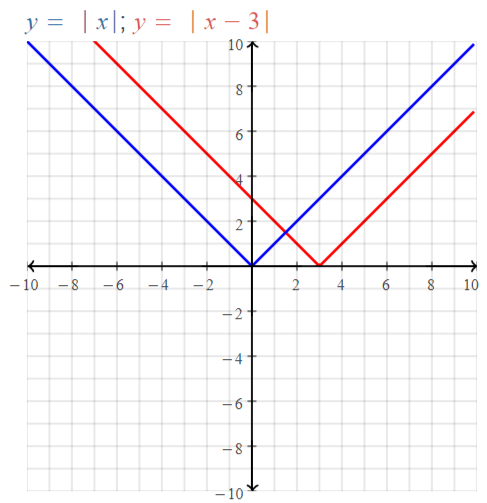
We can conclude that v (x) translates 3 units away from f (x)
The domain of the given absolute value function is -6 ≤ x ≤ 10
The range of the given absolute value function is 6 ≤ y ≤ 10
Question 9.
p(x) = \(\frac{1}{3}\) | x |
Answer:
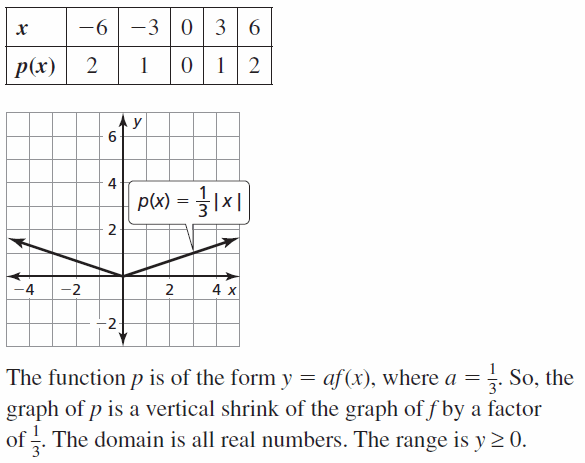
Question 10.
j(x) = 3 | x |
Answer:
f (x) = | x |
j (x) = 3 | x |
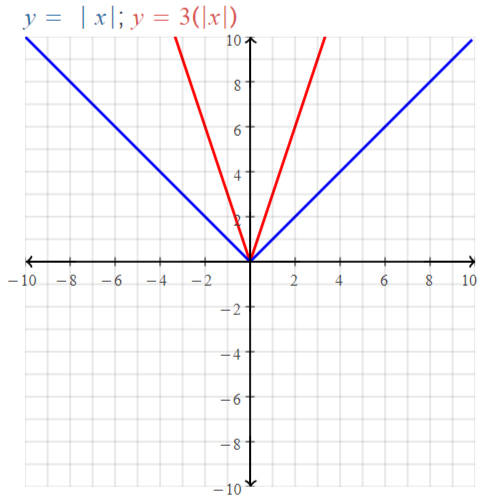
We can conclude that j (x) vertically stretches 3 units away from f (x)
The domain of the given absolute value function is -3.5 ≤ x ≤ 3.5
The range of the given absolute value function is 0 ≤ y ≤ 10
Question 11.
a(x) = -5 | x |
Answer:
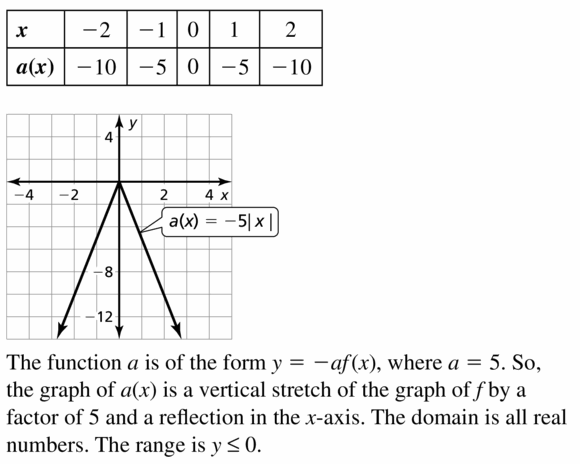
Question 12.
q(x) = – \(\frac{3}{2}\) | x |
Answer:
f (x) = | x |
q (x) = –\(\frac{3}{2}\) | x |
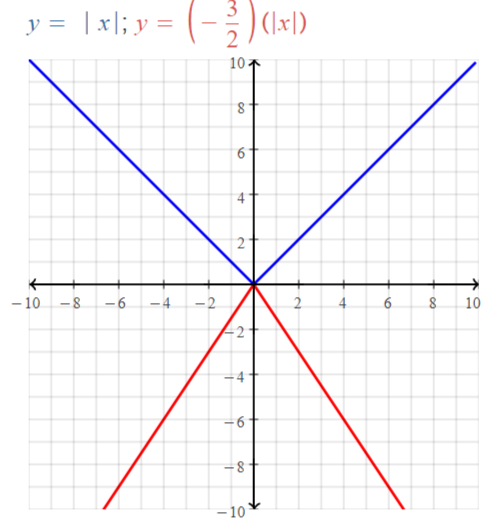
We can conclude that q (x) shrinks by \(\frac{3}{2}\) units from f (x)
The domain of the given absolute value function is -6.5 ≤ x ≤ 6.5
The range of the given absolute value function is -10 ≤ y ≤ 0
In Exercises 13–16, graph the function. Compare the graph to the graph of f(x) = | x − 6 |.
Question 13.
h(x) = | x – 6 | + 2
Answer:
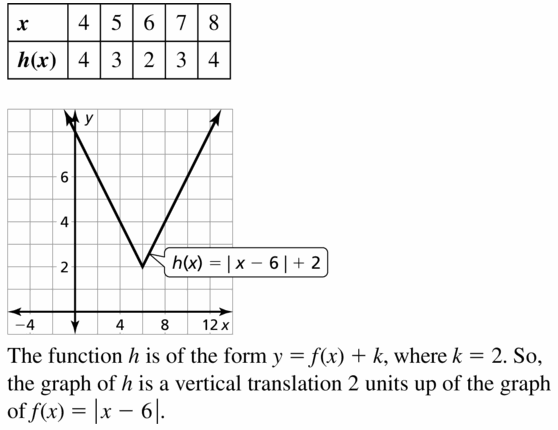
Question 14.
n(x) = \(\frac{1}{2}\) | x – 6 |
Answer:
f (x) = | x – 6 |
n (x) = \(\frac{1}{2}\) | x – 6 |
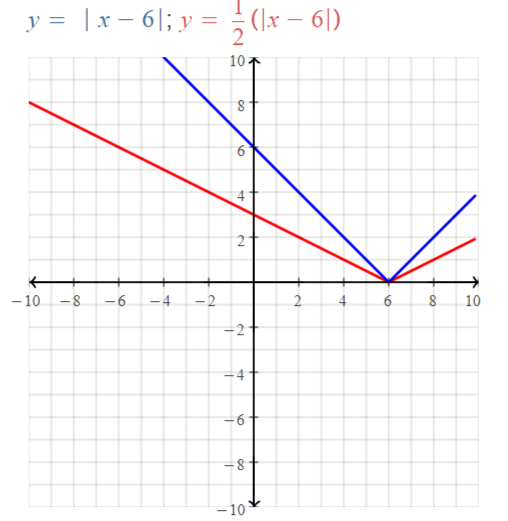
We can conclude that n (x) vertically stretches \(\frac{1}{2}\) units of f (x)
Question 15.
k(x) = -3 | x – 6 |
Answer:
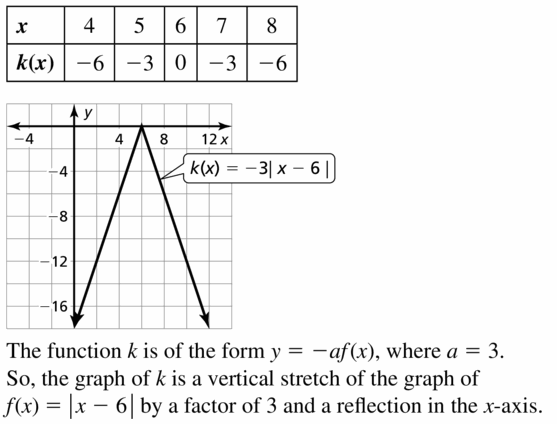
Question 16.
g(x) = | x – 1 |
Answer:
f (x) = | x – 6 |
g (x) = | x – 1 |
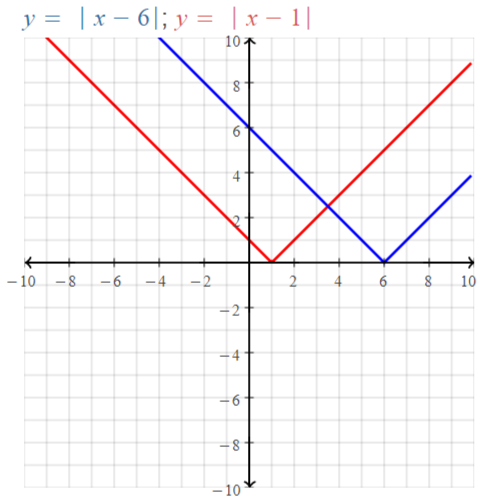
We can conclude that g (x) translates 4 units away from f (x) on the positive x-axis
In Exercises 17 and 18, graph the function. Compare the graph to the graph of f(x) = | x + 3 | − 2.
Question 17.
y(x) = | x + 4 | – 2
Answer:
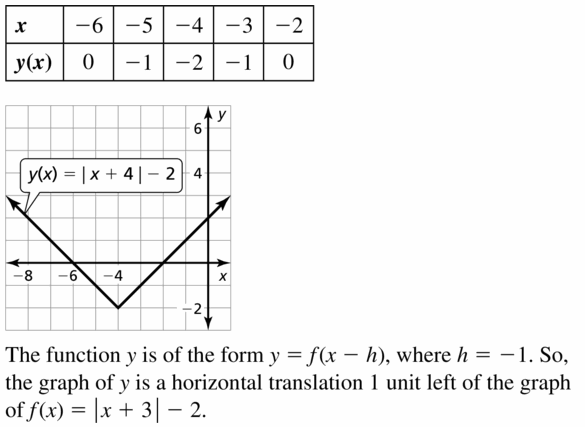
Question 18.
b(x) = | x + 3 | + 3
Answer:
f (x) = | x + 3 | – 2
b (x) = | x + 3 | + 3
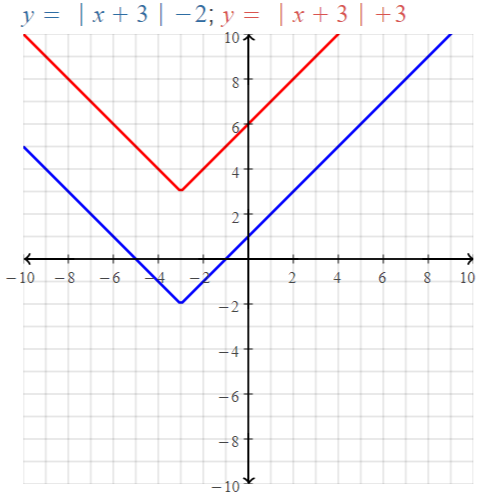
We can conclude that f (x) and b (x) are parallel lines since the slopes are constant and there are different values of the y-intercepts
In Exercises 19–22, compare the graphs. Find the value of h, k, or a.
Question 19.
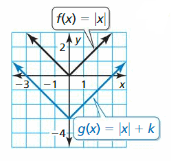
Answer:
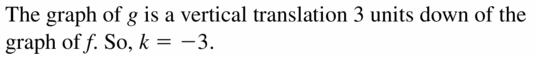
Question 20.
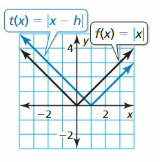
Answer:
f (x) = | x |
t (x) = | x – h |
Where,
h is the horizontal translation
We can observe that the translation occurs at (1, 0) of f (x)
The value of ‘h’ is: 1
Question 21.
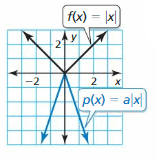
Answer:
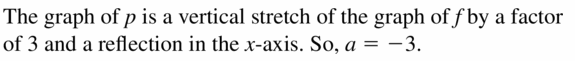
Question 22.
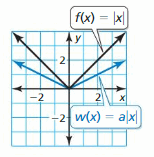
Answer:
f (x) = | x |
w (x) = a | x |
Where,
‘a’ is the vertical stretch
From the graph,
We can observe that the vertical stretch occurs at (0, 2)
The value of a is 2
In Exercises 23–26, write an equation that represents the given transformation(s) of the graph of g(x) = | x |.
Question 23.
vertical translation 7 units down
Answer:
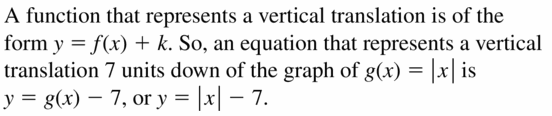
Question 24.
horizontal translation 10 units left
Answer:
Horizontal translation 10 units left
Let the absolute value function be y = | x |
The given statement in the absolute value function form is
y = | x | + 10
Question 25.
vertical shrink by a factor of \(\frac{1}{4}\)
Answer:
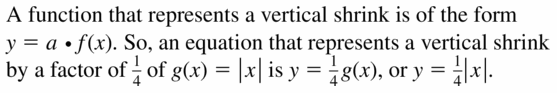
Question 26.
vertical stretch by a factor of 3 and a reflection in the x-axis
Answer:
Vertical stretch by a factor of 3 and a reflection in the x-axis
The representation of the vertical stretch ‘a’ of the function is
y = a.f (x)
The representation of the reflection of the function is
y= f (-x)
y = x
Vertical stretch:
y = 3x
Reflection:
y = -3x
In Exercises 27–32, graph and compare the two functions.
Question 27.
f(x) = | x – 4 |; g(x) = | 3x – 4 |
Answer:
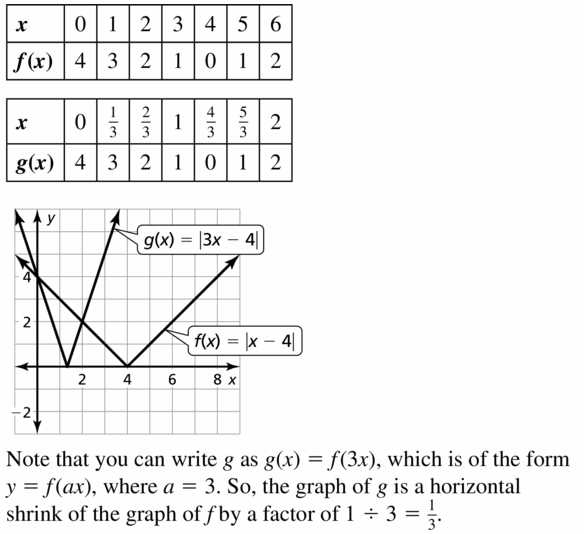
Question 28.
h(x) = | x + 5 |; t(x) = | 2x + 5 |
Answer:
h (x) = | x + 5 |
t (x) = | 2x + 5 |
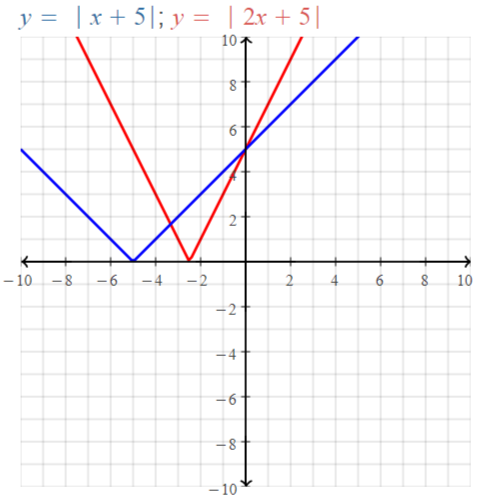
We can conclude that t (x) translates 6 units away from h (x) in the negative y-axis
Question 29.
p(x) = | x + 1 | – 2; q(x) = | \(\frac{1}{4}\)x + 1 | – 2
Answer:
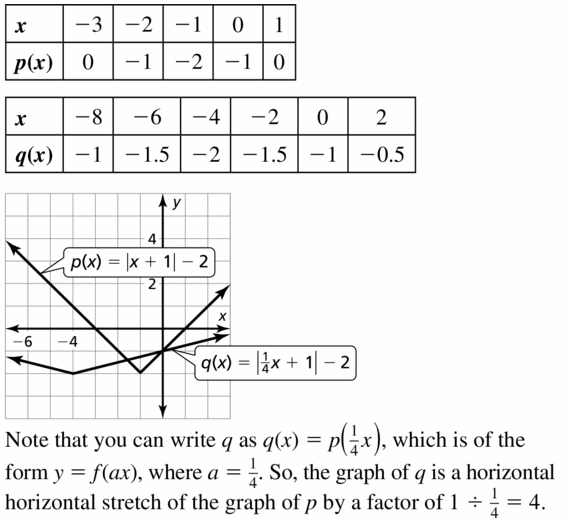
Question 30.
w(x) = | x – 3 | + 4; y(x) = | 5x – 3 | + 4
Answer:
w (x) = | x – 3 | + 4
y (x) = | 5x – 3 | + 4
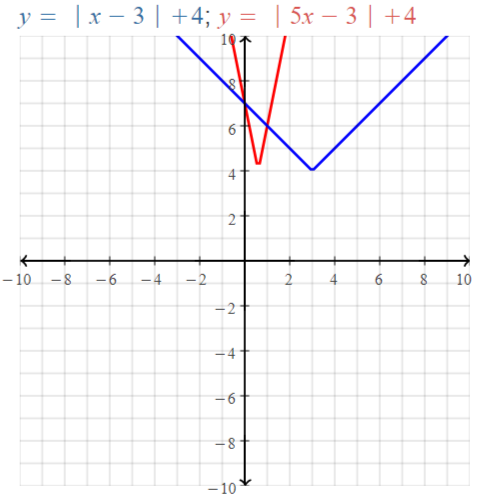
We can conclude that w (x) is 7 units away from y (x) in the positive y-axis
Question 31.
a(x) = | x + 2 | + 3; b(x) = | -4x + 2 | + 3
Answer:
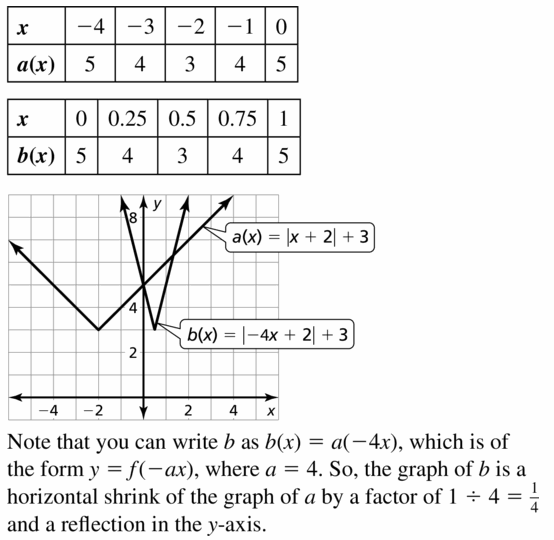
Question 32.
u(x) = | x – 1 | + 2; v(x) = | –\(\frac{1}{2}\)x – 1 | + 2
Answer:
u (x) = | x – 1 | + 2
v (x) = | –\(\frac{1}{2}\)x – 1 | + 2
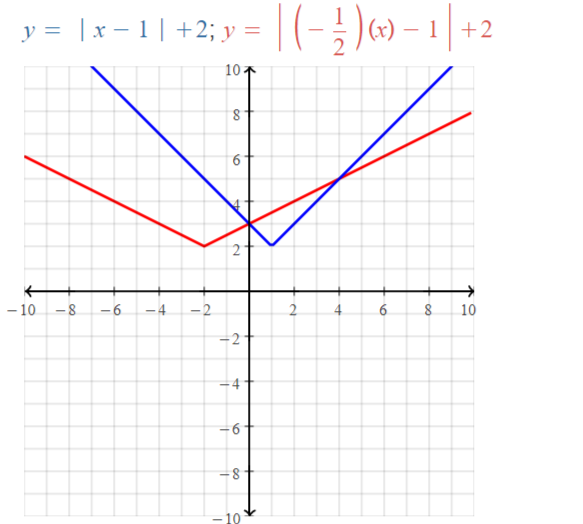
We can conclude that u (x) is 1 unit away from v (x) in the positive y-axis
In Exercises 33–40, describe the transformations from the graph of f(x) = | x | to the graph of the given function. Then graph the given function.
Question 33.
r(x) = | x + 2 | – 6
Answer:
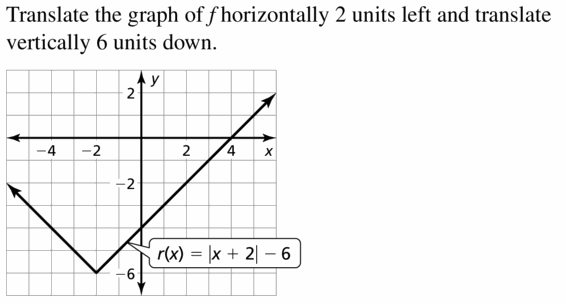
Question 34.
c(x) = | x + 4 | + 4
Answer:
c (x) = | x + 4 | + 4
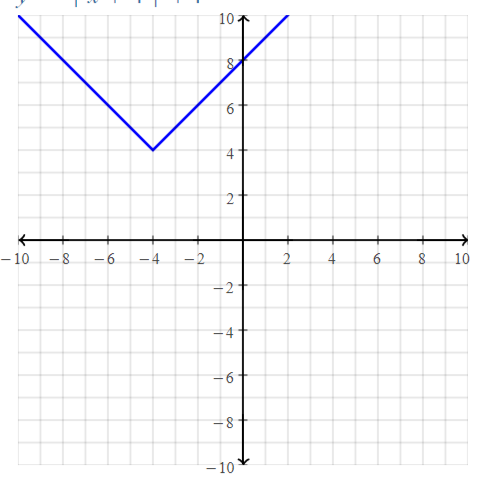
We can conclude that c (x) translates 4 units away in the positive x-axis and 4 units vertically in the y-axis
Question 35.
d(x) = – | x – 3 | + 5
Answer:
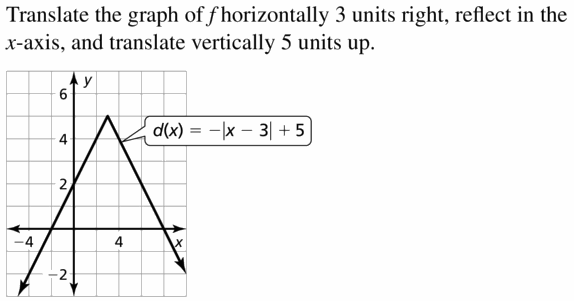
Question 36.
v(x) = -3| x + 1 | + 4
Answer:
v (x) = -3 | x + 1 | + 4
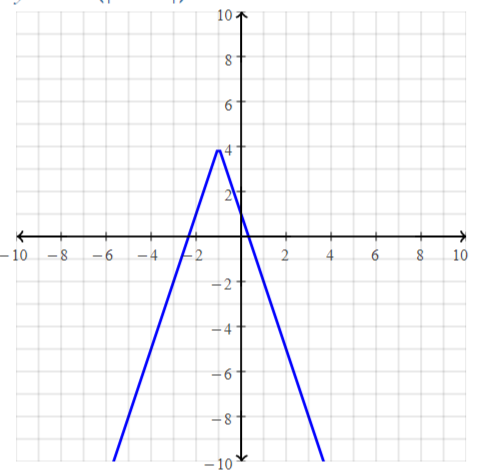
We can conclude that v (x) translates 4 units vertically above and 2 units to the right side of the positive x-axis
Question 37.
m(x) = \(\frac{1}{2}\) | x + 4 | – 1
Answer:
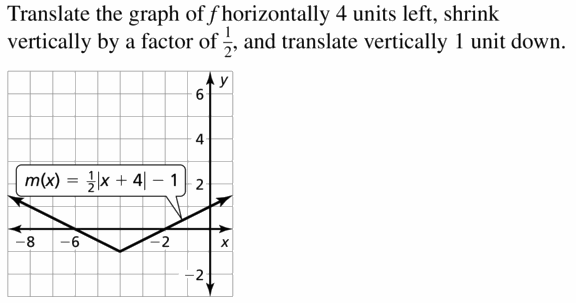
Question 38.
s(x) = | 2x – 2 | – 3
Answer:
s (x) = | 2x – 2 | – 3
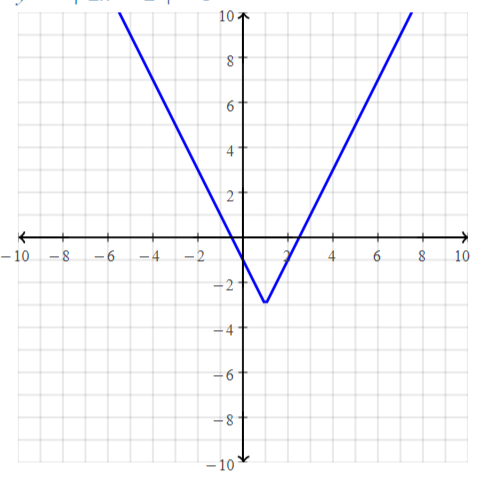
We can conclude that s (x) translates 4 units away to the right side of the positive x-axis
Question 39.
j(x) = | -x + 1 | – 5
Answer:
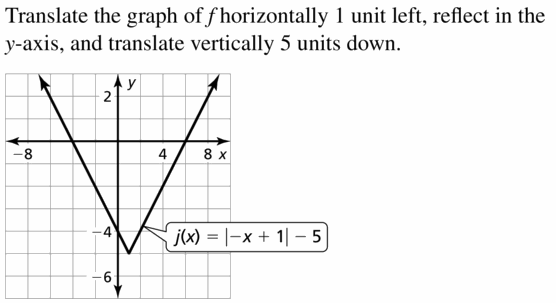
Question 40.
n(x) = | –\(\frac{1}{3}\)x + 1 | + 2
Answer:
n (x) = | –\(\frac{1}{3}\)x + 1 | + 2
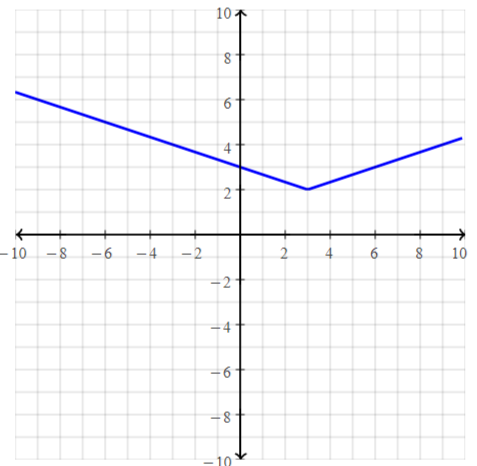
We can conclude that n (x) translates 4 units away from the origin
Question 41.
MODELING WITH MATHEMATICS
The number of pairs of shoes sold s (in thousands) increases and then decreases as described by the function s(t) = -2 | t – 15 | + 50, where t is the time (in weeks).

a. Graph the function.
b. What is the greatest number of pairs of shoes sold in 1 week?
Answer:
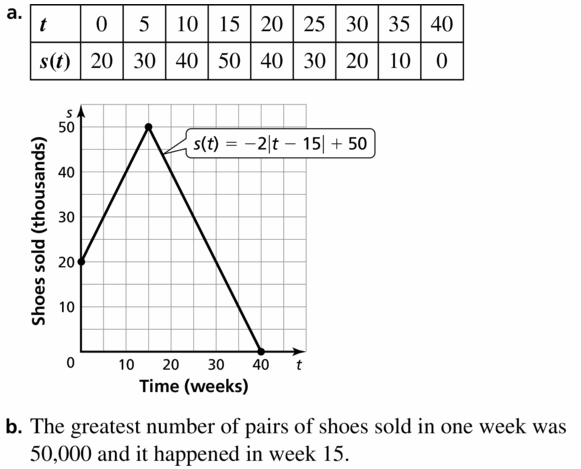
Question 42.
MODELING WITH MATHEMATICS
On the pool table shown, you bank the five ball off the side represented by the x-axis. The path of the ball is described by the function p(x) = \(\frac{4}{3}\) | x – \(\frac{5}{4}\) |.
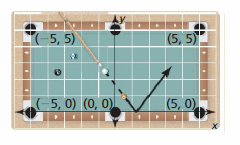
a. At what point does the five-ball bank off the side?
Answer:
On the pool table shown, you bank the five ball off the side represented by the x-axis. The path of the ball is described by the function
p(x) = \(\frac{4}{3}\) | x – \(\frac{5}{4}\) |
To find the point where the five-ball bank off the side, draw the plot of the given absolute value function
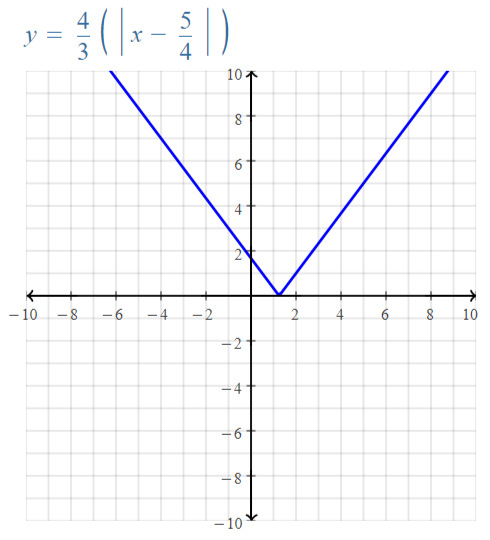
The point where the five-ball offside is (1, 0)
b. Do you make the shot? Explain your reasoning.
Answer:
The point is accurately going through the hole i.e., at (5, 5)
We can conclude that you make the shot
Question 43.
USING TRANSFORMATIONS
The points A (-\(\frac{1}{2}\), 3) , B(1, 0), and C(-4, -2) lie on the graph of the absolute value function f. Find the coordinates of the points corresponding to A, B, and C on the graph of each function.
a. g(x) = f(x) – 5
b. h(x) = f(x – 3)
c. j(x) = -f(x)
d. k(x) = 4f(x)
Answer:
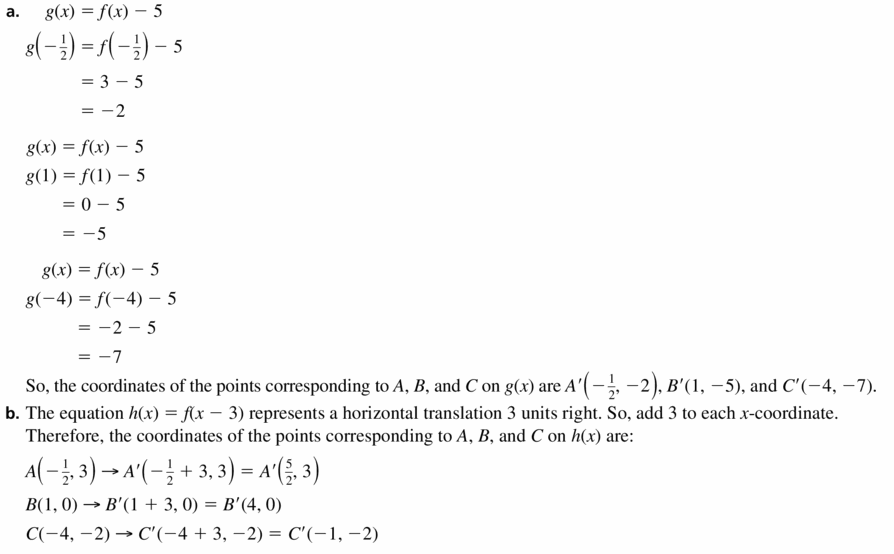
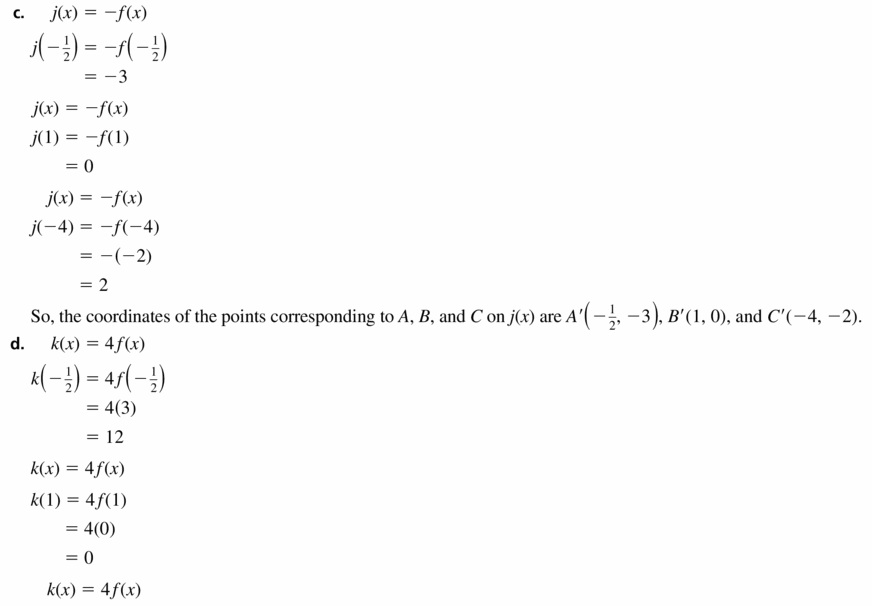
Question 44.
USING STRUCTURE
Explain how the graph of each function compares to the graph of y = | x | for positive and negative values of k, h, and a.
a.y = | x | + k
b. y = | x – h |
c. y = a| x |
d. y = | ax |
Answer:
a. y = | x | + k
The given absolute value function translates from the parent function k units away in the positive y-axis vertically
b. y = | x – h |
The given absolute value function translates from the parent function h units away in the positive x-axis horizontally
c. y = a| x |
The given absolute value function reflects from the parent function ‘a’ units away
d. y = | ax |
The given absolute value function dilates from the parent function with the value of ‘a’ units
ERROR ANALYSIS
In Exercises 45 and 46, describe and correct the error in graphing the function.
Question 45.
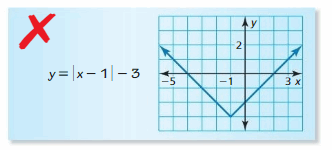
Answer:
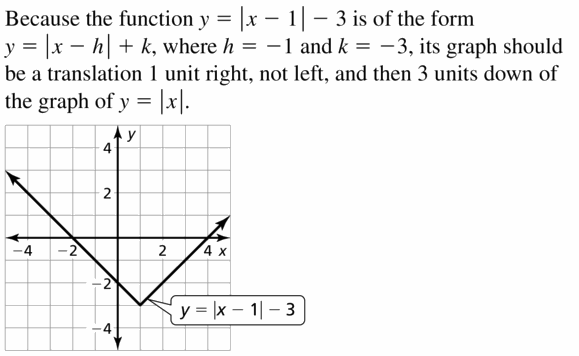
Question 46.
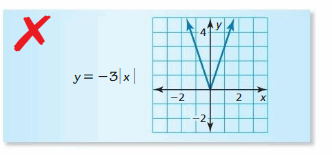
Answer:
y = -3 | x|
| x | = x for x > 0
| x | = -x for x < 0
y = -3 (x) or y = -3 (-x)
y = -3x or y = 3x
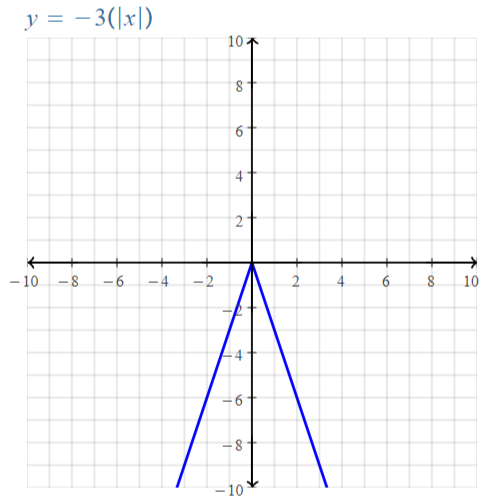
We can conclude that the given absolute value function in the downward direction
MATHEMATICAL CONNECTIONS
In Exercises 47 and 48, write an absolute value function whose graph forms a square with the given graph.
Question 47.
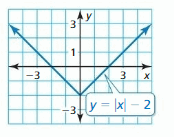
Answer:
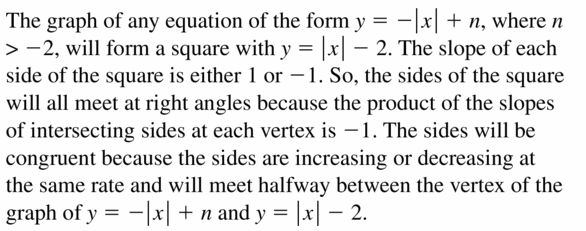
Question 48.
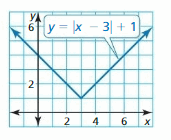
Answer:
y = | x – 3 | + 1
We can say that the x-axis translates 3 units away in the positive x-axis and the y-axis is a vertical stretch with the value of k as 1
Question 49.
WRITING
Compare the graphs of p(x) = | x – 6 | and q(x) = | x | – 6.
Answer:
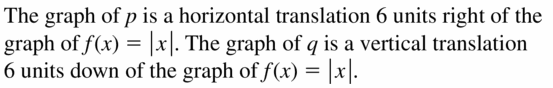
Question 50.
HOW DO YOU SEE IT? The object of a computer game is to break bricks by deflecting a ball toward them using a paddle. The graph shows the current path of the ball and the location of the last brick.
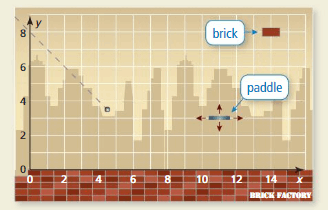
a. You can move the paddle up, down, left, and right. At what coordinates should you place the paddle to break the last brick? Assume the ball deflects at a right angle.
Answer:
The coordinates that are at a right angle to break the brick using a paddle is
(3, 8) and (14, 8)
b. You move the paddle to the coordinates in part (a), and the ball is deflected. How can you write an absolute value function that describes the path of the ball?
Answer:
The coordinates that are used to break the brick using a paddle is
(3, 8) and (14, 8)
The parent function will always be:
f (x) = | x |
From part (a),
The y-axis is constant and the x-axis is translating 3 units away and 14 units away
The value of the absolute value function with the translation of x-value and y-value as k-value
f (x) = | x – h | + k
The absolute value function that describes the path of the ball is
f (x) = | x – 3 | + 8
f (x) = | x – 14 | + 8
In Exercises 51–54, graph the function. Then rewrite the absolute value function as two linear functions, one that has the domain x < 0 and one that has the domain x ≥ 0.
Question 51.
y = | x |
Answer:
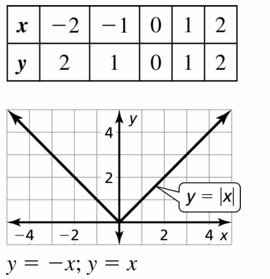
Question 52.
y = | x | – 3
Answer:
| x | = x for x > 0
| x | = -x for x < 0
y = x – 3 or y = -x – 3
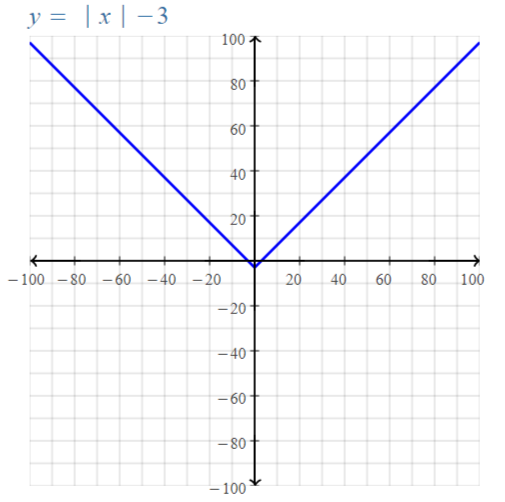
Question 53.
y = – | x | + 9
Answer:
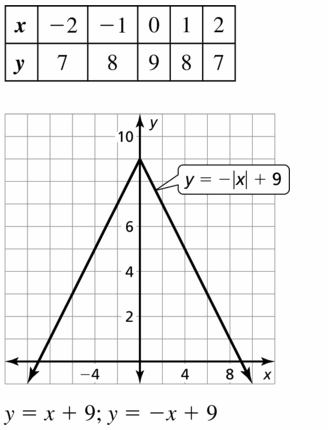
Question 54.
y = – 4 | x |
Answer:
y = -4 | x |
| x | = x for x > 0
| x | = -x for x < 0
y = -4 (x) or y = -4 (-x)
y = -4x or y = 4x
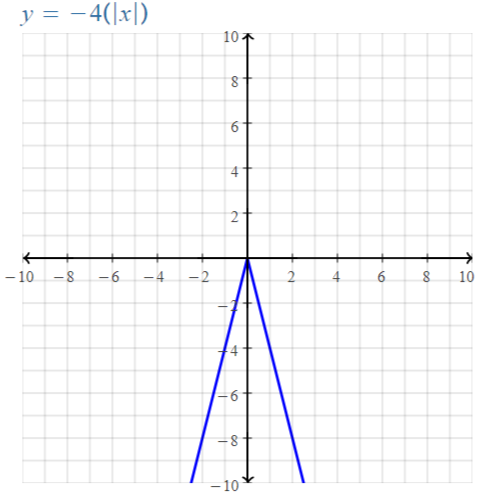
In Exercises 55–58, graph and compare the two functions.
Question 55.
f(x) = | x – 1 | + 2; g(x) = 4 | x – 1 | + 8
Answer:
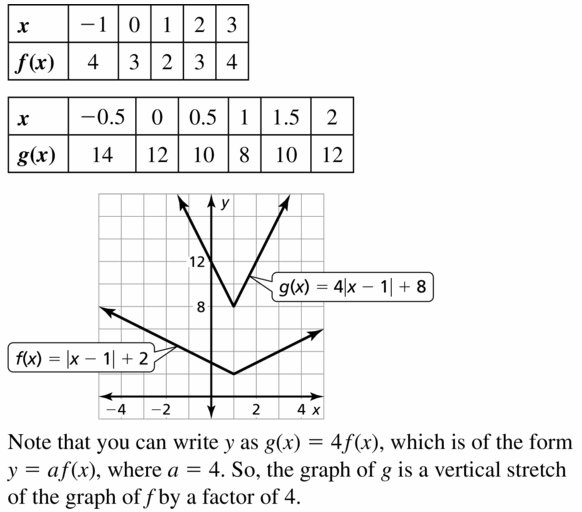
Question 56.
s(x) = | 2x – 5 | – 6; t(x) = \(\frac{1}{2}\) | 2x – 5 | – 3
Answer:
s (x) = | 2x – 5 | – 6
t (x) = \(\frac{1}{2}\) | 2x – 5 | – 3
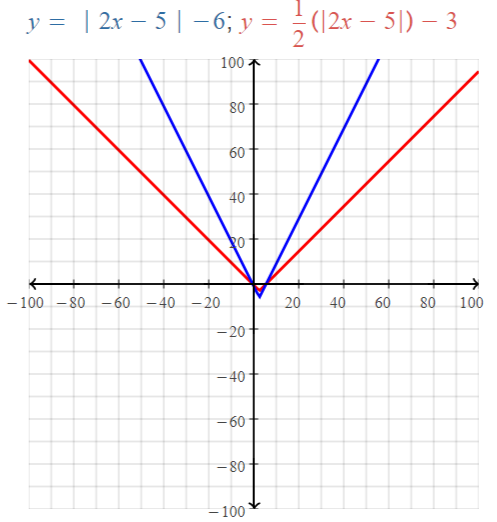
We can conclude that s (x) translates 60 units away from t (x)
Question 57.
v(x) = -2 | 3x + 1 | + 4; w(x) = 3 | 3x + 1 | – 6
Answer:
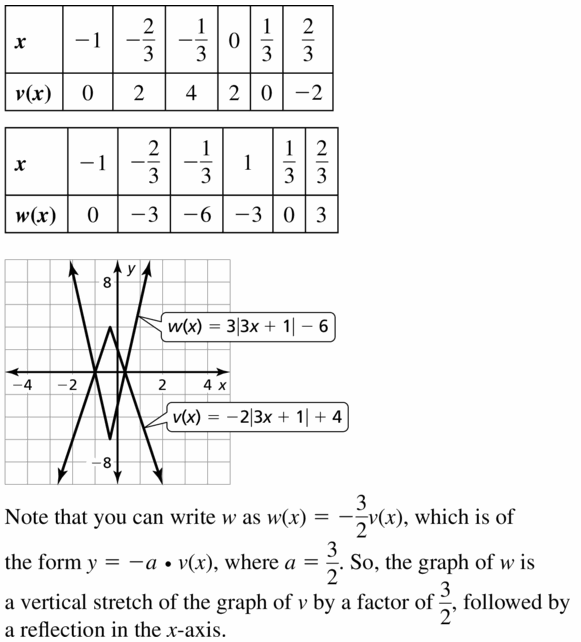
Question 58.
c(x) = 4 | x + 3 | – 1; d(x) = –\(\frac{4}{3}\) | x + 3 | + \(\frac{1}{3}\)
Answer:
c (x) = 4 | x + 3 | – 1
d (x) =-\(\frac{4}{3}\) | x + 3 | + \(\frac{1}{3}\)
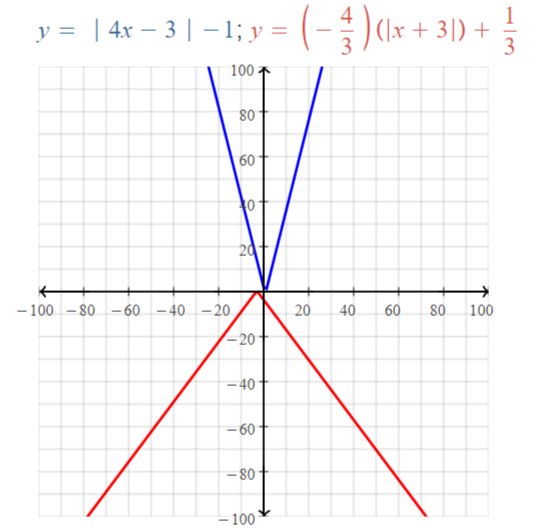
We can conclude that d(x) and c (x) are opposite to each other
Question 59.
REASONING
Describe the transformations from the graph of g(x) = -2 | x + 1 | + 4 to the graph of h(x) =| x |. Explain your reasoning.
Answer:
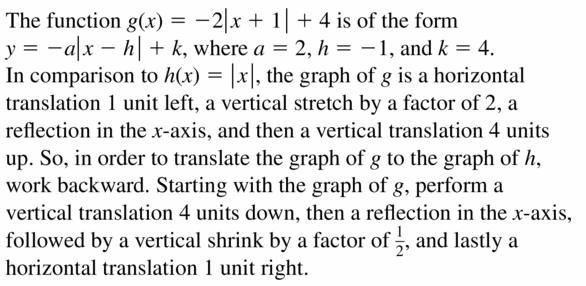
Question 60.
THOUGHT-PROVOKING
Graph an absolute value function f that represents the route a wide receiver runs in a football game. Let the x-axis represent the distance (in yards) across the field horizontally. Let the y-axis represent the distance (in yards) down the field. Be sure to limit the domain so the route is realistic.
Answer:
Let the x-axis represent the distance (in yards) across the field horizontally
Let the y-axis represent the distance (in yards) down the field.
The distance across the field horizontally is 50 yards
The distance down the field is 25 yards
(x, y) = (50, 25)
f (x) = | x – 50 | + 25
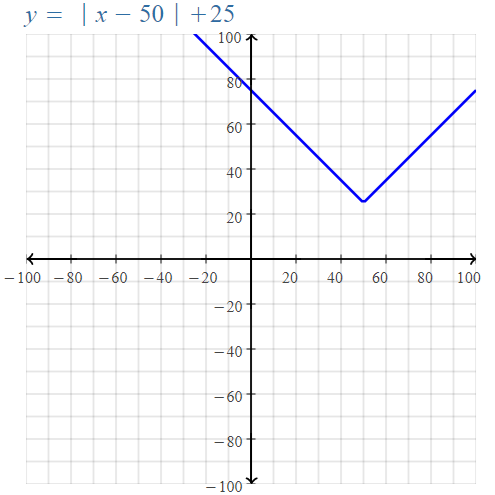
The domain of the given absolute value function is x ≥ 0
The range of the given absolute value function is y > 0
Question 61.
SOLVING BY GRAPHING
Graph y = 2 | x + 2 | – 6 and y = -2 in the same coordinate plane. Use the graph to solve the equation 2 | x + 2 | – 6 = -2. Check your solutions.
Answer:
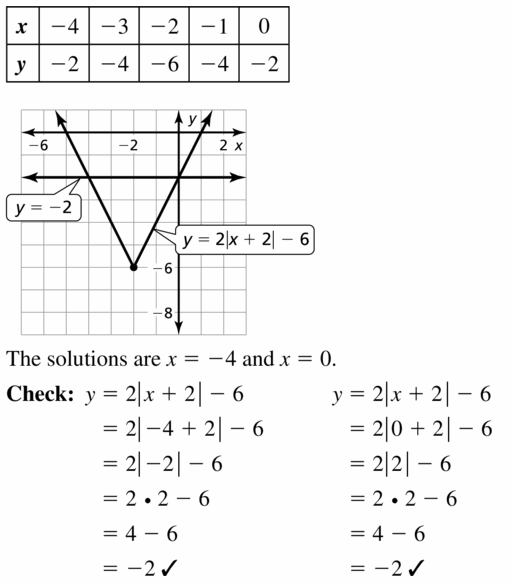
Question 62.
MAKING AN ARGUMENT
Let p be a positive constant. Your friend says that because the graph of y =| x | + p is a positive vertical translation of the graph of y = | x |, the graph of y = | x + p | is a positive horizontal translation of the graph of y = | x |. Is your friend correct? Explain.
Answer:
y = | x | + p is a positive vertical translation because the y-intercept in the given equation is positive
y = | x + p | will be a horizontal translation with a negative translation value
But, according to your friend,
y = | x + p | is a positive horizontal translation
Your friend is not correct
Question 63.
ABSTRACT REASONING
Write the vertex of the absolute value function f(x) = | ax – h | + k in terms of a, h, and k.
Answer:
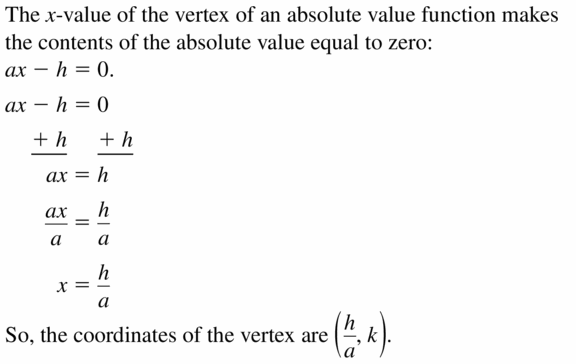
Maintaining Mathematical Proficiency
Solve the inequality. (Section 2.4)
Question 64.
8a – 7 ≤ 2(3a – 1)
Answer:
8a – 7 ≤ 2 (3a – 1)
8a – 7 ≤ 2 (3a) – 2 (1)
8a – 7 ≤ 6a – 2
8a – 6a ≤ -2 + 7
2a ≤ 5
a ≤ \(\frac{5}{2}\)
Question 65.
-3(2p + 4) > -6p – 5
Answer:
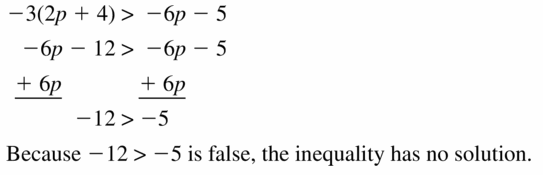
Question 66.
4(3h + 1.5) ≥ 6(2h – 2)
Answer:
4 (3h + 1.5) ≥ 6 (2h – 2)
4 (3h) + 4 (1.5) ≥ 6 (2h) – 6 (2)
12h + 6 ≥ 12h – 12
12h – 12h + 6 ≥ -12
6 ≥ -12
Question 67.
-4(x + 6) < 2(2x – 9)
Answer:
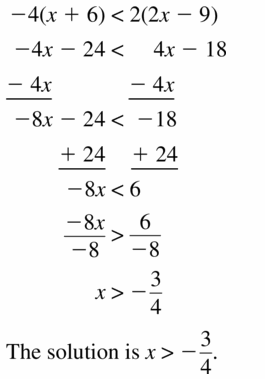
Find the slope of the line. (Section 3.5)
Question 68.
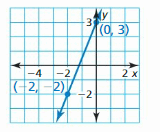
Answer:
The points are (0, 3), (-2, -2)
m= \(\frac{y2 – y1}{x2 – x1}\)
(x1, y1) = (0, 3) and (x2, y2) = (-2, -2)
m = \(\frac{-2 – 3}{-2 – 0}\)
m = \(\frac{-5}{-2}\)
m = \(\frac{5}{2}\)
Question 69
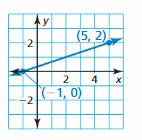
Answer:
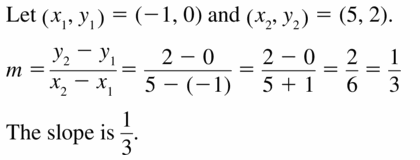
Question 70.
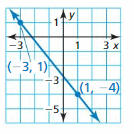
Answer:
The given points are (-3, 1), (1, -4)
m= \(\frac{y2 – y1}{x2 – x1}\)
(x1, y1) = (-3, 1) and (x2, y2) = (1, -4)
m = \(\frac{-4 – 1}{1 – [-3]}\)
m = \(\frac{-5}{1 + 3}\)
m = \(\frac{-5}{4}\)
Graphing Linear Functions Performance Task: The Cost of a T-Shirt
3.4–3.7 What Did You Learn?
Core Vocabulary
Core Concepts
Section 3.4
![]()
Section 3.5
![]()
Section 3.6
Section 3.7
![]()
Mathematical Practices
Question 1.
Explain how you determined what units of measure to use for the horizontal and vertical axes in Exercise 37 on page 142.
Answer:
In Exercise 37 on page 142,
The given function is
d (t)= (1/2)t + 6
The horizontal axis represents the time
The vertical axis represents the depth
Question 2.
Explain your plan for solving Exercise 48 on page 153.
Answer:
In Exercise 48 on page 153,
The profits of a school obtained by a school before playoffs and during the playoffs
First, plot the 2 equations in a coordinate plane and compare the functions in the coordinate plane
Performance Task
The Cost of a T-Shirt
You receive bids for making T-shirts for your class fundraiser from four companies. To present the pricing information, one company uses a table, one company uses a written description, one company uses an equation, and one company uses a graph. How will you compare the different representations and make the final choice? To explore the answers to this question and more, go to 

Graphing Linear Functions Chapter Review
3.1 Functions (pp. 103 – 110)
Determine whether the relation is a function. Explain.
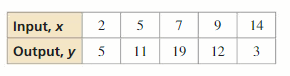
Answer:
Every input has exactly one output.
x represents the input
y represents the output
The given table is a function
Determine whether the relation is a function. Explain.
Question 1.
(0, 1), (5, 6), (7, 9)
Answer:
(0, 1), (5, 6), (7, 9)
Every input has exactly one output
x represents the input
y represents the output
The given relation is a function
Question 2.
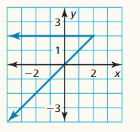
Answer:
Every input has exactly one output
x represents the input
y represents the output
From the graph,
The input ‘2’ has 2 outputs i.e., (2, 0), and (2, 2)
The given graph is not a function
Question 3.
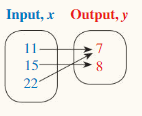
Answer:
Every input has exactly one output
x represents the input
y represents the output
The given relation is a function
Question 4.
The function y = 10x + 100 represents the amount y (in dollars) of money in your bank account after you babysit for x hours.
a. Identify the independent and dependent variables.
Answer:
y = 10x + 100
Where,
y represents the amount in dollars
x represents the number of hours
The independent variable of the given function is x
The dependent variable of the given function is y
b. You babysit for 4 hours. Find the domain and range of the function.
Answer:
y = 10x + 100
Where,
y represents the amount in dollars
x represents the number of hours
It is given that you babysit for 4 hours
The given value of x is 4
The maximum value of y is
y = 10 (4) + 100
y = 40 + 100
y = $140
The amount and the time must not be the negative values
The domain of the given function is 0 ≤ x ≤ 4
The range of the give function is 0 ≤ y ≤ 140
3.2 Linear Functions (pp. 111–120)
Does the table or equation represent a linear or nonlinear function? Explain.
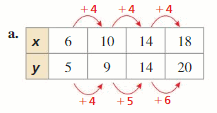
Answer:
As x increases by 4, y increases by different amounts. The rate of change is not constant.
The function is nonlinear.
b. y = 3x – 4
Answer:
The equation is in the form y = mx + b.
The equation represents a linear function.
Does the table or graph represent a linear or nonlinear function? Explain.
Question 5.
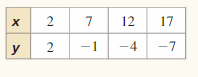
Answer:
The difference between all the values of x is 5
The difference between all the values of y is -3
Since there is a constant difference present between the values of x and the values of y,
The given table is a linear function
Question 6.
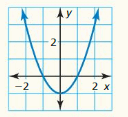
Answer:
The representation of a linear function in the graph is a “Straight line”
We can say that the given graph is not a straight line from the graph
We can conclude that the given graph is a non-linear function
Question 7.
The function y = 60 – 8x represents the amount y (in dollars) of money you have after buying x movie tickets.
(a) Find the domain of the function. Is the domain discrete or continuous? Explain.
Answer:
y = 60 – 8x
Where,
y represents the amount in dollars
x represents the number of movie tickets
The domain is the set of all the values of x so that the given function will be satisfied
Since x represents the number of movie tickets, the value of x can’t be negative and the number of tickets will be infinity
The domain of the given function is 0 ≤ x ≤ ∞
The domain is continuous
(b) Graph the function using its domain. Evaluate the function when x = -3, 0 and 5.
Answer:
y = 60 – 8x
x = -3
y = 60 – 8 (-3)
y = 60 + 24
y = 84
x = 0
y = 60 – 8 (0)
y = 60
x = 5
y = 60 – 8(5)
y = 60 – 40
y = 20
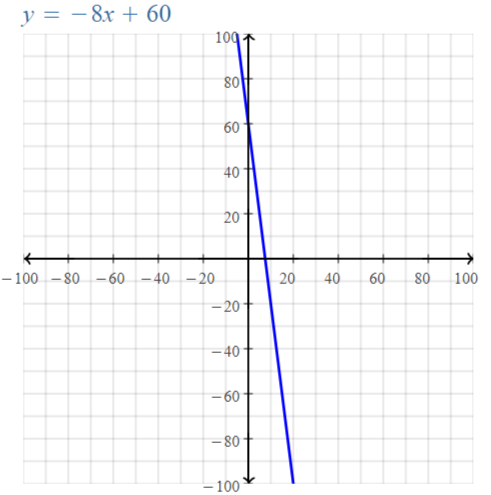
Question 8.
f(x) = x + 8
Answer:
f (x) = x + 8
The standard representation of the function f (x) is y
The standard representation of the linear equation is
y = mx + c
y = x + 8
We can conclude that the given equation is a linear equation
Find the value of x, so that the function has the given value.
Question 9.
g(x) = 4 – 3x
Answer:
Question 10.
k(x) = 7x; k(x) = 49
Answer:
k (x) = 7x with k (x) = 49
49 = 7x
x = 49 / 7
x = 7
Question 11.
r(x) = -5x – 1; r(x) = 19
Answer:
r (x) = 5x – 1 with r (x) = 19
19 = 5x – 1
5x = 19 + 1
5x = 20
x = 20 / 5
x = 4
Graph the linear function.
Question 12.
g(x) = -2x – 3
Answer:
g (x) = -2x – 3
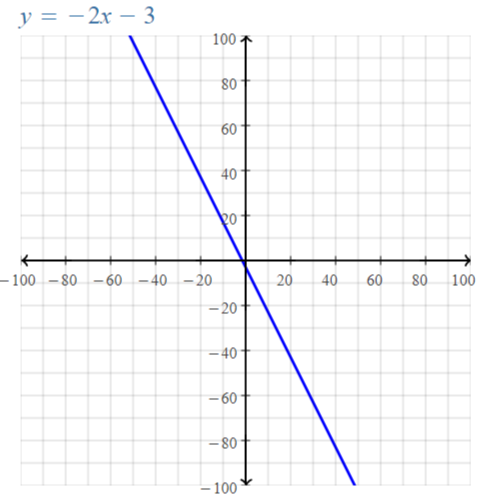
Question 13.
h(x) = \(\frac{2}{3}\)x + 4
Answer:
h (x) = \(\frac{2}{3}\)x + 4
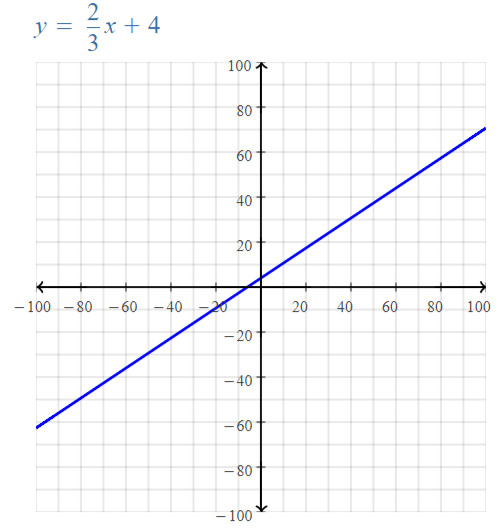
Question 14.
8x – 4y = 16
Answer:
8x – 4y = 16
4y = 8x – 16
y = \(\frac{8x 16}{4}\)
y = \(\frac{8x}{4}\) – \(\frac{16}{4}\)
y =2x – 4
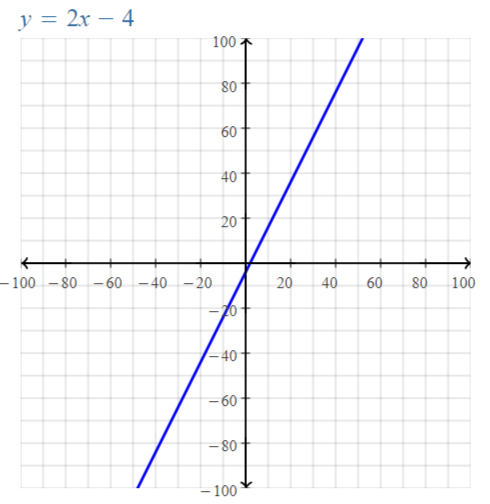
Question 15.
-12x – 3y = 36
Answer:
-12x – 3y = 36
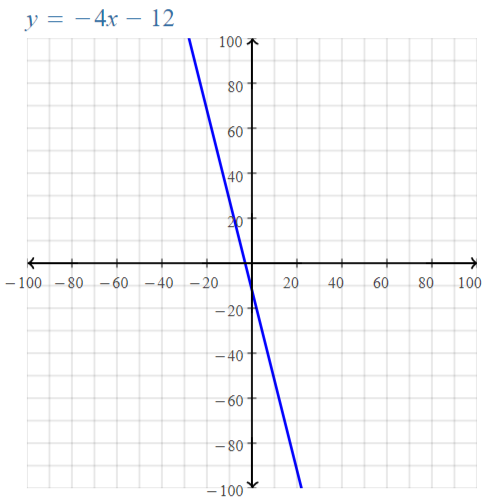
Question 16.
y = -5
Answer:
y = -5
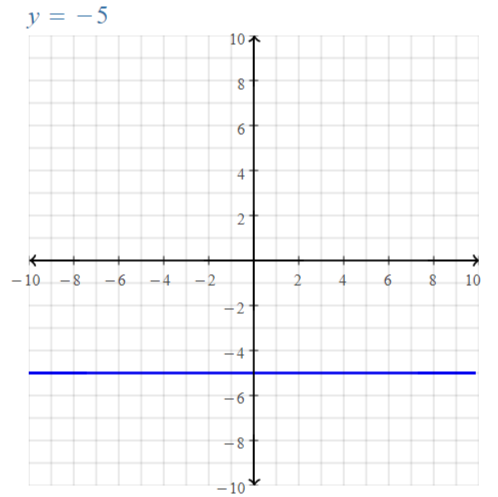
Question 17.
x = 6
Answer:
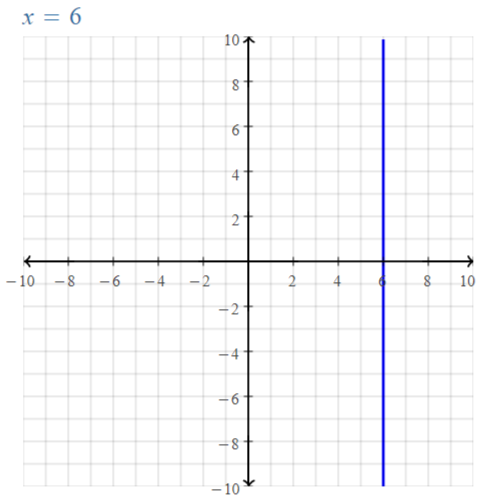
The points represented by the table lie on a line. Find the slope of the line.
Question 18.
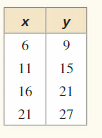
Answer:
If the input and output values are given in the form of a table,
We can take any 2 pairs of the input and output values to find the slope
The representation of ordered pairs to find the slope is
(x1, y1) = (6, 9),
(x2, y2) = (11, 15)
The slope of the line = \(\frac{y2 – y1}{x2 – x1}\)
m = \(\frac{15 – 9}{11 – 6}\)
m = \(\frac{6}{5}\)
Question 19.
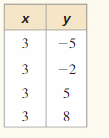
Answer:
If the input and output values are given in the form of a table,
We can take any 2 pairs of the input and output values to find the slope
The representation of ordered pairs to find the slope is
(x1, y1) = (3, -5),
(x2, y2) = (3, -2)
The slope of the line = \(\frac{y2 – y1}{x2 – x1}\)
= \(\frac{-2 – [-5]}{3 – 3}\)
= \(\frac{5 – 2}{0}\)
= Undefined or ∞
We can conclude that the slope of the given line is Undefined or ∞
Question 20.
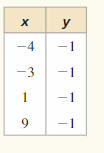
Answer:
If the input and output values are given in the form of the table,
We can take any 2 pairs of the input and output values to find the slope
The representation of ordered pairs to find the slope is
(x1, y1) = (-4, -1),
(x2, y2) = (-3, -1)
The slope of the line = \(\frac{y2 – y1}{x2 – x1}\)
= \(\frac{-1 – [-1]}{-3 – [-4]}\)
= \(\frac{-1 + 1}{-3 + 4}\)
= 0
Graph the linear equation. Identify the x-intercept.
Question 21.
y = 2x + 4
Answer:
y = 2x + 4
To find the x-intercept, put y = 0
2x + 4 = 0
2x = -4
x = -4 / 2
x = -2
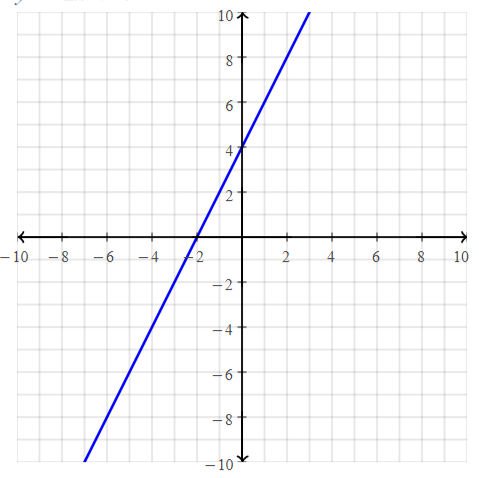
Question 22.
-5x + y = -10
Answer:
-5x + y = -10
To find the x-intercept, put y = 0
-5x + 0 = -10
-5x = -10
5x = 10
x = 10 / 5
x = 2
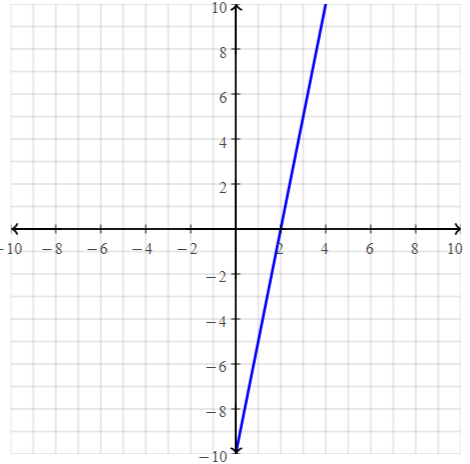
Question 23.
x + 3y = 9
Answer:
x + 3y = 9
To find the x-intercept, put y = 0
x + 0 = 9
x = 9
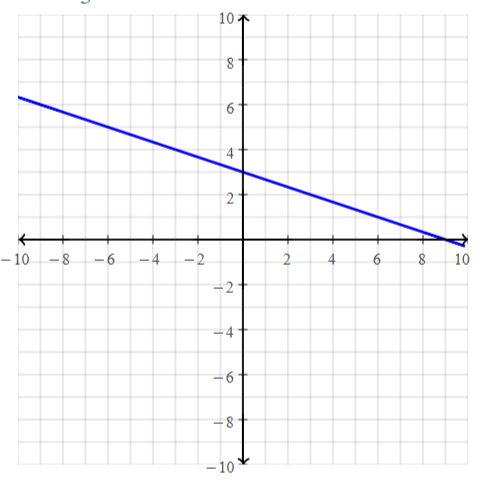
Question 24.
A linear function h models a relationship in which the dependent variable decreases 2 units for every 3 units the independent variable increases. Graph h when h(0) = 2. Identify the slope, y-intercept, and x-intercept of the graph. Let f(x) = 3x + 4. Graph f and h. Describe the transformation from the graph of f to the graph of h.
Answer:
x represents the independent variable
y represents the dependent variable
The given x value is 3
The given y value is -2
The rate of change (or) slope (m) = \(\frac{y}{x}\)
= \(\frac{-2}{3}\)
= –\(\frac{2}{3}\)
It is also given that h (0) = 2
That means the y-intercept of h (x) is 2 when x is 0
The representation of the standad form of the linear equation is:
y = mx + c
h (x) =-\(\frac{2}{3}\)x + 2
The other given function is:
f (x) = 3x + 4
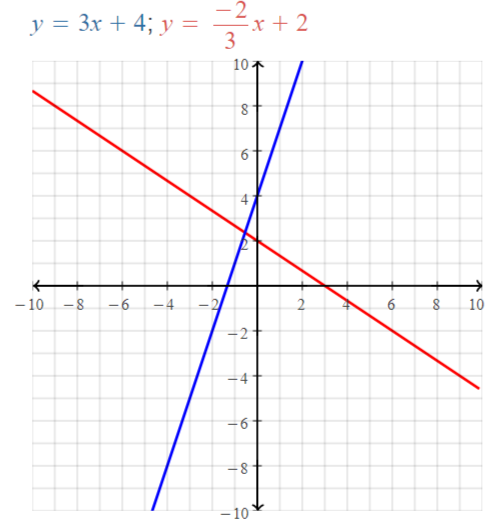
We can conclude that h (x) is 1.5 units away from f (x) on the x-axis
Let f(x) = 3x + 4.Graph f and h. Describe the transformation from the graph of f to the graph of h.
Question 25.
h(x) = f(x + 3)
Answer:
f (x) = 3x + 4
h (x) = f (x + 3)
h (x) = 3 (x + 3) + 4
h (x) = 3 (x) + 3 (3) + 4
h (x) = 3x + 9 + 4
h (x) = 3x + 13
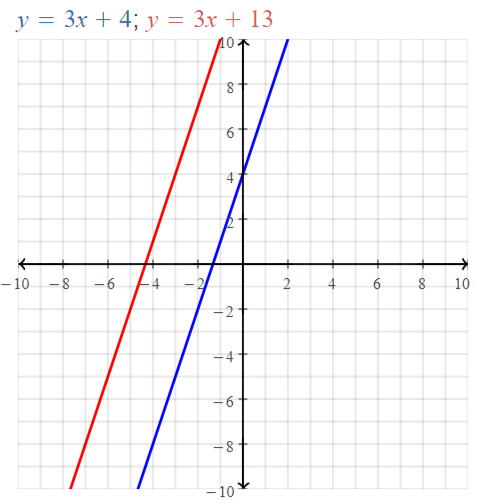
We can conclude that f (x) and h (x) are parallel lines
Question 26.
h(x) = f(x) + 1
Answer:
f (x) = 3x + 4
h (x) = f (x) + 1
h (x) = 3x + 4 + 1
h (x) = 3x + 5
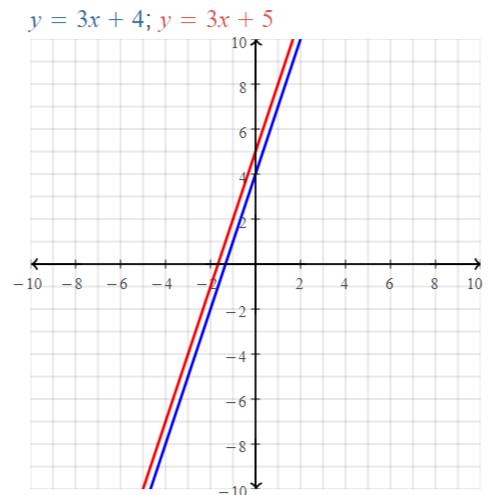
We can conclude that f (x) and h (x) are the paralel lines
Question 27.
h(x) = f(-x)
Answer:
f (x) = 3x + 4
h (x) = f (-x)
h (x) = 3 (-x) + 4
h (x) = -3x + 4
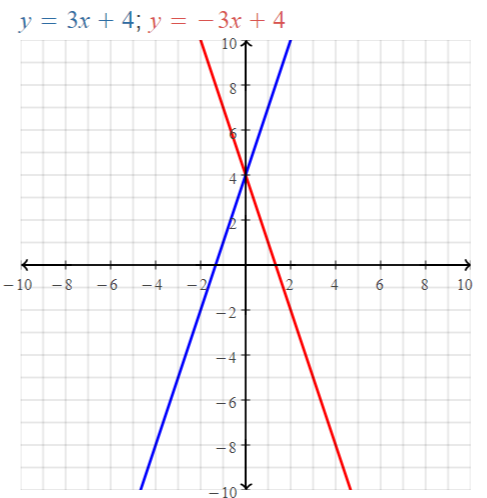
We can conclude that h (x) and f (x) are inversions of each other
Question 28.
h(x) = -f(x)
Answer:
f (x) = 3x + 4
h (x) = -f (x)
h (x) = – (3x + 4)
h (x) = -3x – 4
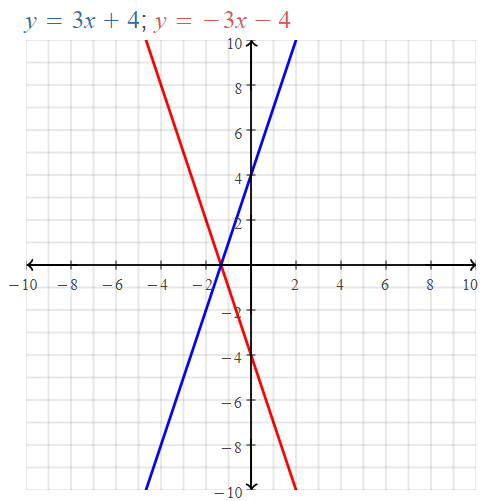
We can conclude that h (x) and f (x) are reflections to each other
Question 29.
h(x) = 3f(x)
Answer:
f (x) = 3x + 4
h (x) = 3 f (x)
h (x) = 3 (3x + 4)
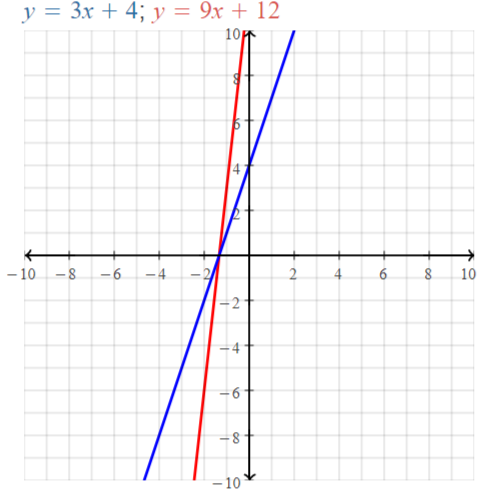
We can conclude that h (x) is a vertical stretch of f (x)
Question 30.
h(x) = f(6x)
Answer:
f (x) = 3x + 4
h (x) = f (6x)
h (x) = 3 (6x) + 4
h (x) = 18x + 4
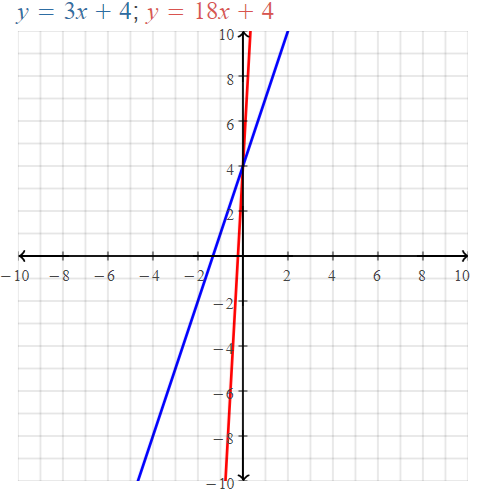
We can conclude that h (x) translates 2 units away from f (x) on the x-axis
Question 31.
Graph f(x) = x and g(x) = 5x + 1. Describe the transformations from the graph of f to the graph of g.
Answer:
f (x) = x
g (x) = 5x + 1
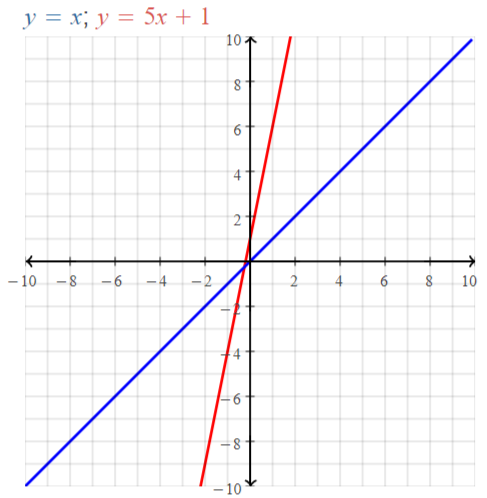
We can conclude that g (x) translates away 8 units away from f (x) on the x-axis
Graph the function. Compare the graph to the graph of f(x) = | x |. Describe the domain and range.
Question 32.
m(x) = | x | + 6
Answer:
f (x) = | x |
m (x) = | x | + 6
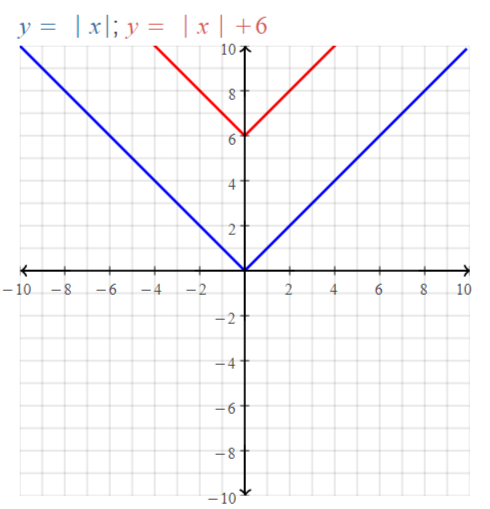
The domain of f (x) is -10 ≤ x ≤ 10
The domain of m (x) is -4 ≤ x ≤ 4
The range of m (x) is 0 ≤y ≤ 10
The range of f (x) is 0 ≤ y ≤10
The range of m (x) is 6 ≤y ≤10
Question 33.
p(x) = | x – 4 |
Answer:
f (x) = | x |
p (x) = | x – 4 |
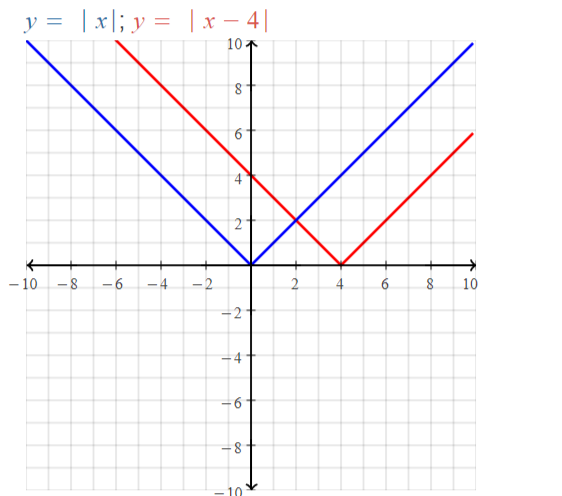
We can conclude that p (x) translates 1 unit up from the positive x-axis
The domain of f (x) is -10 ≤ x ≤ 10
The domain of p (x) is -6 ≤ x ≤ 10
The range of f (x) is 0 ≤ y ≤10
The range of p (x) is 6 ≤y ≤10
Question 34.
q(x) = 4 | x |
Answer:
f (x) = | x |
q (x) = 4 | x |
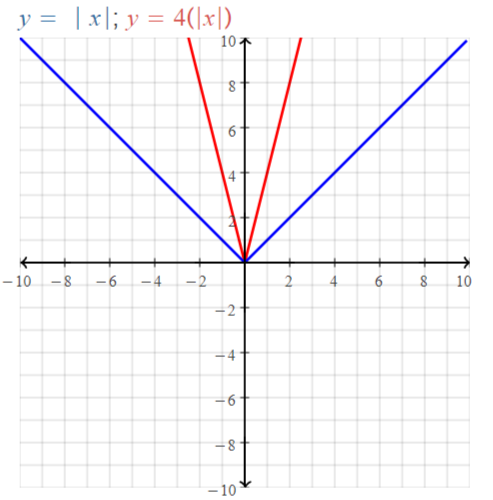
We can conclude that q (x) translates 7 units up from the positive x-axis
The domain of f (x) is -10 ≤ x ≤ 10
The domain of q (x) is -2.5 ≤ x ≤ 2.5
The range of q (x) is 0 ≤y ≤ 10
The range of f (x) is 0 ≤ y ≤10
Question 35.
r(x) = –\(-\frac{1}{4}\)| x |
Answer:
f (x) = | x |
r (x) = –\(-\frac{1}{4}\) | x |
r (x) = \(\frac{1}{4}\) | x |
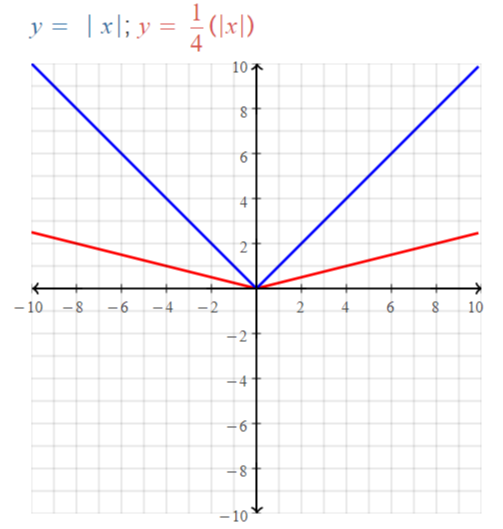
We can conclude that r (x) translates units up from the positive x-axis
The domain of f (x) is -10 ≤ x ≤ 10
The domain of r (x) is -10 ≤ x ≤ 10
The range of r (x) is 0 ≤y ≤ 2
The range of f (x) is 0 ≤ y ≤10
Question 36.
Graph f(x) = | x – 2 | + 4 and g(x) = | 3x – 2 | + 4. Compare the graph of g to the graph of f.
Answer:
f (x) = | x – 2 | + 4
g (x) = | 3x – 2 | + 4
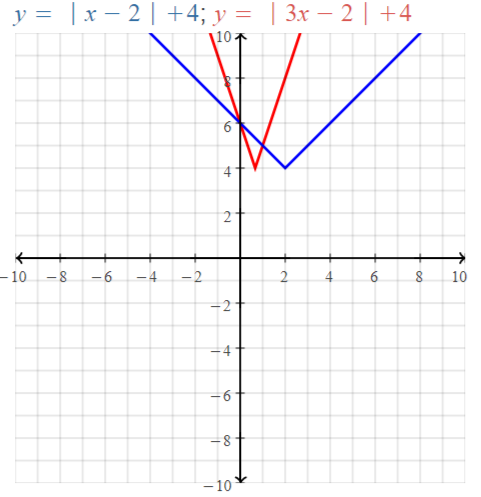
We can conclude that g (x) translates 5 units away from f (x) on the x-axis
Question 37.
Let g(x) = \(\frac{1}{3}\) | x – 1 | – 2.
(a) Describe the transformations from the graph of f(x) = | x | to the graph of g.
Answer:
f (x) = | x |
g (x) = \(\frac{1}{3}\) | x – 1 | – 2
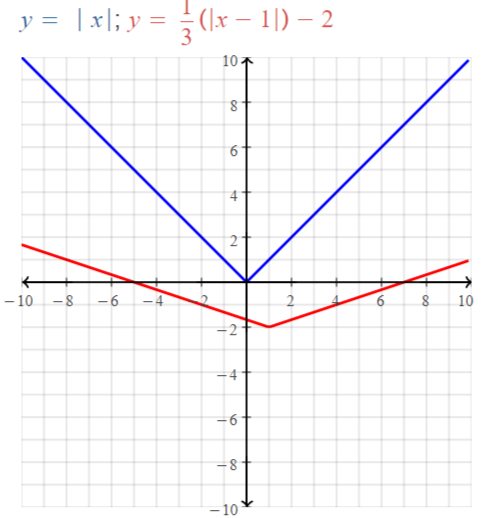
We can conclude that g (x) translates 2 units away from f (x) on the y-axis
(b) Graph g.
Answer:
g (x) = \(\frac{1}{3}\) | x – 1 | – 2
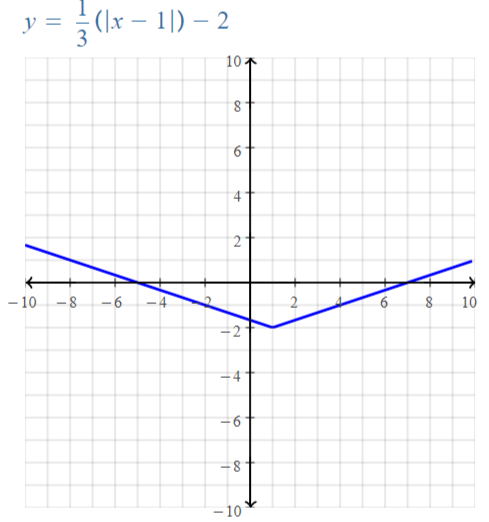
Graphing Linear Functions Chapter Test
Determine whether the relation is a function. If the relation is a function, determine whether the function is linear or nonlinear. Explain.
Question 1.
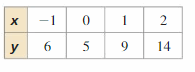
Answer:
Every input has exactly one output
The constant between all the values of x is 1
There is no constant difference between all the values of y
Since there is no constant rate of change,
We can conclude that the obtained function is a non-linear function
Question 2.
y = -2x + 3
Answer:
y = -2x + 3
The standard form of the linear equation is
y = mx + c
For a relation to be a function, every input has exactly only one output
The given equation is a function and it is a linear function
Question 3.
x = -2
Answer:
x = -2
A relation is said to be a function if every input has exactly one output
For x = -2
The input is 2
The output is 0
The given equation is a function
For a given function to be a linear function, it will be in the form
y = mx + c
We can conclude that the given function is a non-linear function
Graph the equation and identify the intercept(s). If the equation is linear, find the slope of the line.
Question 4.
2x – 3y = 6
Answer:
2x – 3y = 6
3y = 2x – 6
y = \(\frac{2x – 6}{3}\)
y = \(\frac{2x}{3}\) – \(\frac{6}{3}\)
y = \(\frac{2}{3}\)x – 2
The above equation is in the form of
y = mx + c
The given equation is a linear equation
m = \(\frac{2}{3}\)
The y-intercept is -2
To find the x-intercept, put y = 0
\(\frac{2}{3}\)x – 2 = 0
x = 3
Slope (m) = \(\frac{2}{3}\)
The x-intercept is 3
The y-intercept is -2
Question 5.
y = 4.5
Answer:
y = 4.5
The given equation is not in the form of
y = mx + c
The given equation is non-linear
Question 6.
y = | x – 1 | – 2
Answer:
y = | x – 1 | – 2
| x | = x for x > 0
| x | = -x for x < 0
y = x – 1 – 2 or y = -(x – 1) – 2
y = x – 3 or y = -x + 1 – 2
y = x – 3 or y = -x – 1
The above 2 equations are in the form of
y = mx + c
The slope is 1 or -1
The y-intercept is -3 or -1
To find the x-intercept, put y =0
0 = x – 3 or 0 = -x – 1
x = 3 or x = -1
The slope is 1 or -1
The x-intercept is 3 or -1
The y-intercept is -3 or -1
Find the domain and range of the function represented by the graph. Determine whether the domain is discrete or continuous. Explain.
Question 7.
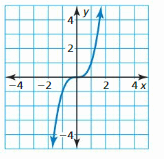
Answer:
We can observe that the graph is not a straight line
We can say that the given graph is a non-linear function
We can conclude that the domain is continuous by observing the graph
Question 8.
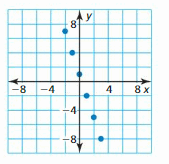
Answer:
We can observe that the points form a straight line
We can say that the given graph is a linear function
We can conclude that the domain is continuous since all the points are connected
Graph f and g. Describe the transformations from the graph of f to the graph of g.
Question 9.
f(x) = x; g(x) = -x + 3
Answer:
f (x) = x
g (x) = -x + 3
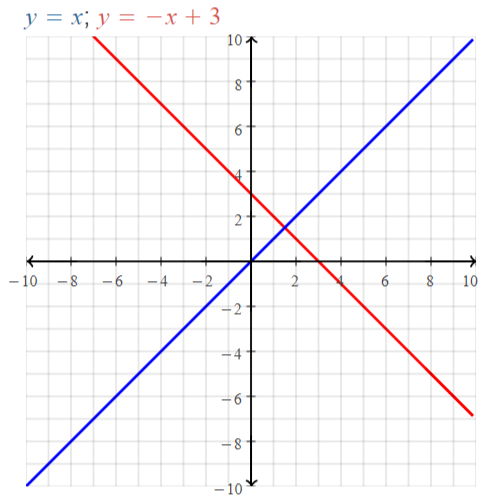
We can conclude that f (x) and g (x) are perpendicular lines with a slope of -1
Question 10.
f(x) = | x | ; g(x) = | 2x + 4 |
Answer:
f (x) = | x |
g (x) = | 2x + 4 |
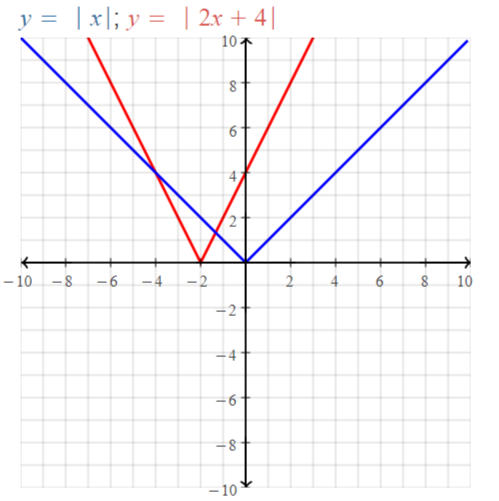
We can conclude that g (x) is 2 units away from f (x) on the x-axis
Question 11.
Function A represents the amount of money in a jar based on the number of quarters in the jar. Function B represents your distance from home over time. Compare the domains.
Answer:
Function A represents the amount of money in a jar based on the number of quarters in the jar
Function B represents your distance from home over time
The distance should be greater than or equal to 0
The amount is greater than or equal to a quarter of the amount of the money
The domain of function A is \(\frac{1}{4}\) ≤ x ≤ ∞
The domain of function B is 0 ≤ x ≤ ∞
Question 12.
A mountain climber is scaling a 500-foot cliff. The graph shows the elevation of the climber over time.
a. Find and interpret the slope and the y-intercept of the graph.
b. Explain two ways to find f(3). Then find f(3) and interpret its meaning.
c. How long does it take the climber to reach the top of the cliff? Justify your answer.
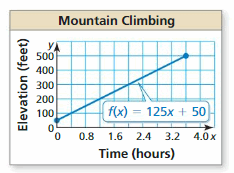
Answer:
a. A mountain climber is scaling a 500-foot cliff.
The equation that shows the elevation of the climber over the tie is
f (x) = 125x + 50
The standard representation of the output for the function output is y
y = 125x + 50
Compare the above equation with
y = mx + c
m = 125 and the y-intercept is 50
The slope of the given equation is 125
The y-intercept of the given equation is 50
b. f (x) = 125x + 50
f (3) = 125 (3) + 50
f (3) = 375 + 50
f (3) = 425
We can conclude that for 3 hours, the climber climbs 425 feet
c. The top of the hill is the maximum height i.e., the highest value on the y-axis
We can conclude that it takes 4 hours to reach the top of the cliff
Question 13.
Without graphing, compare the slopes and the intercepts of the graphs of the functions f(x) = x + 1 and g(x) = f(2x).
Answer:
f (x) = x + 1
g (x) = f (2x)
g (x) = 2x + 1
Compare f (x) and g (x) with the standard linear equation
y = mx + c
For f (x),
m = 1 and c = 1
c is the y-intercept
For g (x),
m = 2 and c = 1
Where,
c is the y-intercept
Question 14.
A rock band releases a new single. Weekly sales s (in thousands of dollars) increase and then decrease as described by the function s(t) = -2 | t – 20 | + 40, where t is the time (in weeks).
a. Identify the independent and dependent variables.
b. Graph s. Describe the transformations from the graph of f(x) = | x | to the graph of s.
Answer:
a. s(t) = -2 | t – 20 | + 40
where,
t is the time (in weeks)
The independent variable of the given function is t
The dependent variable of the given function is s (t)
b. f (x) = | x |
s (t) = -2 | t – 20 | + 40
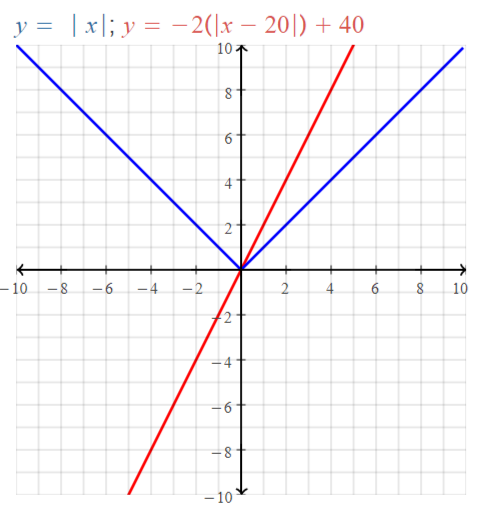
We can conclude that s (t) translates 5 units away from f (x) on the y-axis
Graphing Linear Functions Cumulative Assessment
Question 1.
You claim you can create a table of values that represents a linear function. Your friend claims he can create a table of values that represents a nonlinear function. Using the given numbers, what values can you use for x (the input) and y (the output) to support your claim? What values can your friend use?
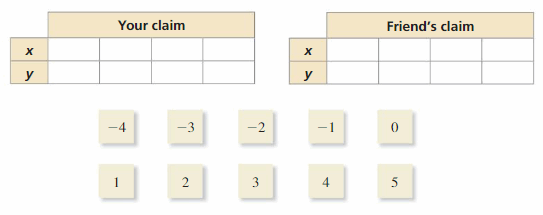
Answer:
You claim you can create a table of values that represents a linear function. Your friend claims he can create a table of values that represents a nonlinear function.
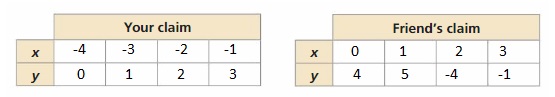
Question 2.
A car rental company charges an initial fee of $42 and a daily fee of $12.
a. Use the numbers and symbols to write a function that represents this situation.
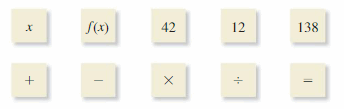
b. The bill is $138. How many days did you rent the car?
Answer:
a. A car rental company charges an initial fee of $42 and a daily fee of $12
The function that represents the situation is
f (x) = (42 + 12) × x
f (x) = 52x
x is the number of days that you rent the car
b. Given that the bill is: $138
138 = 52x
x = 138 ÷ 52
x = 3
Hence, you can rent the car for 3 days
Question 3.
Fill in values for a and b so that each statement is true for the inequality ax − b> 0.
a. When a = _____ and b = _____, x > \(\frac{b}{a}\).
b. When a = _____ and b = _____, x < \(\frac{b}{a}\).
Answer:
a. ax – b > 0
ax > b
x > b / a
b. The value of a is greater than b and the value of b is less than a
Question 4.
Fill in the inequality with <, ≤, >, or ≥ so that the solution of the inequality is represented by the graph.
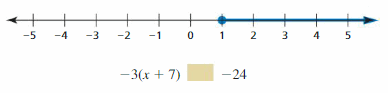
Answer:
-3 (x + 7) _____ -24
-3 (x) – 3 (7) _____ -24
-3x – 21 _____ -24
-3x ____ -24 + 21
-3x ____-3
3x ____ 3
x ____ 3 / 3
x ____ 1
The marked line represented from 1 including 1 and continued till the right end of the number line
x ≥ 1
We can conclude that the symbol used for the given inequality is ≥
Question 5.
Use the numbers to fill in the coefficients of ax + by = 40 so that when you graph the function, the x-intercept is -10 and the y-intercept is 8.
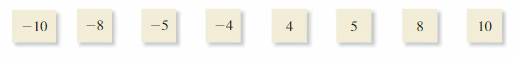
Answer:
ax + by = 40
Given that the x-intercept and the y-intercept is -10 and 8
To find the x-intercept, put y = 0
ax = 40
a (-10) = 40
a = -40 / 10
a = -4
To find the y-intercept, put x = 0
by = 40
b (8) = 40
b = 40 / 8
b = 5
The values of a and b are -4 and 5
Question 6.
Solve each equation. Then classify each equation based on the solution. Explain your reasoning.
a. 2x – 9 = 5x – 33
Answer:
2x – 9 = 5x – 33
2x – 5x = -33 + 9
-3x = -24
x = 24 / 3
x = 8
b. 5x – 6 = 10x + 10
Answer:
5x – 6 = 10x + 10
5x – 10x = 10 + 6
-5x = 16
x = -16 / 5
We can conclude that the given expression has only 1 solution
c. 2(8x – 3) = 4(4x + 7)
Answer:
2 (8x – 3 ) = 4 (4x + 7)
2 (8x) – 2 (3) = 4 (4x) + 4(7)
16x – 6 = 16x + 28
We can conclude that the given expression has no solution
d. -7x + 5 = 2(x – 10.1)
Answer:
-7x + 5 = 2 (x – 10.1)
-7x + 5 = 2x – 20.2
-7x – 2x = -20.2 – 5
-9x = -25.2
x = 25.9 / 9
We can conclude that the given expression has only 1 solution
e. 6(2x + 4) = 4(4x + 10)
Answer:
6 (2x + 4) = 4 (4x + 10)
12x + 24 = 16x + 40
12x – 16x = 40 – 24
-4x = 16
x = -16 / 4
x = -4
We can conclude that the given expression has only 1 solution
f. 8(3x + 4) = 2(12x + 16)
Answer:
8 (3x + 4) = 2 (12x + 16)
24x + 32 = 24x + 32
We can conclude that the given expression has no solution
Question 7.
The table shows the cost of bologna at a deli. Plot the points represented by the table in a coordinate plane. Decide whether you should connect the points with a line. Explain your reasoning.
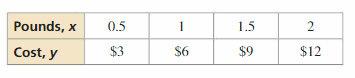
Answer:
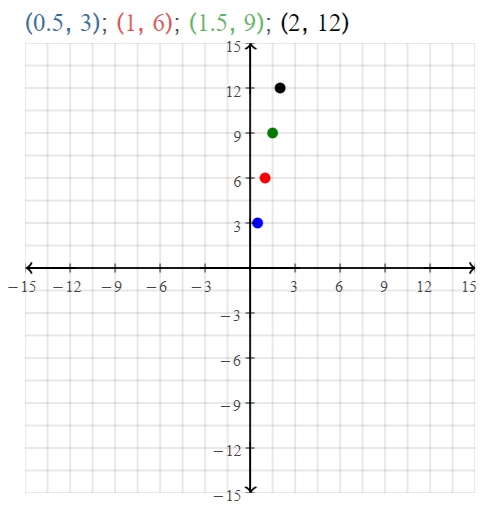
We can say that we can connect the points in the graph
Question 8.
The graph of g is a horizontal translation right, then a vertical stretch, then a vertical translation down of the graph of f(x) = x. Use the numbers and symbols to create g.
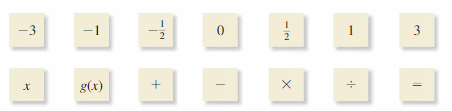
Answer:
f (x) = x
f (x) can be re-written as f
g (x) can b ere-written as g
Let the operations performed on f (x) can be expressed in terms of g (x)
Horizontal translation right:
g (x) = f (x) – 3 or g (x) = f (x) – 1 or g (x) f (x) – (1/2)
Vertical stretch:
g (x) = 3 f (x)
Vertical translation down:
g (x) = f (x – 1)
Question 9.
What is the sum of the integer solutions of the compound inequality 2 | x – 5 | < 16?
A. 72
B. 75
C. 85
D. 88
Answer:
2 | x – 5 | < 16
2 (x – 5) < 16 and 2 (x – 5 ) > -16
2x – 10 < 16 and 2x – 10 > -16
2x < 26 and 2x >-6
x < 13 and x > -3
The solution of the given compound inequality is -3 < x < 13
The sum of all the integers = -2 – 1 + 0 + 1 + 2 + 3 + 4 + 5+ 6 + 7 + 8 +9 + 10 + 11 + 12
= 75
The sum of all the integers is 75
Question 10.
Your bank offers a text alert service that notifies you when your checking account balance drops below a specific amount. You set it up so you are notified when your balance drops below $700. The balance is currently $3000. You only use your account for paying your rent (no other deposits or deductions occur). Your rent each month is $625.
a. Write an inequality that represents the number of months m you can pay your rent without receiving a text alert.
Answer:
Your bank offers a text alert service that notifies you when your checking account balance drops below a specific amount. You set it up so you are notified when your balance drops below $700. The balance is currently $3000. You only use your account for paying your rent (no other deposits or deductions occur). Your rent each month is $625.
Let m be the number of months
The inequality that represents the number of months you can pay rent without receiving a text is
3000 – 625x > 700
b. What is the maximum number of months you can pay your rent without receiving a text alert?
Answer:
The inequality that represents the number of months m without receiving a text alert is
3000 – 625x > 700
3000 – 700 > 625x
2300 > 625x
2300 / 625 > x
3.68 > x
x < 4 months
We can conclude that the maximum number of months you can pay your rent without receiving a text alert is 4 months
c. Suppose you start paying rent in June. Select all the months you can pay your rent without making a deposit.

Answer:
From part (b),
The maximum number of months is:
x < 4 months
You start paying rent in June
All the months you can pay your rent without making a deposit is June, July, August